2159
Tractography of Human Intervertebral Disc Using High Resolution Diffusion Tensor Imaging1Institute of Electrical Engineering, Chinese Academy of Sciences, Beijing, China, 2University of Chinese Academy of Sciences, Beijing, China, 3Department of Radiology, University of California San Diego, San Diego, CA, United States, 4Radiology Service, Veterans Affairs San Diego Healthcare System, San Diego, CA, United States, 5Department of Bioengineering, University of California San Diego, San Diego, CA, United States
Synopsis
Keywords: Tractography, Tractography & Fibre Modelling, Spine;Intervertebral disc
Motivation: Evaluation of the fiber microstructure is valuable for assessing IVD degeneration.
Goal(s): To investigate the three-dimensional fiber structure and orientation of the intact IVD.
Approach: A high resolution DTI protocol was used to reconstruct the 3D fiber structure of an IVD specimen at the microstructural level on a 3T MRI scanner.
Results: The concentric lamella structure and interlamellar fibers were observed in the AF. The AF fiber orientations exhibited circumferential variability around the AF ring. The nucleus pulposus fibers exhibited a tri-directional distribution with perpendicular orientations. The major fibers in the cartilaginous endplate were horizontally orientated in the anterior-posterior direction.
Impact: The primary fiber orientations within human IVD tissues, including those of the annulus fibrosus, nucleus pulposus, and cartilaginous endplate, were observed using high resolution DTT, which may be a promising tool for IVD degeneration and regeneration study.
Introduction
The intervertebral disc (IVD) is an essential element of the spinal column. It offers flexibility and accommodates varying mechanical loads from the weight of the body and muscular activities, while allowing torsion and flexion. IVD degeneration, characterized by alterations in biochemical constituents and collagen fiber integrity, has been closely linked to back pain (1-3). MRI is a commonly utilized, noninvasive tool for the diagnosis of degenerative disc disease, yet clinical T1 and T2-weighted images do not adequately reveal the IVD microstructure. Imaging fiber structure within IVD tissues, including the annulus fibrosus (AF), nucleus pulposus (NP) and cartilaginous endplate (CEP), could be of considerable value in diagnosing and assessing changes in IVD degeneration. This could be of particular value in regenerative medicine and the development of tissue engineering-based treatments for IVD disease (4). Diffusion tensor tractography (DTT) has found utility in demonstrating fiber structure in a range of musculoskeletal tissues (5, 6). However, investigations of fiber structure in human IVD remain scarce. A recent endeavor by Stein et al. utilized DTT to visualize the 3D AF fibers in IVD samples (7). However, the scope was limited to the AF and did not encompass the CEP and NP of the IVD.In this study, we used a high resolution diffusion tensor imaging (DTI) protocol to reconstruct the 3D fiber structure of the AF, NP, and CEP in an IVD specimen at the microstructural level.
Methods
A human cadaveric thoracic IVD specimen (T9-10, 75 years, female) was scanned with a 3D high resolution diffusion weighted spin echo (DW-SE) protocol using a 3T pre-clinical MRI scanner (Bruker BioSpec, Billerica, MA, USA). The protocol included two different b values: b = 0 s/mm2 (without diffusion weighting) for three scans and b = 600 s/mm2 for 15 different directions. The other sequence parameters were as follows: TR/TE = 500/9 ms, bandwidth = 151.52 kHz; matrix size = 250×180×90, field of view = 50×36×18 mm3, isotropic spatial resolution 200 mm. With a short TE of 9 ms, the short T2 CEP could be imaged using the DTI sequence. The total imaging time was about 135 hours.The diffusion tensor model was used to quantify diffusion properties, including the fractional anisotropy (FA), mean diffusivity (MD), axial diffusivity (AD), and radial diffusivity (RD). Whereafter, the IVD was manually segmented into four different zones (i.e., the AF, NP, and superior and inferior CEPs) on the MD images using ITK-SNAP software (http://www.itksnap.org/pmwiki/pmwiki.php). Tractography was obtained using the DSI Studio toolbox (https://dsi-studio.labsolver.org/).
Results and Discussion
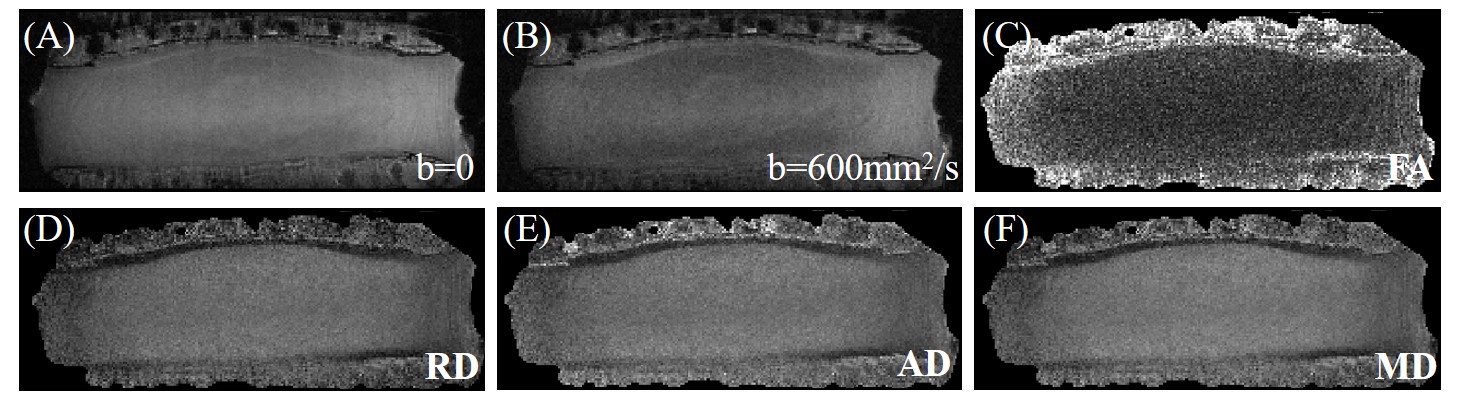
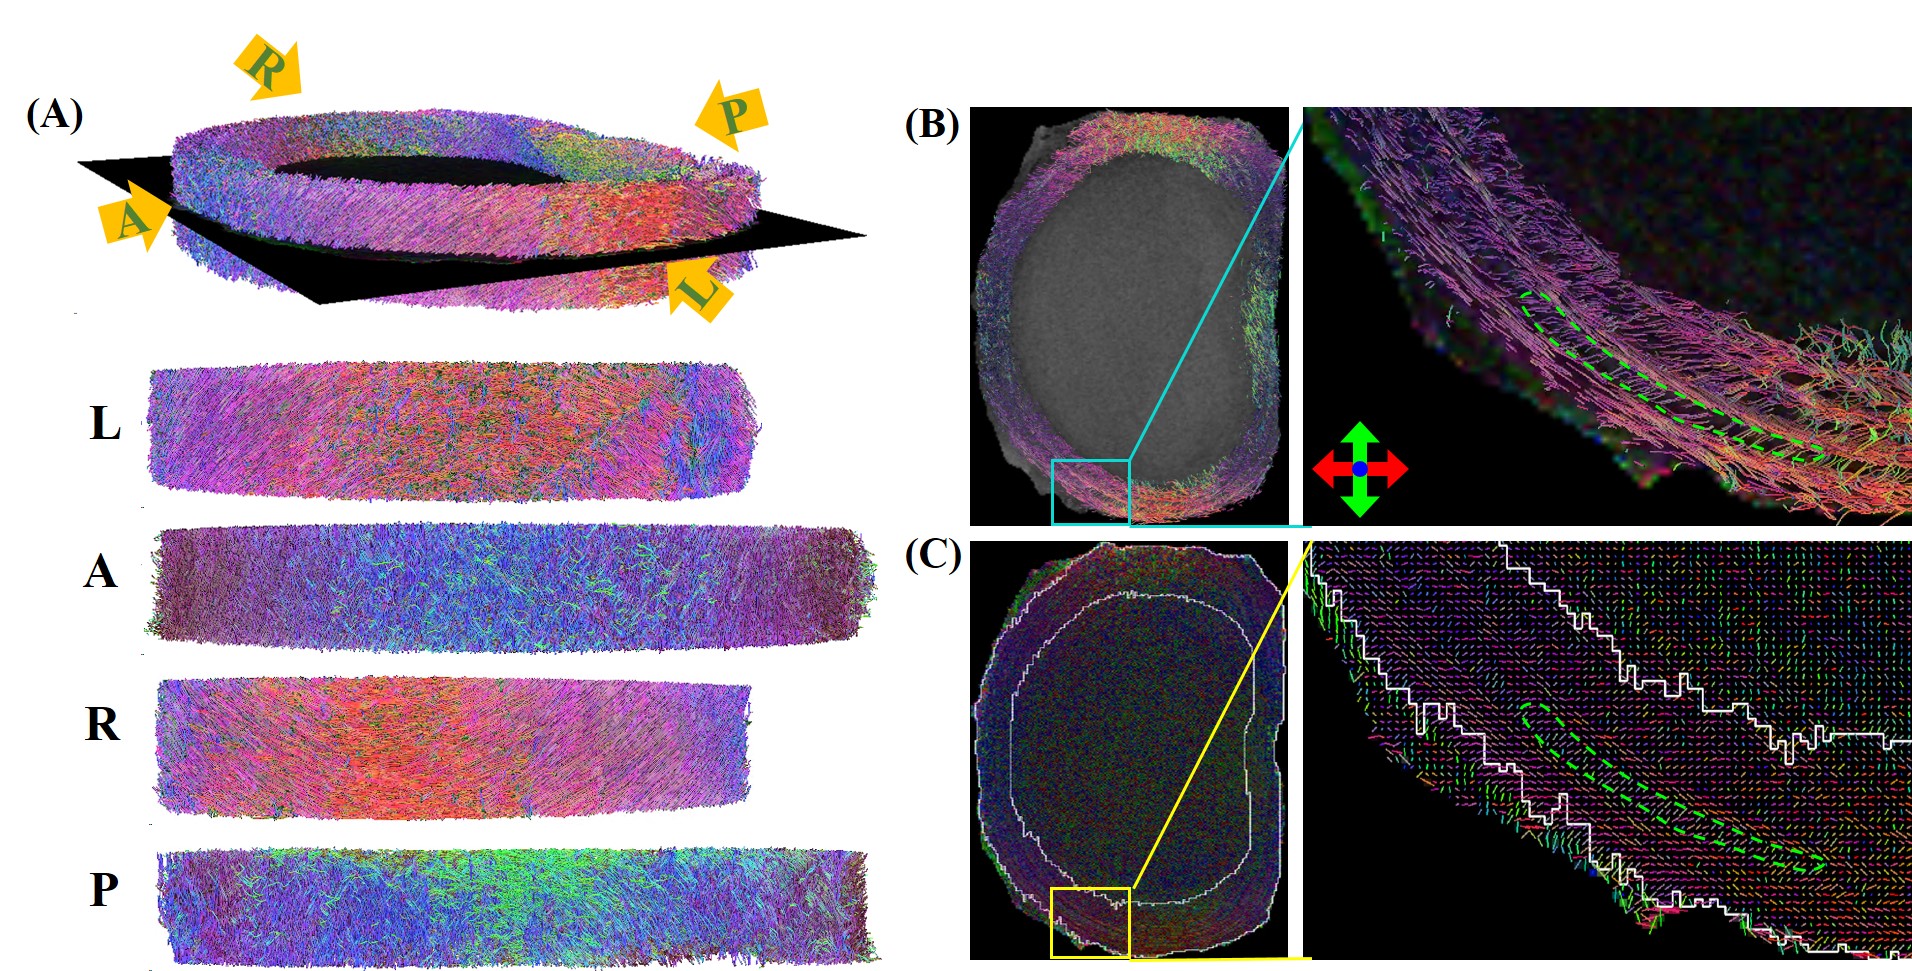
Figure 1 shows representative DW-SE images of the human IVD sample, with and without diffusion weighting, as well as DTI parameter maps of FA, RD, AD, and MD. The RD, AD, and MD maps show high contrast between the AF, NP, and CEP. Contrast is less pronounced on the DW-SE images and the FA map.Figure 2A depicts a 3D representation of the AF fibers. Their orientations exhibit circumferential variability around the AF ring: fibers on the anterior and posterior aspects align vertically, while those on the lateral aspects align horizontally in the anterior-posterior direction. The axial cross-section reveals distinct concentric layers both in the fiber structure (Figure 2B) and the orientation map (Figure 2C). Enlarged views of Figure 2B and 2C prominently display interlamellar fibers, indicated by green dotted lines. These observations are consistent with histological studies utilizing polarized light microscopy (8) and light microscopy (9).
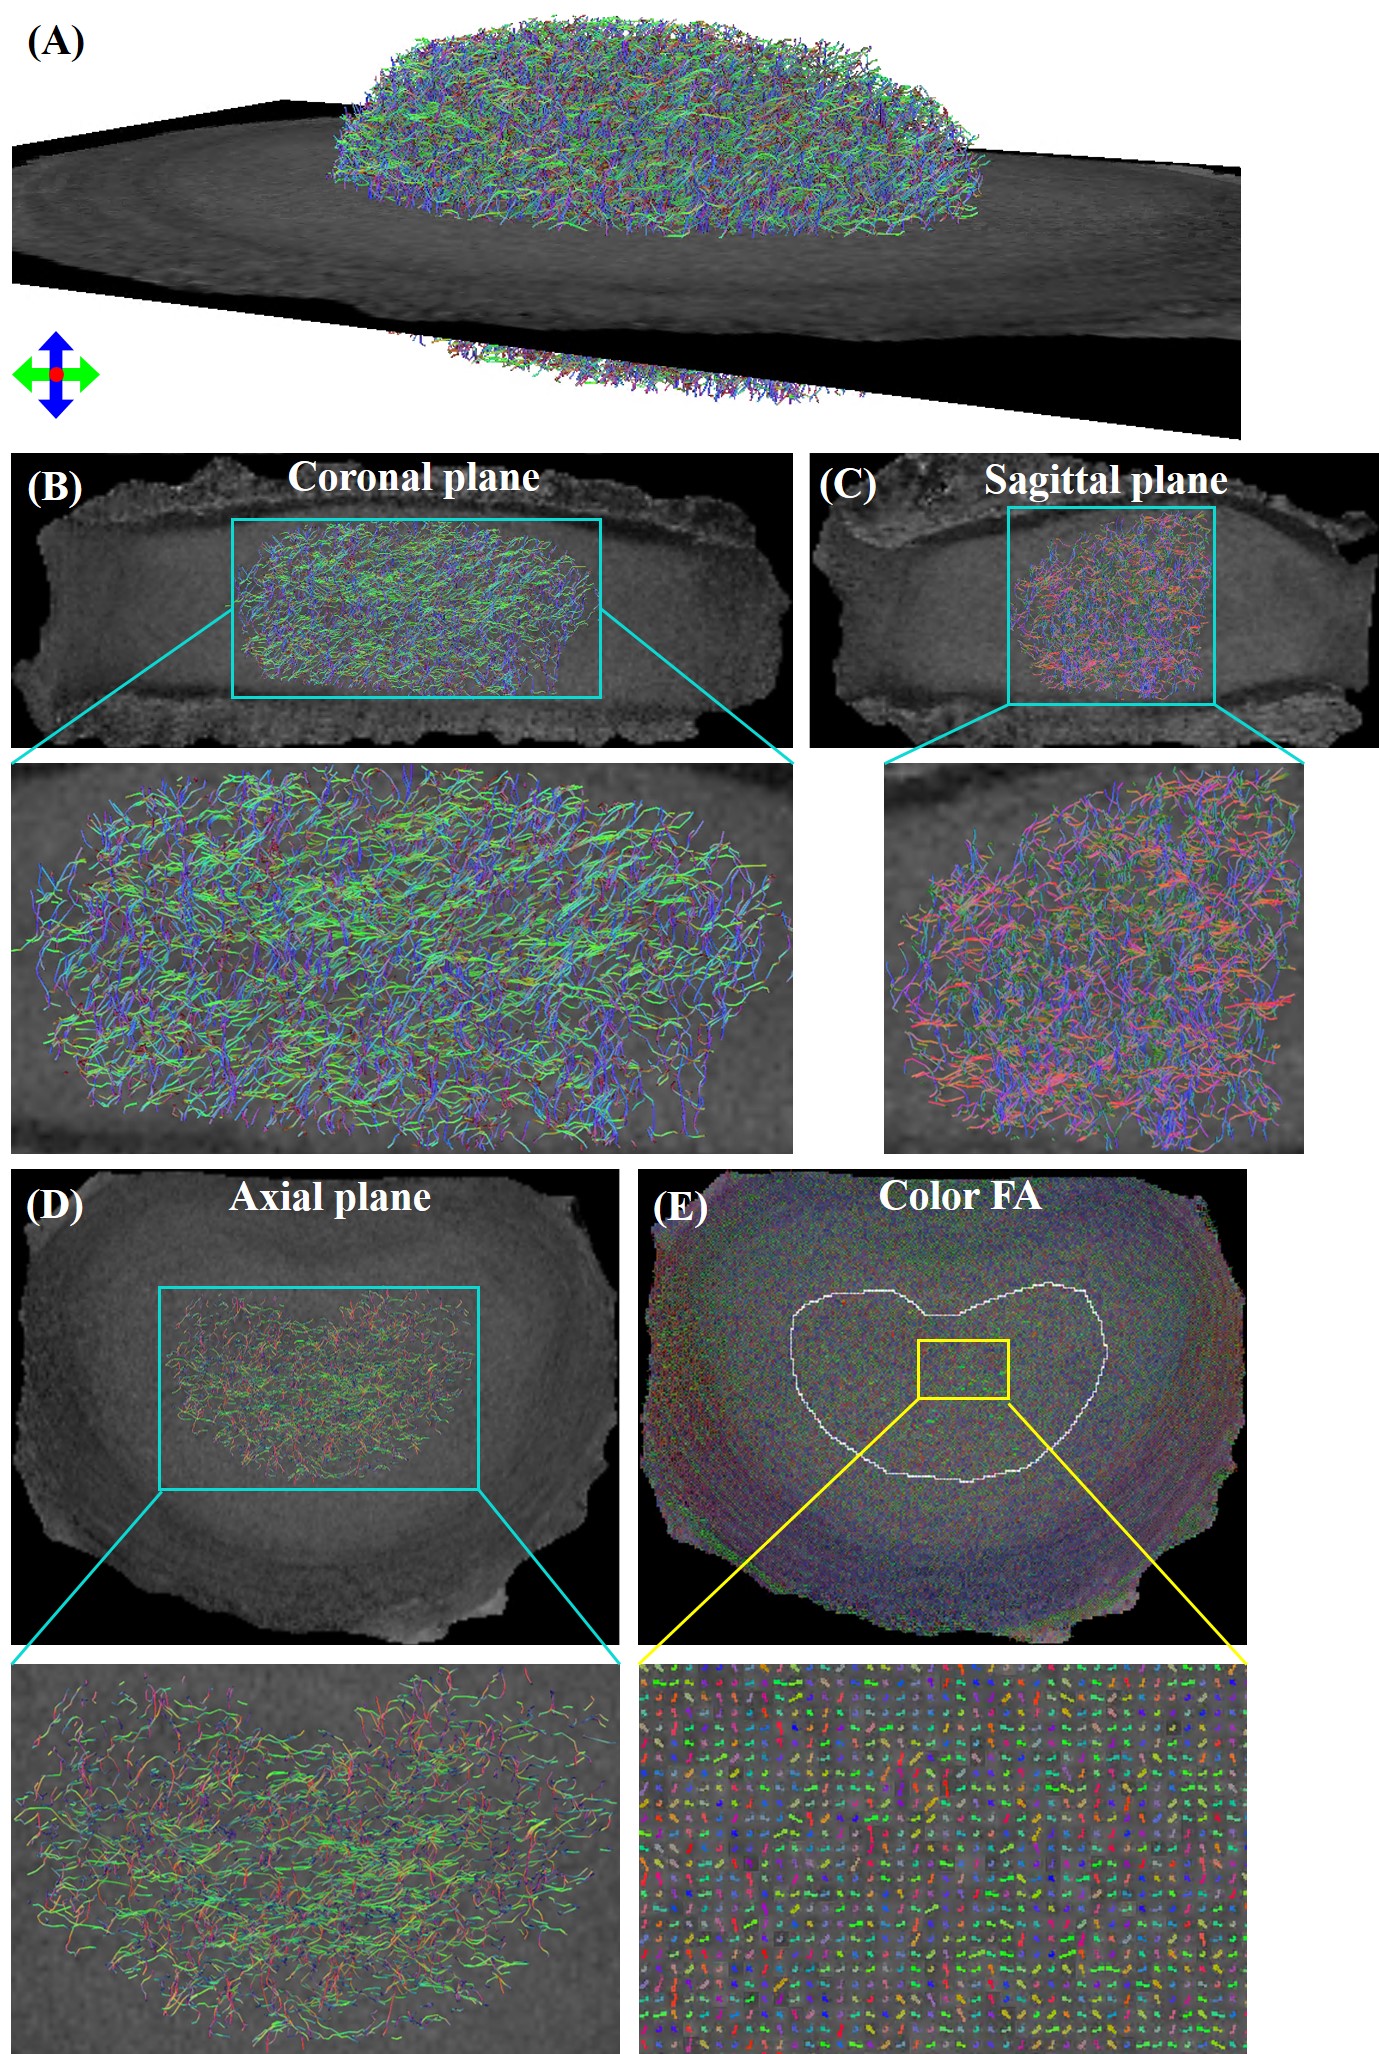
Figure 3 shows a 3D depiction of the inner NP fiber structure alongside cross-sections of the fiber structure in coronal, sagittal, and axial orientations. The fiber structure within the inner NP largely exhibits a tri-directional distribution with perpendicular orientations, which is a finding that is corroborated by the color FA map (Figure 3E).
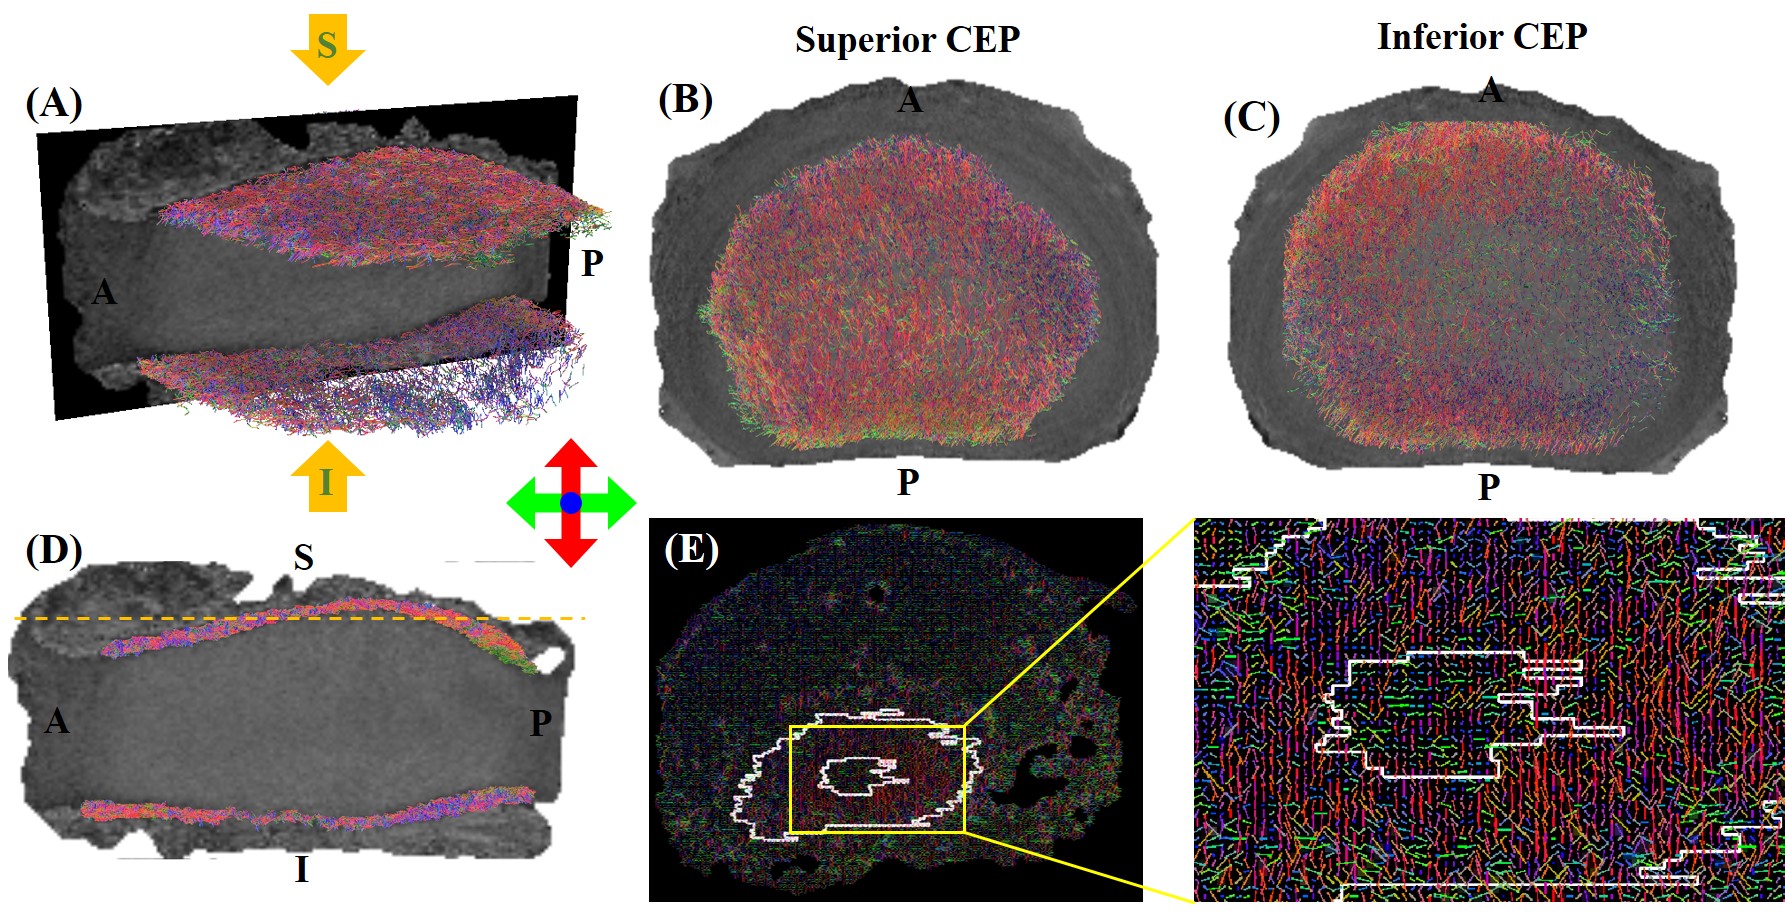
Figure 4 shows the CEP fibers with a 3D view (Figure 4A), a superior perspective of the superior CEP (Figure 4B), and an inferior perspective of the inferior CEP (Figure 4C). The fiber orientation map for the superior CEP, delineated by the orange dotted line on the sagittal cross-section (Figure 4D), is illustrated in Figure 4E. The predominant orientation of CEP fibers is parallel and horizontal in the anterior-posterior direction which is consistent with histological findings (8, 10).
DTT methodology offers a unique window into the detailed fiber structure and orientation of the intact IVD which are otherwise only available with destructive techniques. DTT holds promise for studying IVD degeneration and regeneration using tissue engineering methods.
Conclusion
Utilizing high resolution DTT, the fiber architecture of the entire IVD can be demonstrated at a microscopic level.Acknowledgements
The authors acknowledge grant support from the National Natural Science Foundation of China (522934231007213 and 52293424), and National Institutes of Health (K01AR080257 and R01AR079484), VA Research and Development Services (Merit Awards I01CX001388, I01CX002211, and I01BX005952), DFG (SE 3272/1-1) and GE Healthcare.References
1. Luoma K, Riihimäki H, Luukkonen R, Raininko R, Viikari-Juntura E, Lamminen A. Low back pain in relation to lumbar disc degeneration. Spine (Phila. Pa. 1976). 2000; 25:487–492 doi: 10.1097/00007632-200002150-00016.
2. An HS, Anderson PA, Haughton VM, et al. Disc degeneration: Summary. Spine (Phila. Pa. 1976). 2004; 29:2677–2678 doi: 10.1097/01.brs.0000147573.88916.c6.
3. Adams MA, Roughley PJ. What is intervertebral disc degeneration, and what causes it?. Spine (Phila. Pa. 1976). 2006; 31:2151–2161 doi: 10.1097/01.brs.0000231761.73859.2c.
4. Kandel R, Roberts S, Urban JPG. Tissue engineering and the intervertebral disc: The challenges. Eur Spine J 2008; 17:480–491 doi: 10.1007/s00586-008-0746-2.
5. Wang N, Mirando AJ, Cofer G, Qi Y, Hilton MJ, Johnson GA. Diffusion tractography of the rat knee at microscopic resolution. Magn Reson Med 2019; 81:3775–3786 doi: 10.1002/mrm.27652.
6. Shen J, Zhao Q, Qi Y, Cofer G, Johnson GA, Wang N. Tractography of Porcine Meniscus Microstructure Using High-Resolution Diffusion Magnetic Resonance Imaging. Front Endocrinol (Lausanne). 2022; 13:1–9 doi: 10.3389/fendo.2022.876784.
7. Stein D, Assaf Y, Dar G, et al. 3D virtual reconstruction and quantitative assessment of the human intervertebral disc’s annulus fibrosus: a DTI tractography study. Sci Rep 2021; 11:1–11 doi: 10.1038/s41598-021-86334-8.
8. Inoue H. Three-dimensional architecture of lumbar intervertebral discs. Spine (Phila. Pa. 1976). 1981; 6:139–146 doi: 10.1097/00007632-198103000-00006.
9. Yu J, Peter C, Roberts S, Urban JPG. Elastic fibre organization in the intervertebral discs of the bovine tail. J Anat 2002; 201:465–475 doi: 10.1046/j.1469-7580.2002.00111.x.
10. Roberts S, Menage J, Urban JPG. Biochemical and Structure Properties of the Cartilage End-Plate and its Relation to the Intervertebral Disc. Spine (Phila. Pa. 1976). 1989;14:166–174 doi: 10.1097/00007632-199602010-00003.
Figures