2153
Short association fibre tractography predicts retinotopy in higher visual areas from retinotopy in lower visual areas1Department of Neurophysics, Max Planck Institute for Human Cognitive and Brain Sciences, Leipzig, Germany, 2Felix Bloch Institute for Solid State Physics, Faculty of Physics and Earth Sciences, Leipzig University, Leipzig, Germany, 3Wellcome Centre for Human Neuroimaging, Institute of Neurology, University College London, London, United Kingdom
Synopsis
Keywords: Tractography, White Matter, structure-function relationships, sub-millimetre resolution, topology, U-fibres
Motivation: High spatial resolution diffusion weighted imaging (DWI) tractography may enable mapping of cortical topological structure based on white matter connectivity organisation as an additional method to functional MRI techniques.
Goal(s): We investigated whether retinotopic mapping of primary visual cortex (V1) combined with short association fibres tractography could predict retinotopic organisation in the higher visual areas (V2, V3).
Approach: We used sub-millimetre resolution DWI tractography combined with functional retinotopic mapping in a group of participants in vivo.
Results: Our results demonstrated high accuracy and precision, especially at group level. Prediction was less reliable in the anatomical direction with the most pronounced gyral bias effects.
Impact: Sub-millimetre resolution diffusion weighted imaging tractography enabled mapping of cortical topology by exploiting the topological structure of underlying short association fibre connections, opening the door to applications exploring brain reorganisation in response to injury or pathology from a new perspective.
Introduction
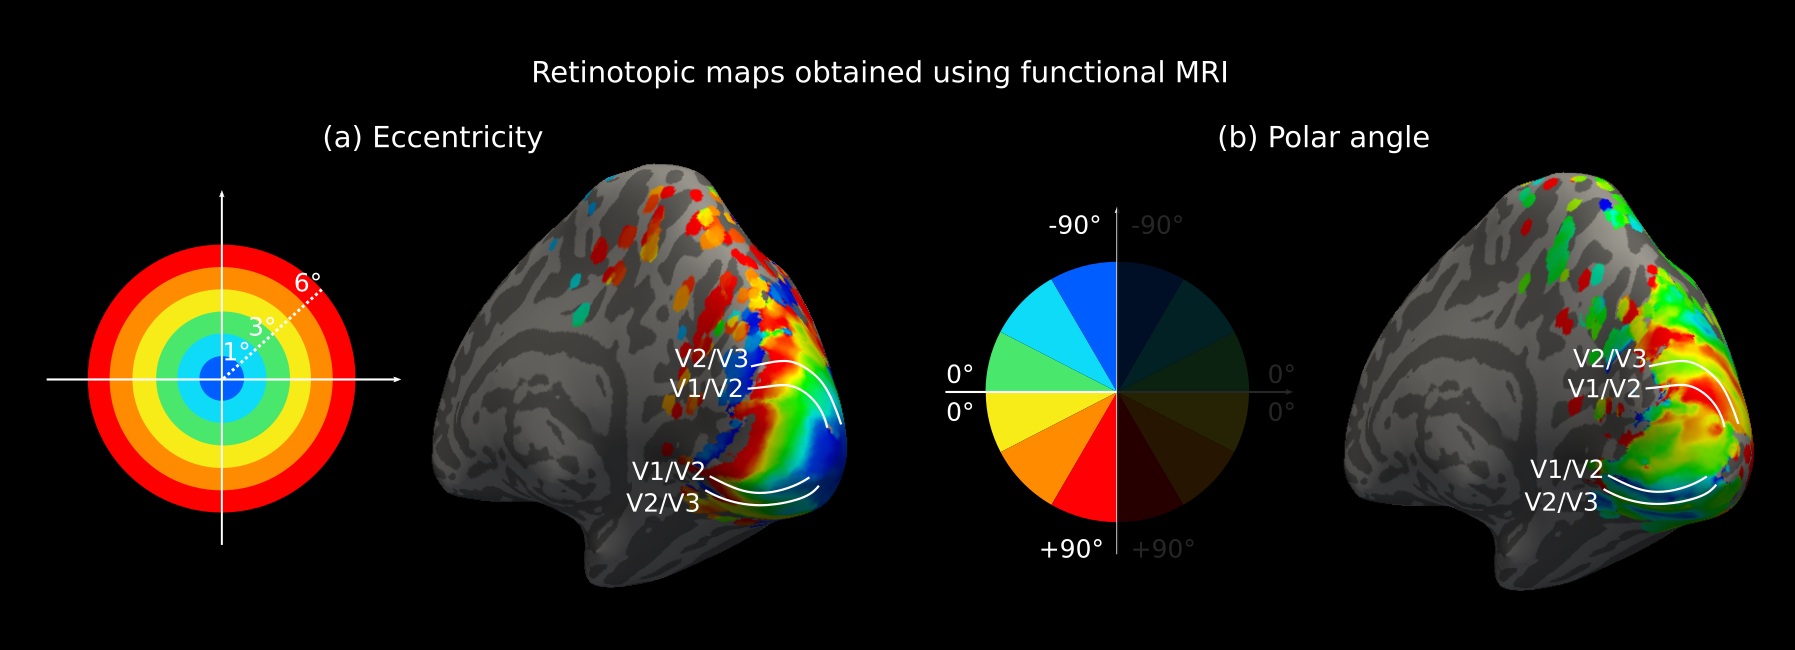
The human early visual processing stream is retinotopically organised1,2 along two corresponding visual field axes, eccentricity and polar angle, which can be mapped reliably using functional MRI (fMRI) retinotopic mapping3,4 (Fig. 1).Short association fibres (SAF) in the white matter connect different levels within the visual processing hierarchy including primary (V1), secondary (V2) and tertiary (V3) cortical areas5,6 and are also retinotopically organised7. High spatial resolution diffusion weighted imaging (DWI) tractography holds great promise for accurate and robust mapping of the SAF7,8.
Because of their expected topologic organisation7, tractography of SAF may allow us to infer the cortical topology of higher visual areas (e.g. V2, V3) from lower areas (e.g. V1) by combining it with fMRI retinotopy in the lower area. This is especially important in brain regions where functional stimulation is difficult due to experimental limitations or topology is not established, in addition to neuropathological investigations.
Methods
MRI of 9 healthy participants (right hemisphere) was used from our published in vivo study of SAF combining DWI probabilistic tractography with fMRI retinotopic mapping7. DWI (3T Connectom, 0.8mm isotropic resolution, b=0,800,1800 s/mm2, 60 encoding directions per diffusion-weighted shell and TE/TR=66ms/8900ms) were corrected for noise, geometric distortions and bias7. FMRI retinotopy was obtained using a checkerboard stimulus and EPI readout. Fibre distribution maps were created9 and probabilistic tractography10 reconstructed the fibre streamlines from cortical seeds in V1, V2 and V3 maps7. The streamlines were transformed to reconstructed cortical surfaces7 where they were precisely mapped onto the grey/white surface using an in-house python script. V1–V2, V2–V3 and V1–V3 SAF were identified based on their cortical terminations in V1, V2 and V3. Eccentricity and polar angle maps were smoothed on cortical surfaces. To assess retinotopic prediction by SAF, V1 retinotopy was mapped onto V2 and V3, and V2 retinotopy onto V3 using the respective streamlines. For group analysis, fMRI retinotopy and tractography-generated predictions were mapped to FreeSurfer fsaverage space11 where vertexwise means of the maps were computed.Results
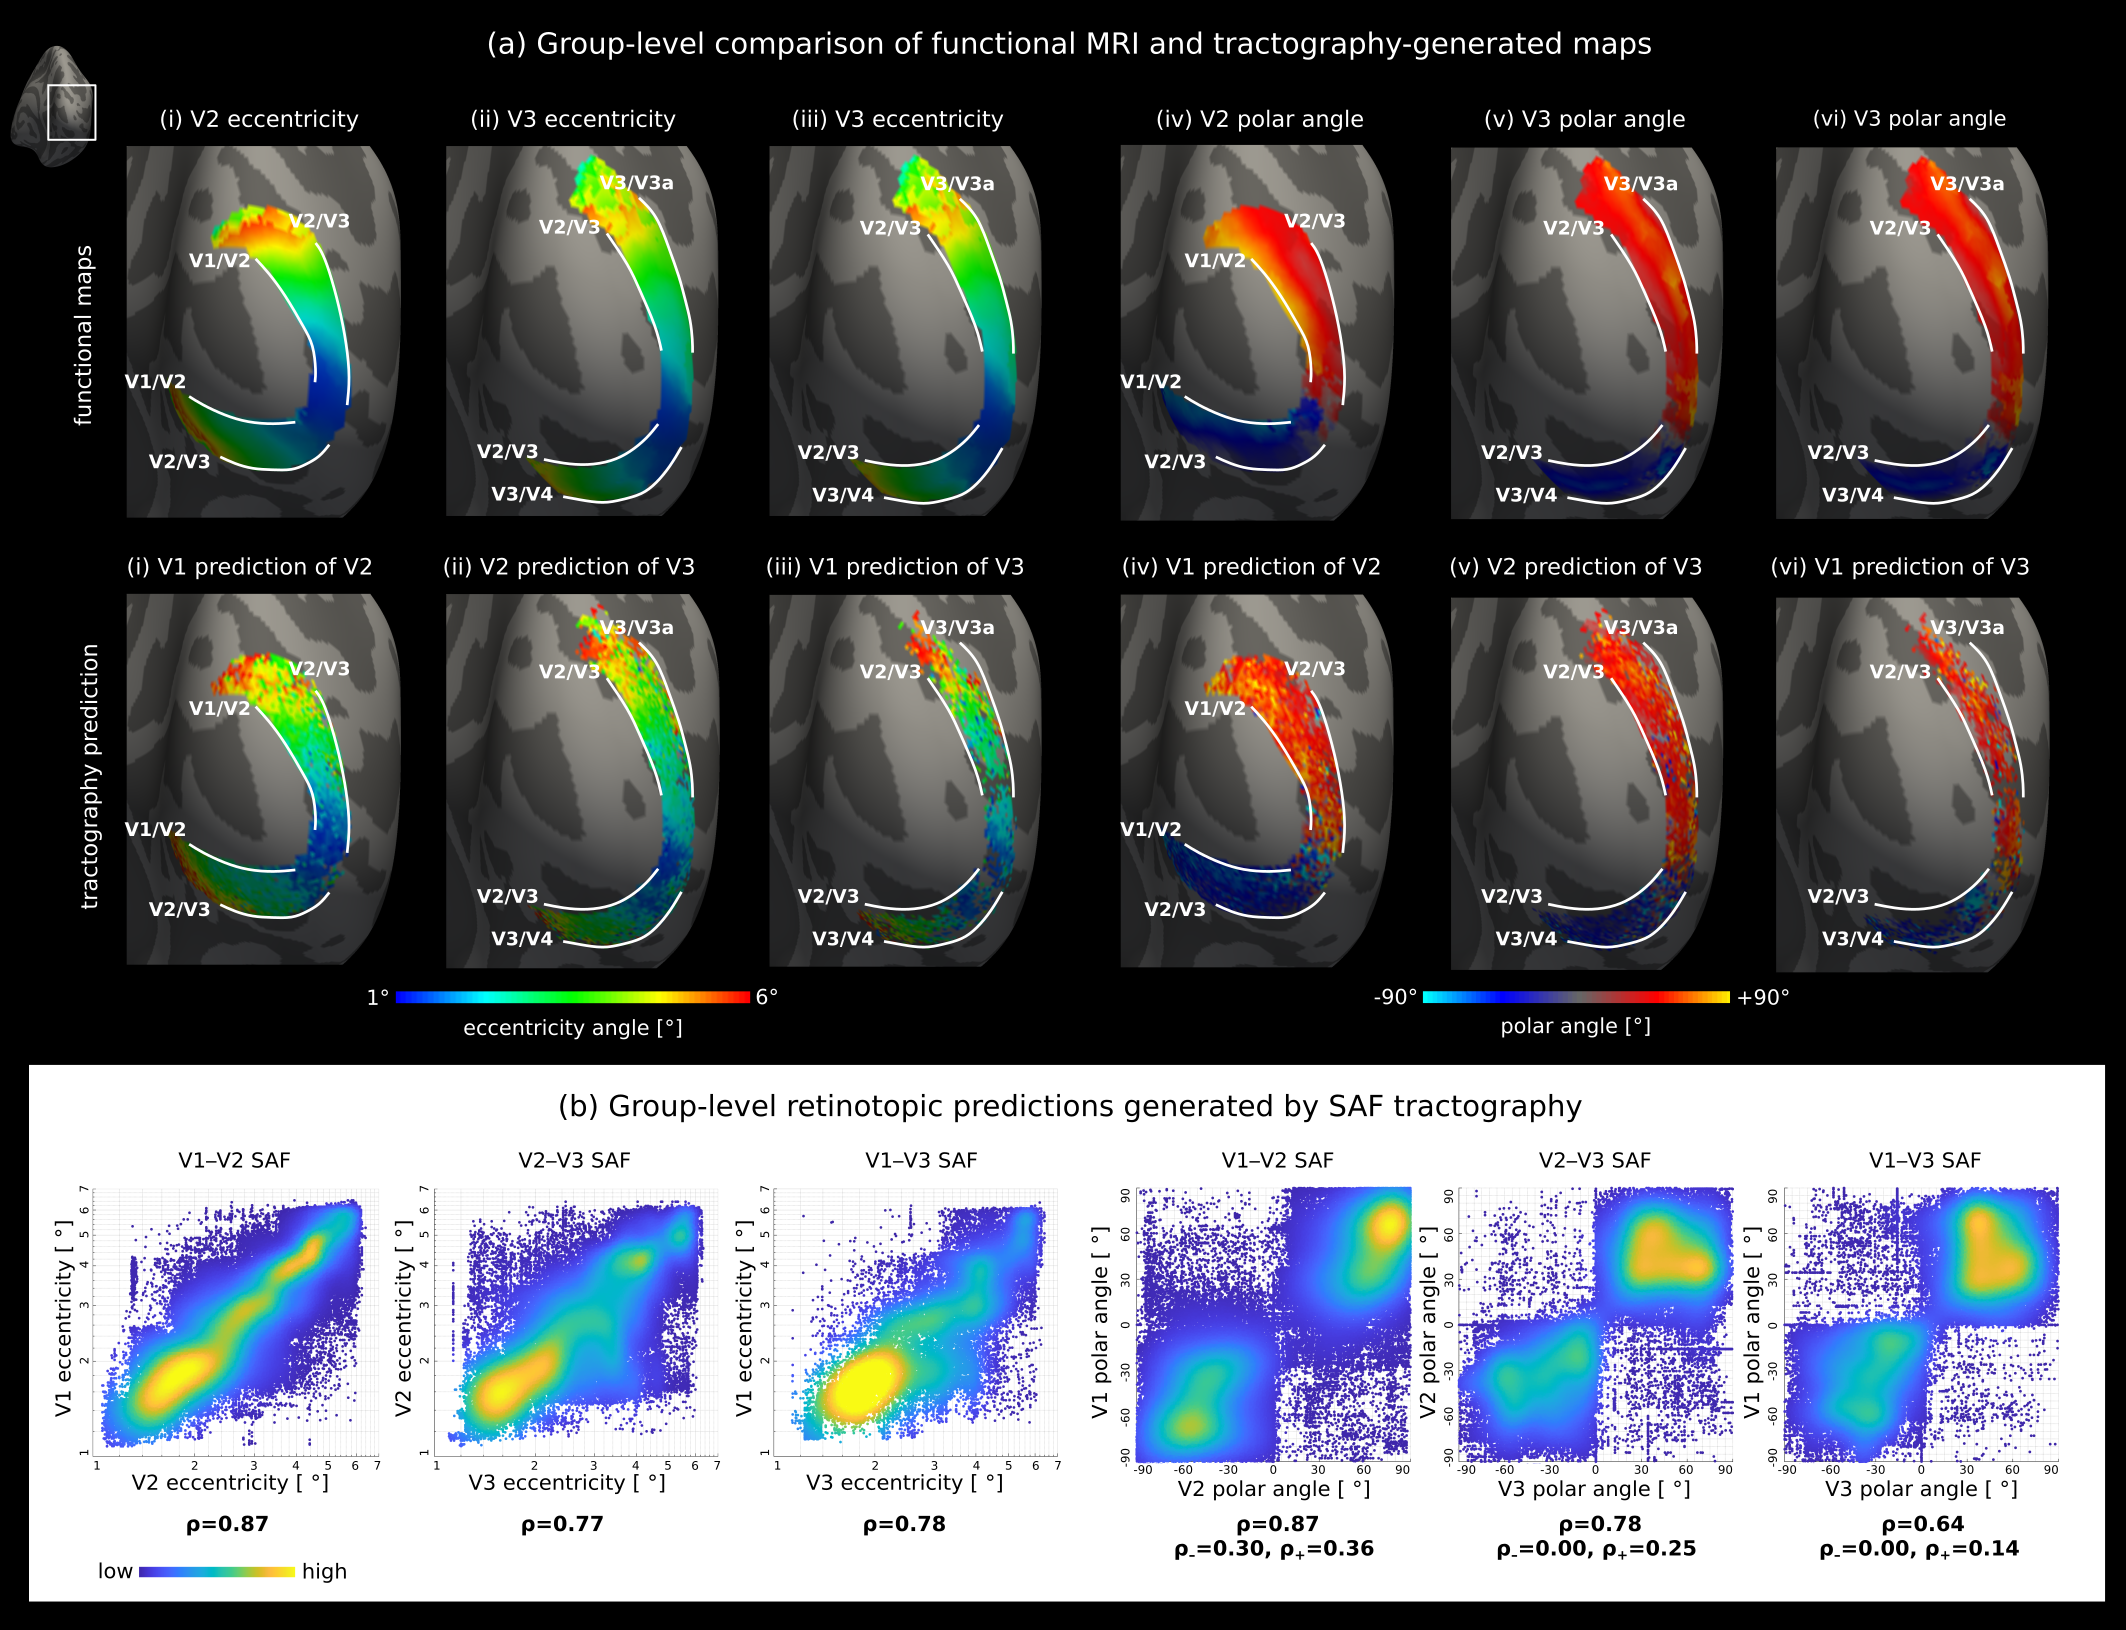
SAF tractography enabled prediction of cortical retinotopic organisation in V2 and V3 based on their connectivity and retinotopy in lower levels (V1 and V2) in vivo at both group (Fig. 2) and single-subject levels (Fig. 3). The tractography-generated predictions closely resembled their corresponding functional maps (Fig. 2) at the group level.The results were most accurate and precise for prediction of V2 retinotopy based on V1–V2 connectivity and V1 retinotopy (Fig. 2i). This is likely explained by the shorter geodesic distance between V1 and V2 compared to V2–V3 and V1–V3, which facilitated tractography12,13. For V1–V3 connectivity, SAF streamlines did not provide full coverage in V3, likely because of these length-dependent biases and errors. Prediction of V3 retinotopy from V2–V3 connectivity and V2 retinotopy was more accurate and precise. A higher quality of predictions was observed in the eccentricity compared to the polar angle direction (Fig. 2b).
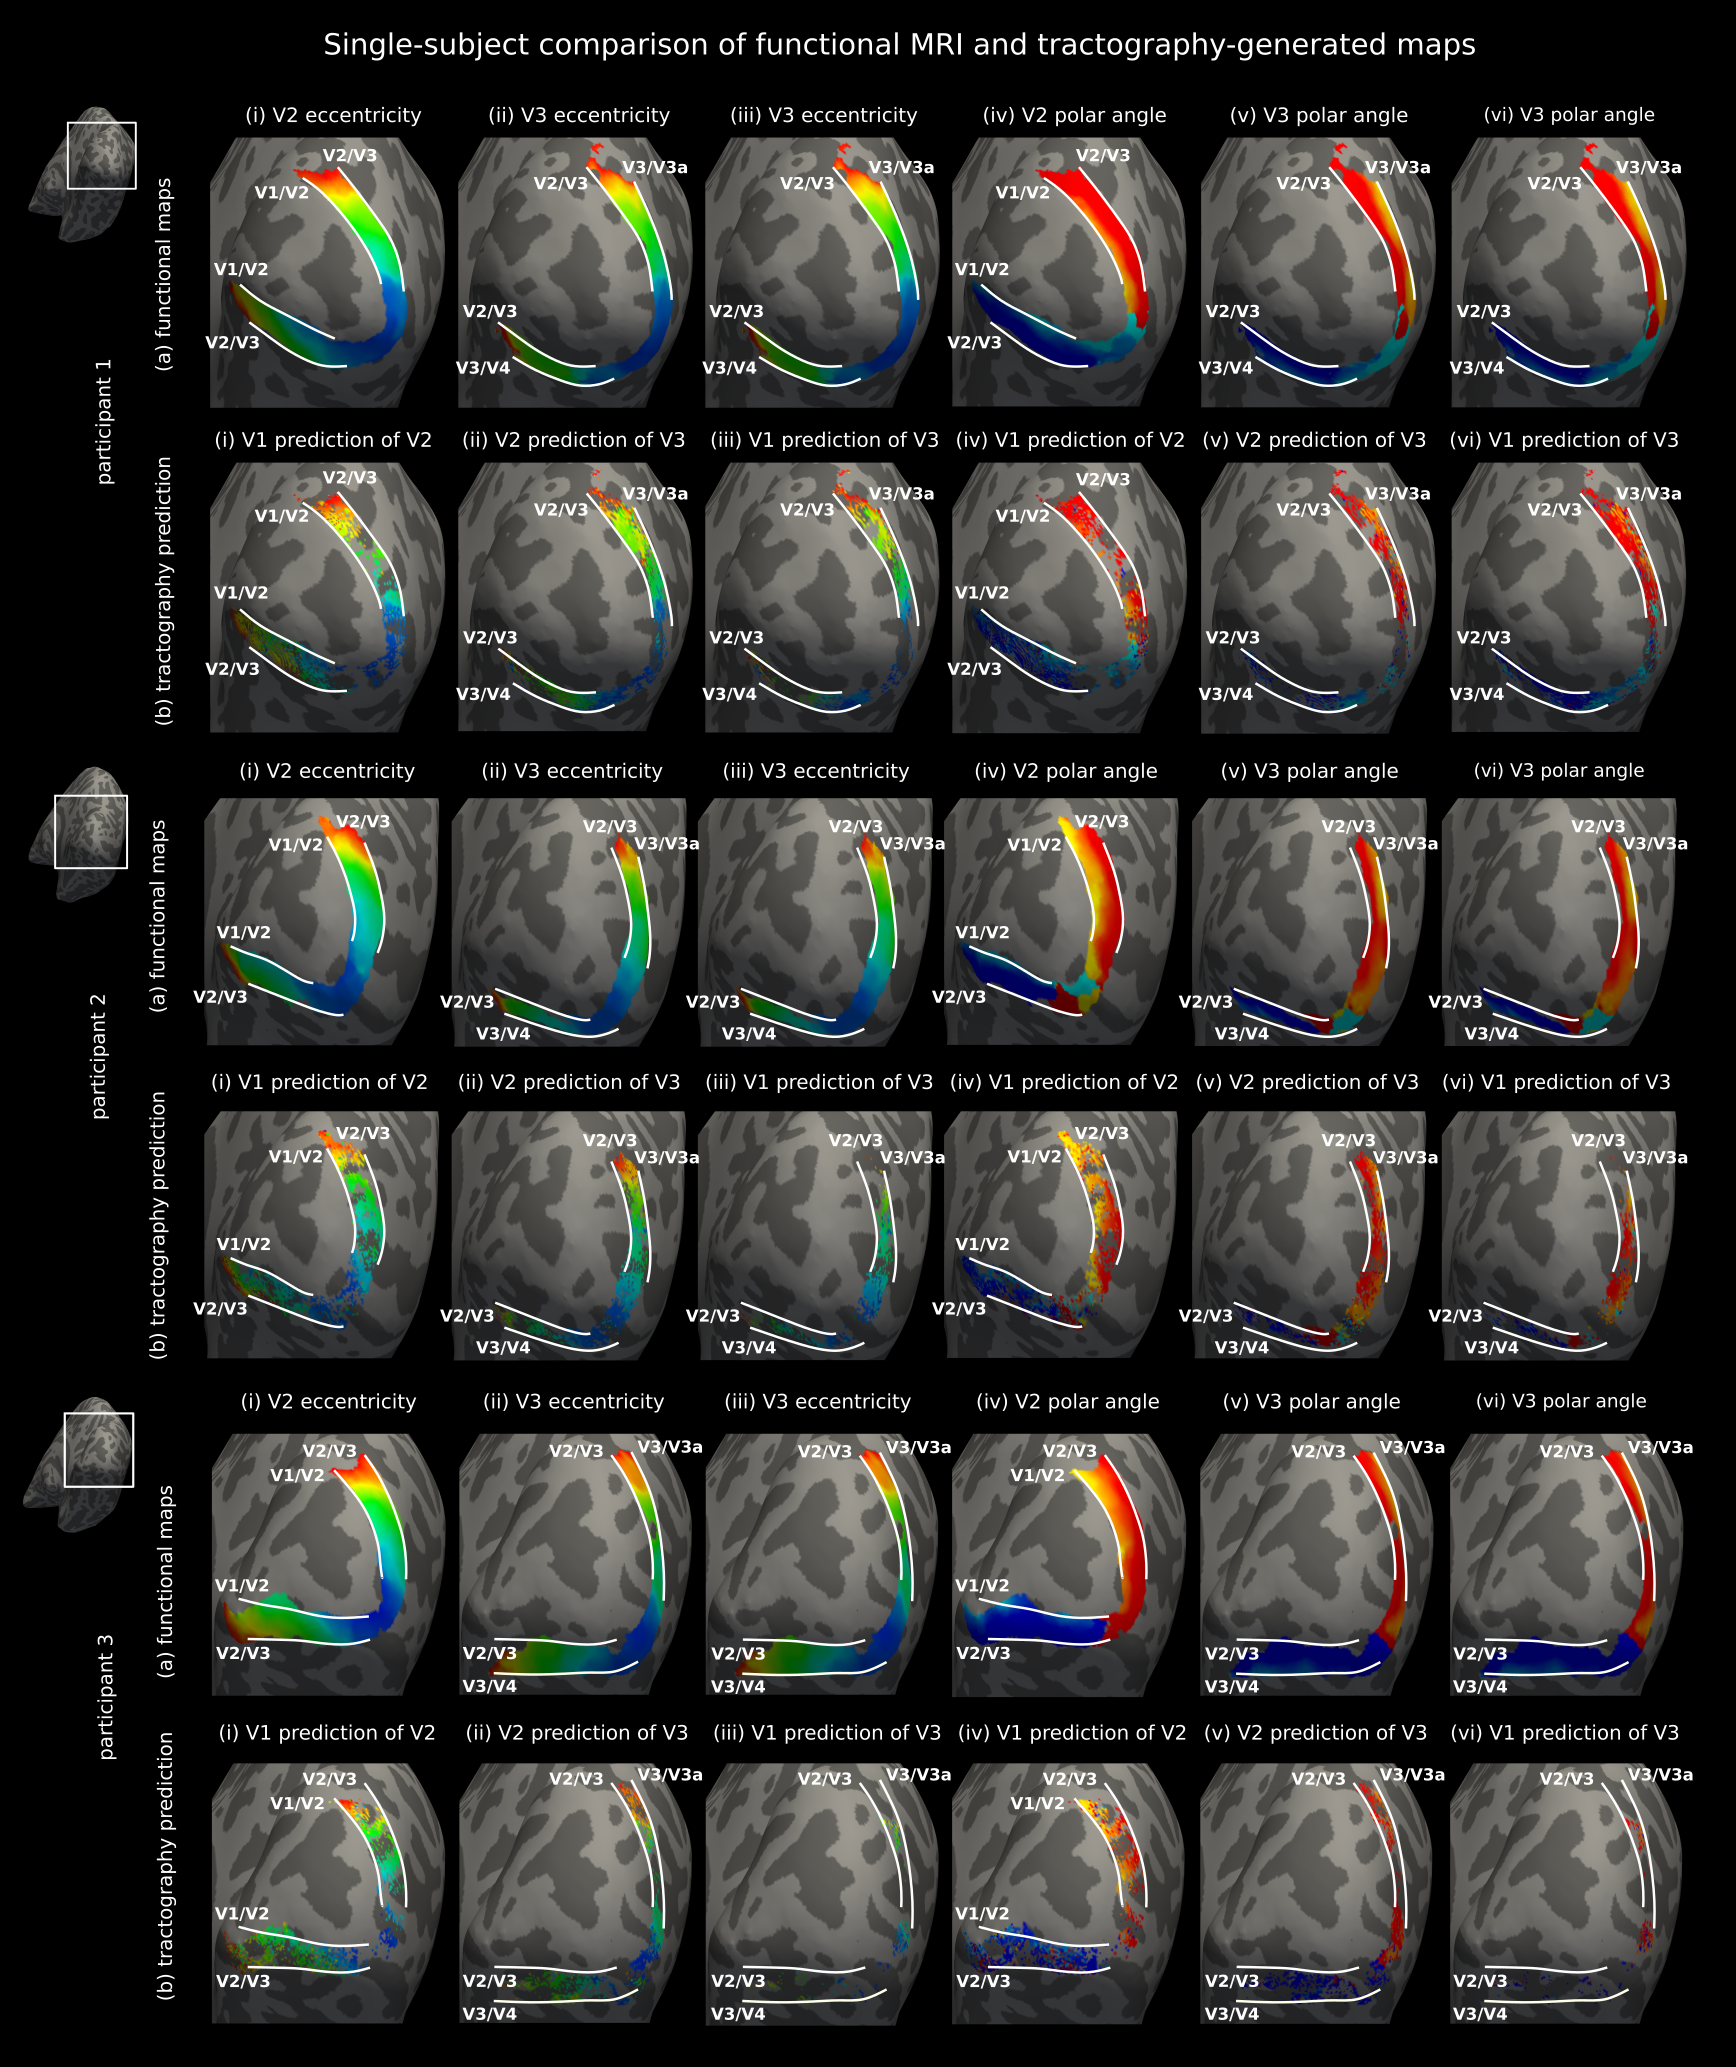
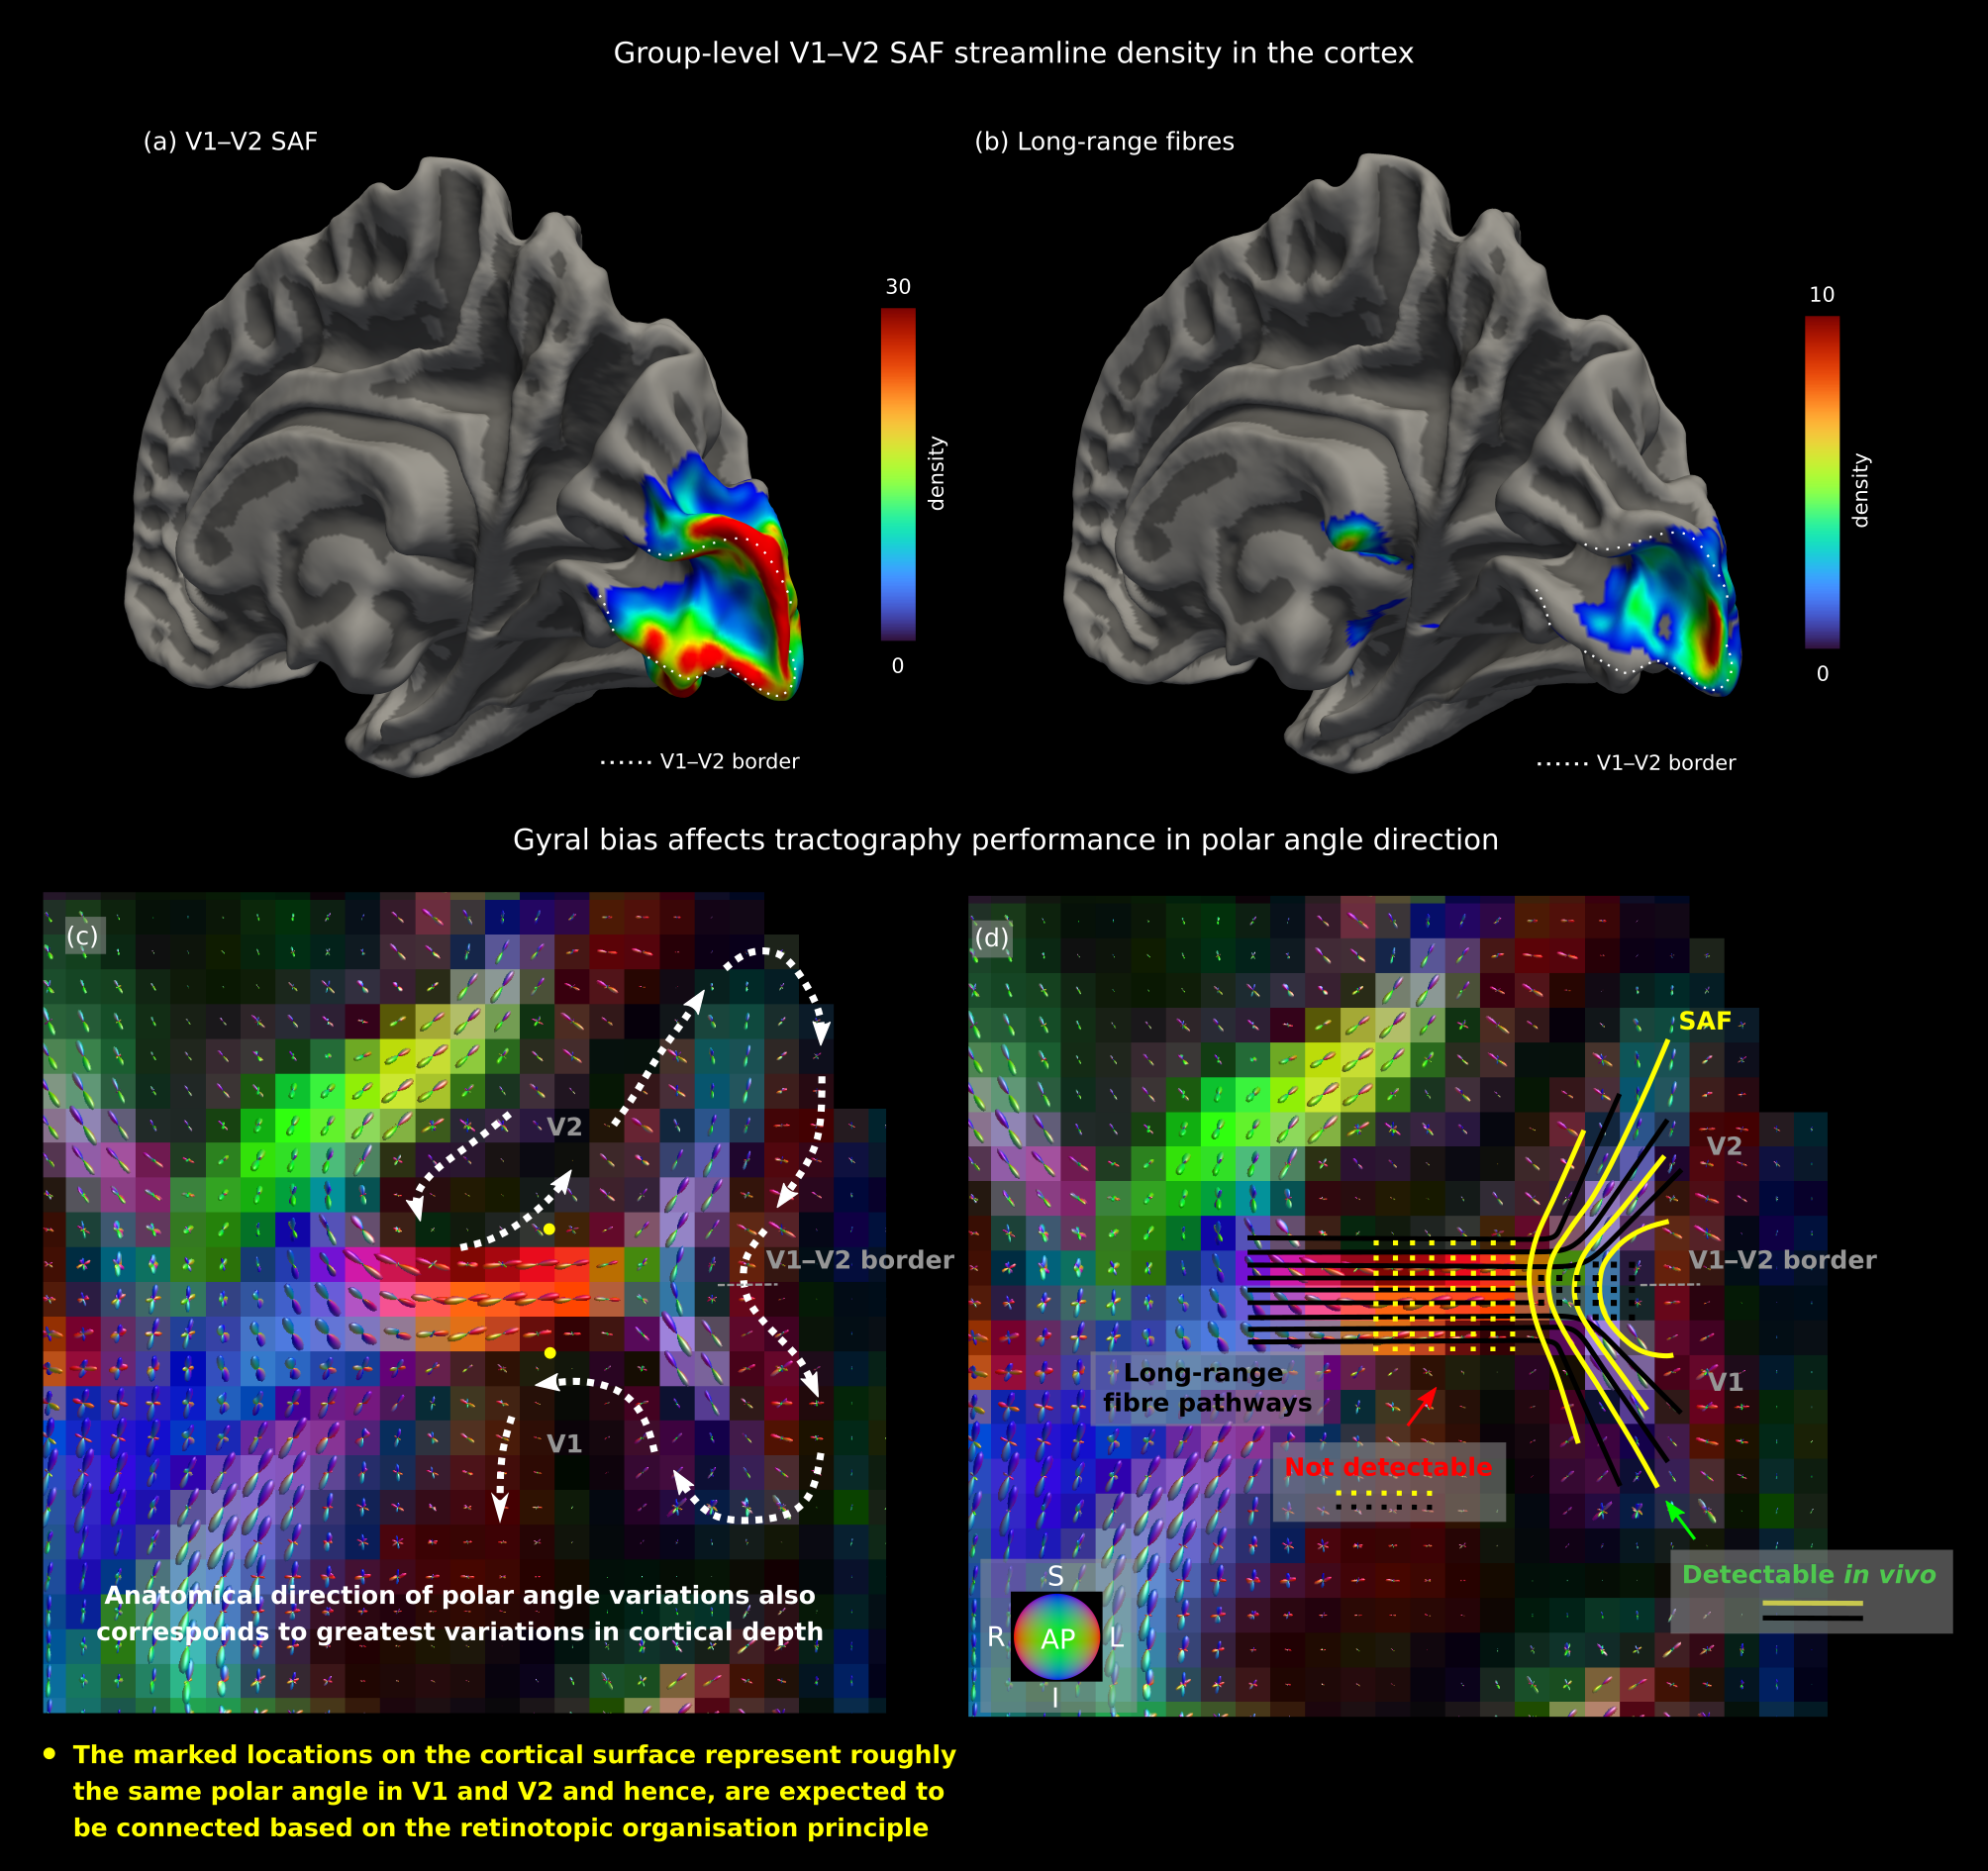
The single-subject maps (Fig. 3) where cortical coverage and prediction accuracy were demonstrated for three representative hemispheres, separately, corroborated the group results but were less robust. In the anatomical direction of the polar angle, in particular, variations in cortical curvature gave rise to more pronounced gyral bias effects14,15, which in turn resulted in less accurate and precise predictions (Fig. 4).
Discussion
SAF probabilistic tractography provides an addition to fMRI-only methods for cortical topology mapping. Our results from the retinotopically organised human V1, V2 and V3 processing stream demonstrated high precision and accuracy of tractography-generated predictions of cortical retinotopy, especially in the eccentricity direction. In the polar angle direction, our results were less reliable. Tractography biases and errors, which can affect both the detectability of SAF as well as their cortical terminations, likely explain this observation. For instance, the more pronounced gyral bias effects in the polar angle direction (Fig.4) may be mitigated using higher resolution DWI and advanced modelling16 to better disentangle the underlying fibre orientation maps. Despite the important limitations of high resolution tractography, our approach was robust for topology mapping in adjacent cortical areas. Thus, it has the potential to substitute fMRI experiments in specific applications such as mapping the topology of higher cortical areas based on their connectivity patterns in a lower area and study cortical and SAF reorganisation in response to pathology and injury.Acknowledgements
The research leading to these results has received funding from the European Research Council under the European Union's Seventh Framework Programme (FP7/2007-2013) / ERC grant agreement n\degree 616905. Funded by the Deutsche Forschungsgemeinschaft (DFG, German Research Foundation) – project no. 347592254 (WE 5046/4-2 and KI 1337/2-2). NW received support from the European Union's Horizon 2020 research and innovation programme under the grant agreement No 681094, and from the Federal Ministry of Education and Research (BMBF) under support code 01ED2210.References
1. Inouye T. Die Sehst ̈orungen bei Schussverletzungen der kortikalen Sehsph ̈are nach Beobachtungenan Verwundeten der letzten Japanische Kriege. 1909.
2. Holmes G. The organization of the visual cortex in man. Royal Society of London Proceedings. Series B. Biological Sciences 1945;132:348–61.
3. Sereno MI, Dale A, Reppas J, et al. Borders of multiple visual areas in humans revealed by functional magnetic resonance imaging. Science 1995;268:889–93.
4. Engel SA, Glover GH, and Wandell BA. Retinotopic organization in human visual cortex and the spatial precision of functional MRI. Cerebral Cortex 1997;7:181–92.
5. Felleman DJ and Van Essen DC. Distributed hierarchical processing in the primate cerebral cortex. Cerebral Cortex 1991;1:1–47.
6. Telencephalon: Neocortex. In: The Human Central Nervous System. Ed. by Nieuwenhuys R, Voogd J, and Van Huijzen C. Berlin, Heidelberg: Springer Berlin Heidelberg, 2008:491–679.
7. Movahedian Attar F, Kirilina E, Haenelt D, et al. Mapping short association fibers in the early cortical visual processing stream using in vivo diffusion tractography. Cerebral Cortex 2020;30:4496–515.
8. Song AW, Chang HC, Petty C, et al. Improved Delineation of Short Cortical Association Fibers and Gray/White Matter Boundary Using Whole-Brain Three-Dimensional Diffusion Tensor Imaging at Submillimeter Spatial Resolution. Brain Connectivity 2014;4:636–40.
9. Dhollander T, Raffelt D, and Connelly A. Unsupervised 3-tissue response function estimation from single-shell or multi-shell diffusion MR data without a co-registered T1 image. In: Proc Intl Soc Mag Reson Med (ISMRM) workshop on breaking the barriers of diffusion MRI 2016:5.
10. Tournier JD, Calamante F, and Connelly A. Improved probabilistic streamlines tractography by2nd order integration over FODs. Proc Intl Soc Mag Reson Med (ISMRM) 2010;18:1670.
11. Fischl B. FreeSurfer. NeuroImage 2012;62:774–81.
12. Ercsey-Ravasz M, Markov NT, Lamy C, et al. A Predictive Network Model of Cerebral Cortical Connectivity Based on a Distance Rule. Neuron 2013;80:184–97.
13. Donahue C, Sotiropoulos S, Jbabdi S, et al. Using diffusion tractography to predict cortical connection strength and distance: a quantitative comparison with tracer in the monkey. The Journal of Neuroscience 2016;36:6758–70.
14. Van Essen DC, Jbabdi S, Sotiropoulos SN, et al. Mapping Connections in Humans and Non-Human Primates: Aspirations and Challenges for Diffusion Imaging. Second Edi. Elsevier, 2014:337–58.doi: 10.1016/B978-0-12-396460-1.00016-0.
15. Schilling K, Gao Y, Janve V, et al. Confirmation of a gyral bias in diffusion MRI fiber tractography. Human Brain Mapping 2018;39:1449–14662.
16. De Luca A, Leemans A, Tax CM, et al. Resolving heterogeneous crossing fibers with Adaptive modelling and Generalized Richardson Lucy spherical deconvolution (AGRL). In: Proc Intl Soc Mag Reson Med (ISMRM) 2022;31:0876.
Figures