2152
The assessment of the within-participant reliability of fractional anisotropy measurements of different spinal cord regions.1The University of Exeter, Exeter, United Kingdom, 2Diagnostic Radiology Department, Najran University, Saudi Arabia, Najran City, Saudi Arabia
Synopsis
Keywords: Simulation/Validation, Data Analysis, Reliability
Motivation: DTI-MRI reliability studies are performed to validate findings, improve clinical applications, assure scientific precision, and advance methodology.
Goal(s): The aim was to assess the within-participant reliability of diffusion tensor imaging (DTI) measurements, specifically fractional anisotropy (FA) determinations, within different regions of the (CSC).
Approach: In total, 20 healthy controls were recruited over two months. Each participant was scanned twice. The within-participants coefficients of variation (CV%) was used to evaluate the reliability of FA metric between (C2-C5) for the WM, and WM sub-regions.
Results: In general, the CV%s were low for the WM, DC, VC and LC regions demonstrating higher reproducibility
Impact: Results from this study indicated high within-participants reliability and demonstrated that FA may be highly effective in assessing CSC changes. Previous studies have used semi-automated or manual segmentation methods, while this study used automatic-segmentation by SCT, which provides tract-based analysis.
Introduction
Diffusion tensor imaging (DTI) has the potential to be used as a diagnostic tool for the assessment of pathologies that affect the cervical spinal cord (CSC). The fractional anisotropy (FA) metric can be affected by a variety of factors, including variations in water content and the presence of crossing fibres. Its values vary from 0 (isotropic) to 1 (anisotropic) for the mobility of water [1]. This study aimed to evaluate the within-participant reliability of FA within the total white matter (WM), the dorsal column (DC), the ventral column (VC) and the lateral column (LC).Methods
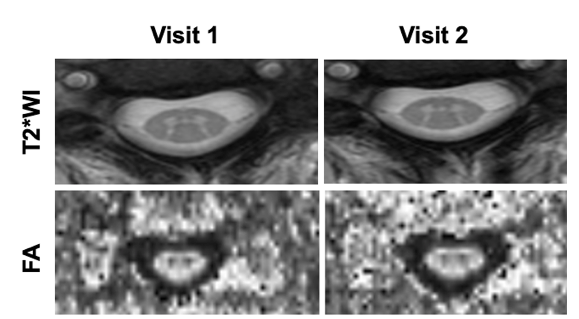
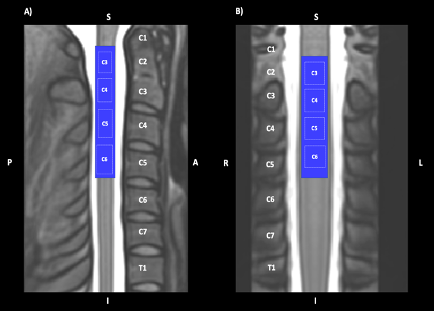
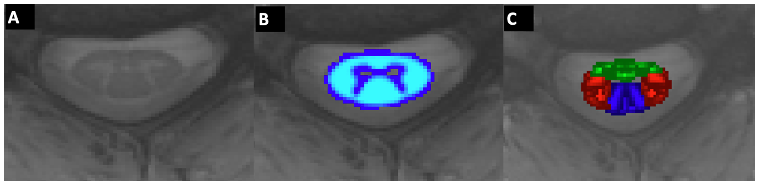
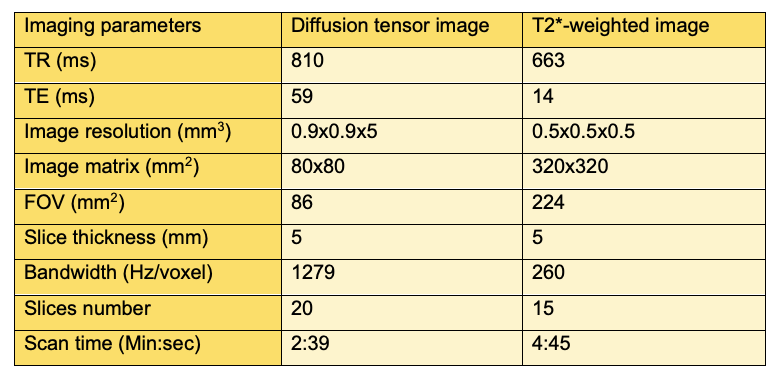
In total, 20 healthy controls (10 male, mean age: 33.9±3.5 years, 10 female, mean age: 47.5 ± 14.4 years, with no family history of neurological disorders or a contraindication to MRI scanning, were recruited over a period of two months. Each participant was scanned using a 3T scanner (Siemens, Prisma) on two different visits. Figure 1 demonstrates T2* weighted images (T2*WI), and fractional anisotropy (FA) of one healthy participant at the C3 vertebral-body level for both the first and second scans. In the first row, T2*WI demonstrate excellent contrast where WM appears more hypointense than GM and the surrounding CSF is the most hyperintense. In the second row, FA maps show that WM is hyperintense, indicating a high degree of anisotropy, while GM is hypointense. The FOV was centred at the level of the C3/C4 intervertebral disc, spanning four vertebral segments from the upper border of C2 to the lower border of C5 as shown in Figure 2 (A and B). Diffusion-weighted images with thirty-five non-collinear directions were acquired with b= 800 s·mm -2. More details of the imaging acquisition parameters of DTI are listed in Table 1. The T2*-weighted image was also included to provide an anatomical reference (image acquisitions are detailed in Table 1) to allow the template-specific analysis of DTI data. Data were corrected for motion artefacts, then segmented and registered to a template. FA was then computed using SCT. As a simple assessment of the reliability, the coefficient of variation CV% was used to examine the variability of FA metric between (C2-C5) for the total WM, DC, VC and LC. The selected ROI’s (WM, VC, LC, and DC) are shown in Figure 3.Results
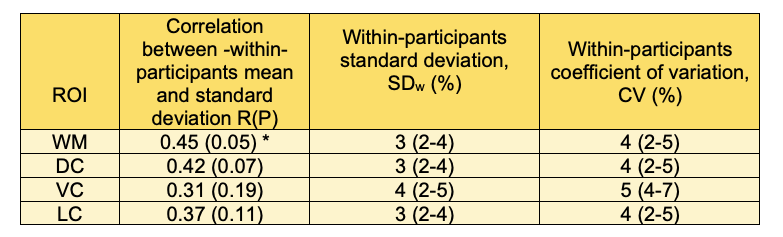
The within-participants variations (CV%) are shown in table 2. In general, the CV%s were low for the WM, DC, VC and LC regions demonstrating higher reproducibility values. The FA metric showed little variation in all the WM, DC, VC and LC regions with values of 4% (2-5%), 4% (2-5%) ,5% (4-7%) and 4% (2-5%) in the WM, DC, VC, and LC, respectively, with the VC region showed the highest variation. Table 2 also shows the within-participants correlation between subject mean and standard deviation (SD). There was a significant correlation between the within-participants mean and standard deviation for FA in WM region indicating that the error in this measure was proportional instead of constant.Discussion
In terms of within-participants variation, the CV% is a useful statistical analysis that may also be used to determine the smallest quantifiable change. Previously Peterson, et al. [2] reported CVs of 3.8%, 7.7%, 10.5%, and 6.2% in FA for WM, DC, VC and LC, respectively. In contrast the current study found lower CV values of 4%, 4%, 5%, and 4% in FA for WM, DC, VC and LC, respectively. The possible reasons for lower variation in the current study compared to the Peterson, et al. [2] may be that the latter was undertaken with patients with acute spine trauma. Patients with acute spine injuries may have FA values which vary in time due to changes in tissue integrity, for example, inflammation, which can impact water molecule diffusion. Moreover, applying automated software for DTI image segmentation such as SCT helps ensure precise and consistent results, making it an ideal choice for demonstrating reliability in research studies.Acknowledgements
No acknowledgement found.References
1. Wilm, B.J., et al., Reduced field‐of‐view MRI using outer volume suppression for spinal cord diffusion imaging. Magnetic Resonance in Medicine: An Official Journal of the International Society for Magnetic Resonance in Medicine, 2007. 57(3): p. 625-630.
2. Peterson, D., et al., Test-Retest and Interreader reproducibility of semiautomated atlas-based analysis of diffusion tensor imaging data in acute cervical spine trauma in adult patients. American Journal of Neuroradiology, 2017. 38(10): p. 2015-2020.
Figures