2149
Optimizing data sampling pattern and analysis algorithm in T2-based water suppression diffusion MRI (T2wsup-dMRI)1Radiological engineering, Shizuoka College of Medical care Science, Hamamatsu, Japan
Synopsis
Keywords: Diffusion Analysis & Visualization, Multi-Contrast
Motivation: It is very important to suppress CSF partial-volume effects in tissue-specific quantitative parameters of T2, T1, PD, ADC, and FA etc. in brain MRI.
Goal(s): To assess and confirm the optimal method to improve the accuracy and precision of quantitative parameters in our proposed method of T2wsup-dMRI.
Approach: Evaluated the tissue SNRs of quantitative parameters for in-vivo brain MRI data with the several combinations of data sampling pattern in (TE, b) space and analysis algorithm.
Results: The combination of Triangle-pattern and 2d-single and bi-exponential combined LSQ fitting (2dSi&BiExpLSQ) was the best from the views of SNR, hardware, and computing costs.
Impact: The combination of Triangle sampling pattern and 2dSi&BiExpLSQ fitting algorithm in T2wsup-dMRI provides high quality maps with minimum hardware and computing costs for obtaining multi-quantitative parameter mapping especially in clinical brain diffusion MRI.
Introduction
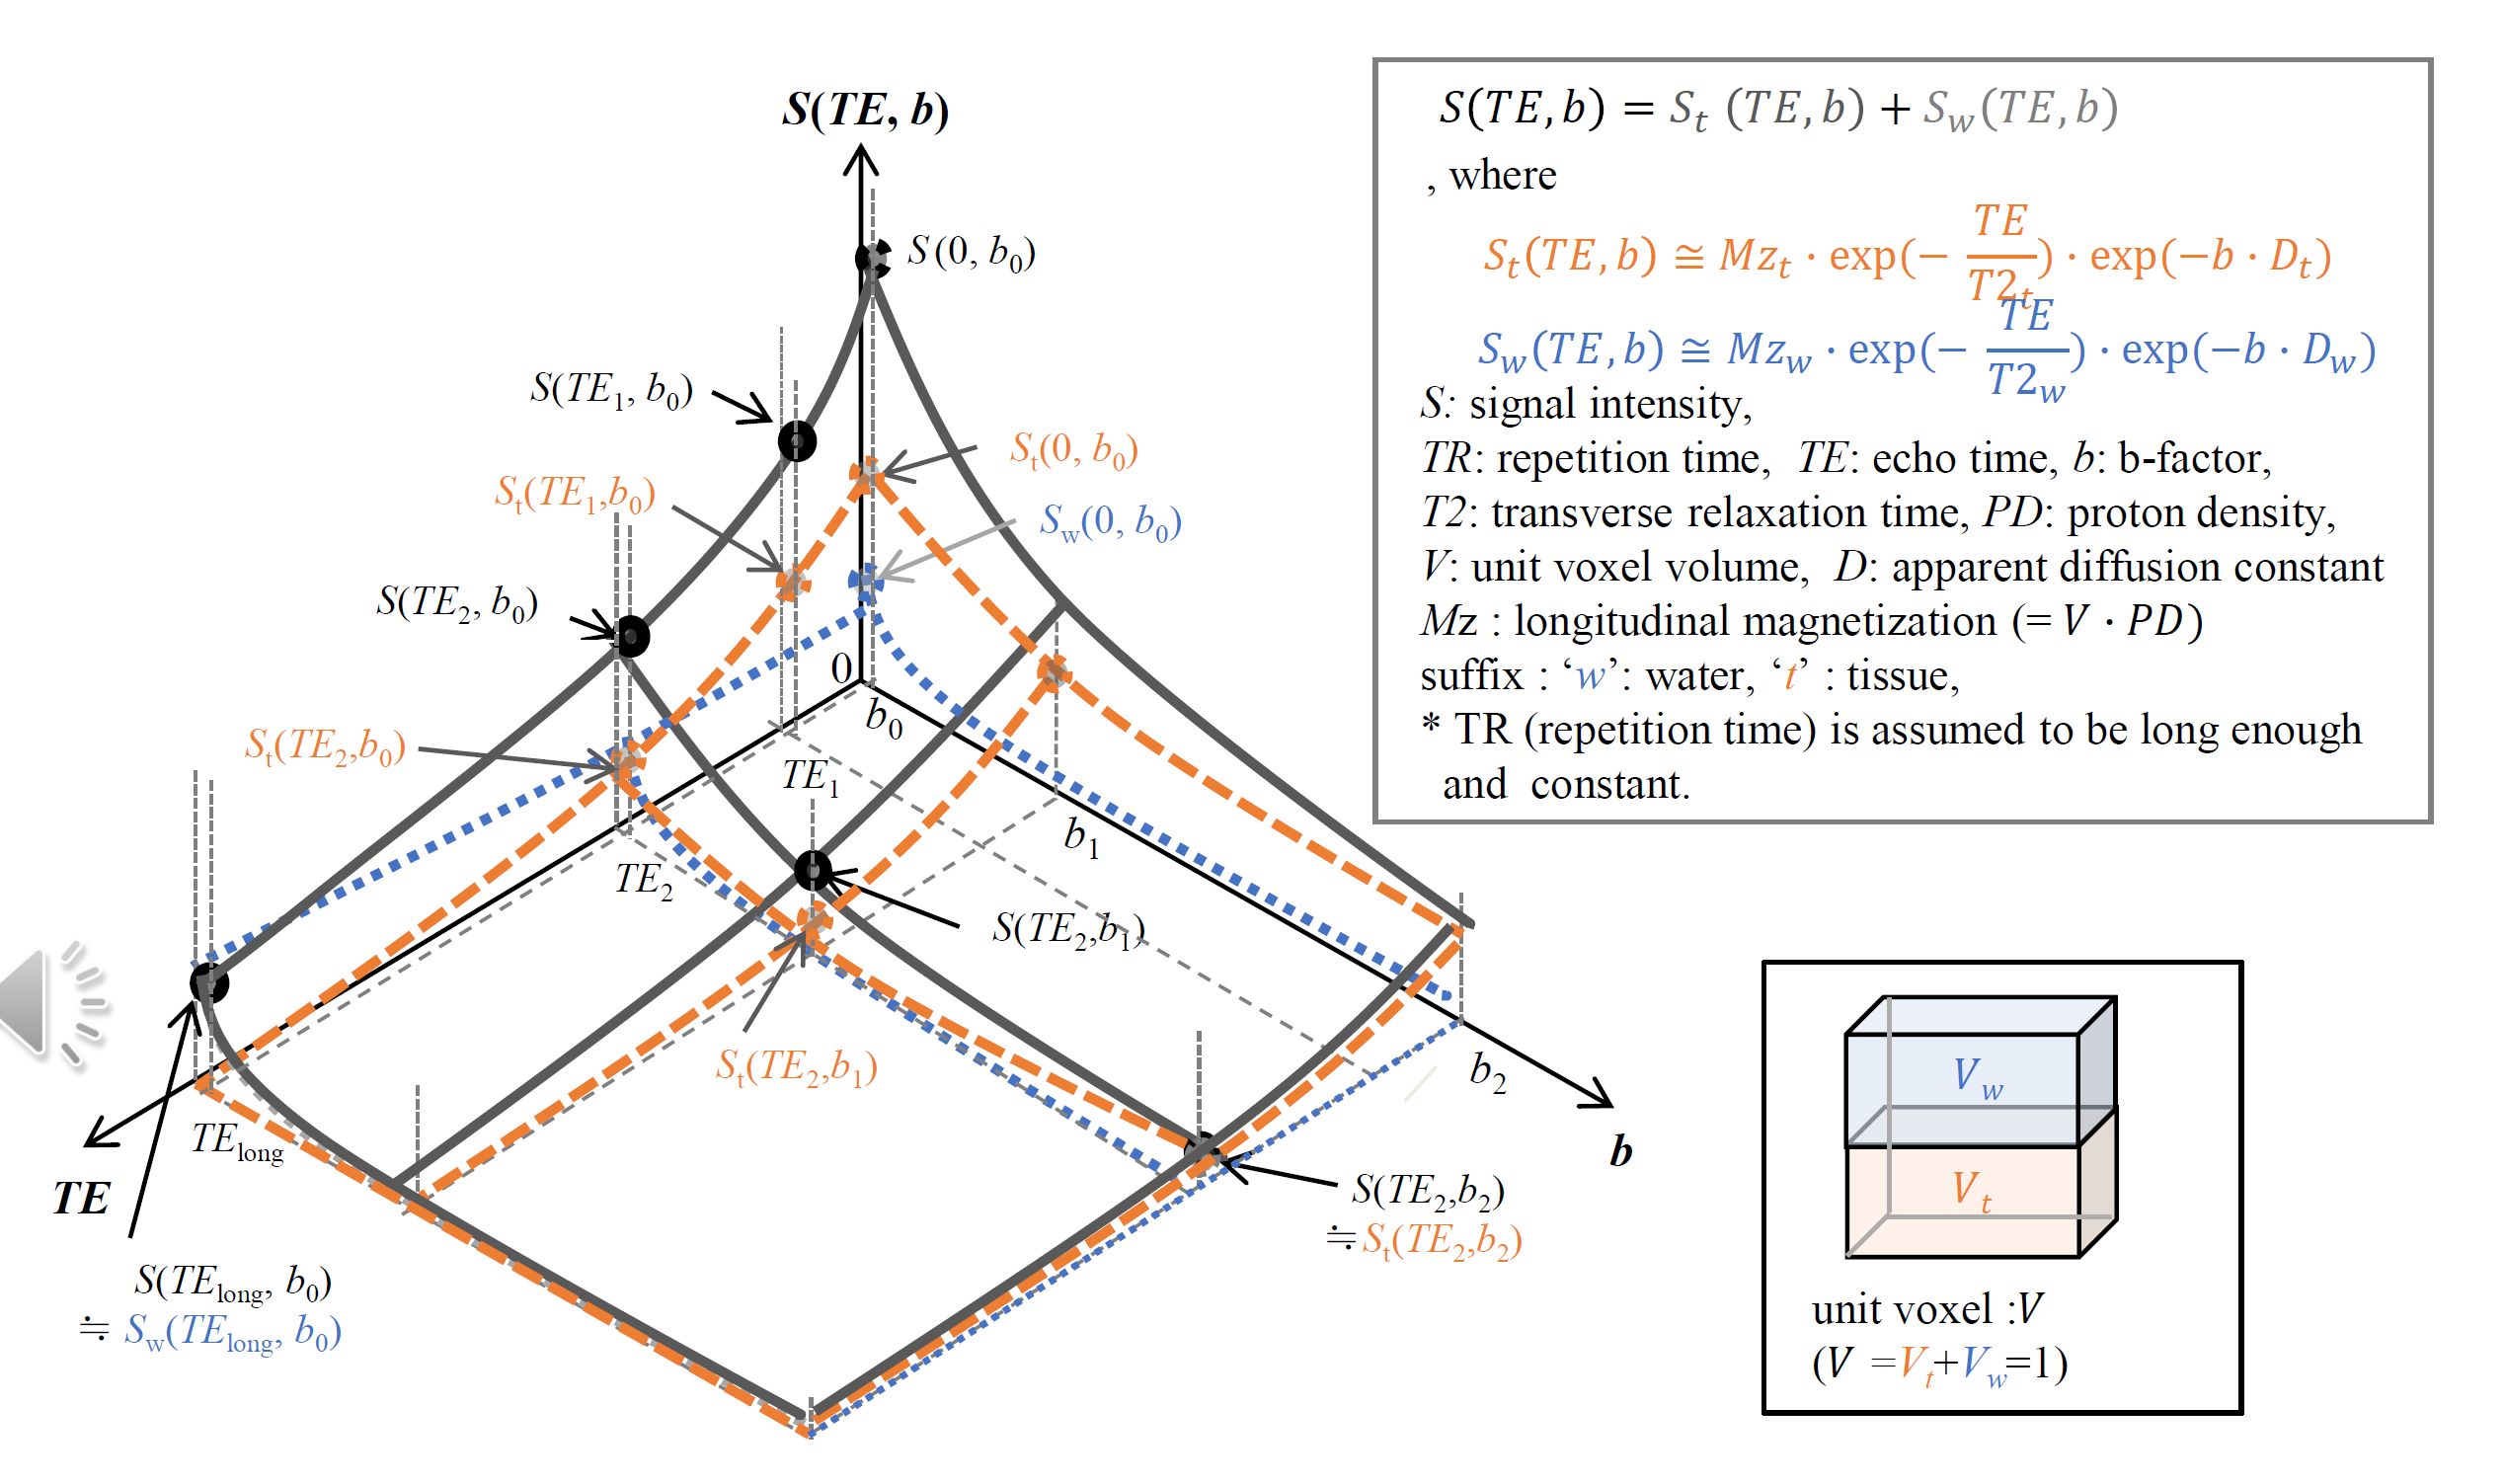
CSF-partial volume effects (CSF-PVE) dependent artifacts are problematic in quantification of brain tissue-specific parameters of T2, PD, and T1 in standard contrast MRI and also of ADC and FA in diffusion MRI 1. Furthermore, synthetic contrast-weighted images calculated by those quantitative parameters2 introduce higher intensity artifacts in FLAIR and DIR3-4. Our proposed techniques named T2-based water (CSF) suppressed MRI (T2wsup-MRI)5 and diffusion MRI (T2wsup-dMRI)6 can solve those problems by providing water-suppressed quantitative parameter maps. As shown in Fig. 1, the T2wsup-dMRI technique based on a two-compartment signal model requires minimally different 4 points (5 points including T17) then all images can be easily calculated with a simple closed-form (CF) algorithm while keeping the tissue SNR. In addition, when using an arbitrary data sampling pattern on 2d (TE, b) space and the number of sampling points, 2d single- and/or bi-exponential least-square (LSQ) curve fitting algorithms could provide promising results both in the relative error and CV by numerical simulation8. The purpose of this study was to confirm the optimal combination of the sampling pattern and the analysis algorithm by applying it to in-vivo MRI images.Methods
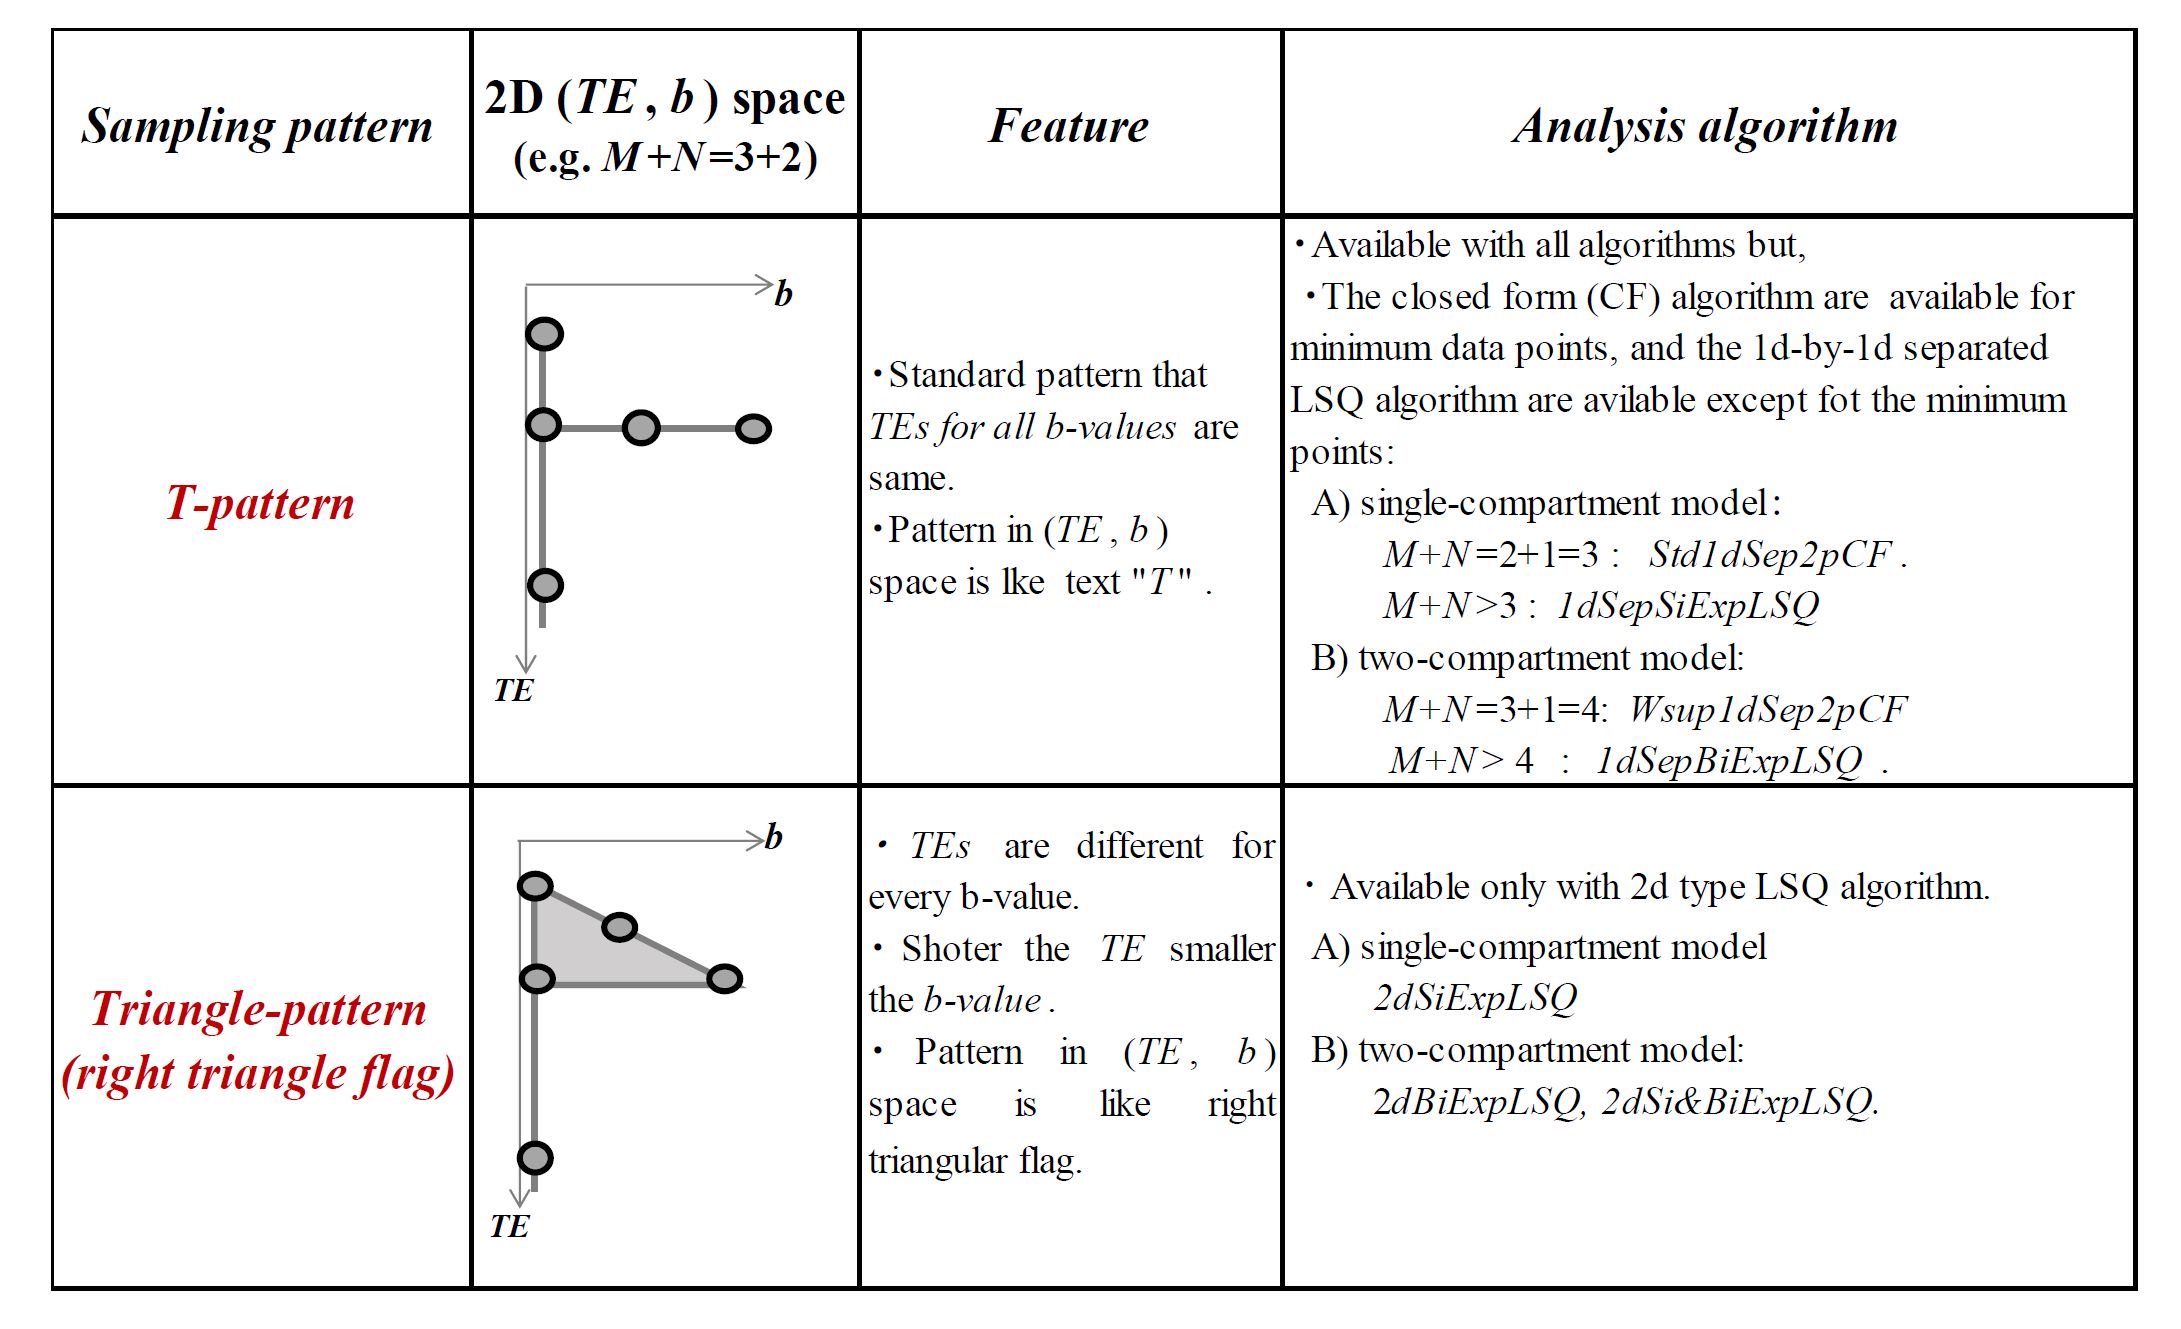
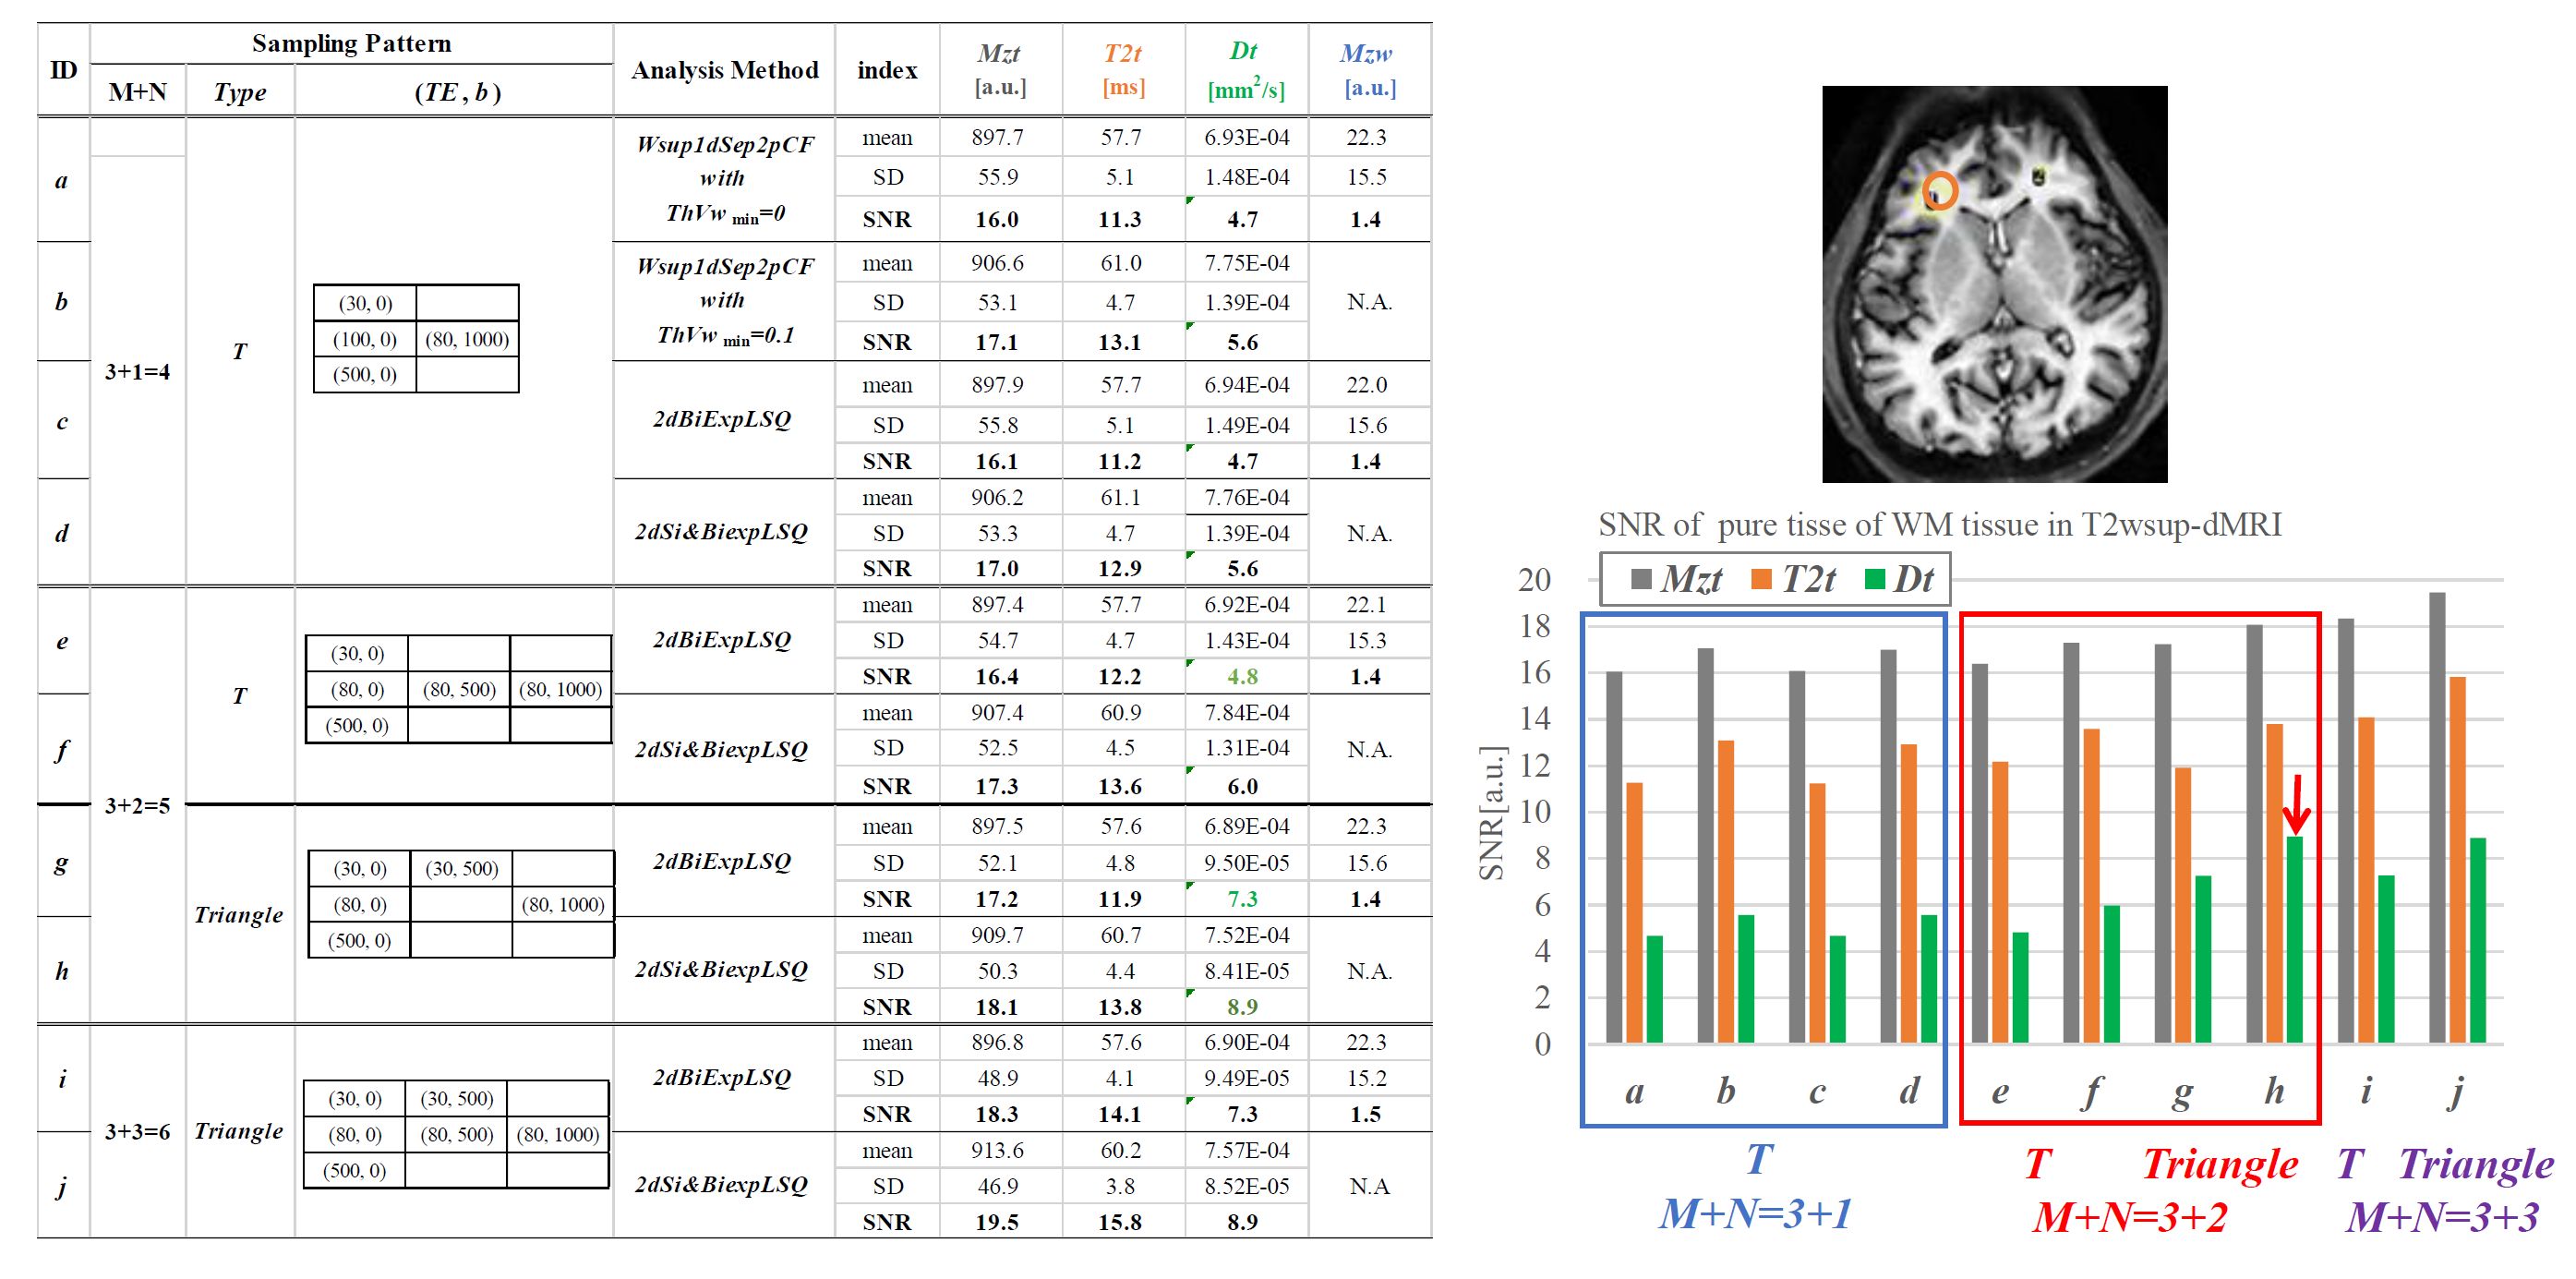
Acquired dataVolunteer SE-EPI-DWI images were acquired on 3T MRI (Canon Medical Systems) after obtaining written informed consent. M different TE with b=0 images and N isotropic DWI images (b>0) with 6-axis MPG, total M+N images with TR=10000 ms were acquired. Data sampling patterns in (TE, b) spaces were T-patten and Triangle-pattern (Fig. 2) each with several combinations of sampling points. Sufficiently higher SNR images were acquired then simulated Gaussian noise of SNR=50, where the signal intensity (SI) was selected on the frontal white matter (WM) region of PDW image, were added each image then magnitude images were obtained.
Data Analysis
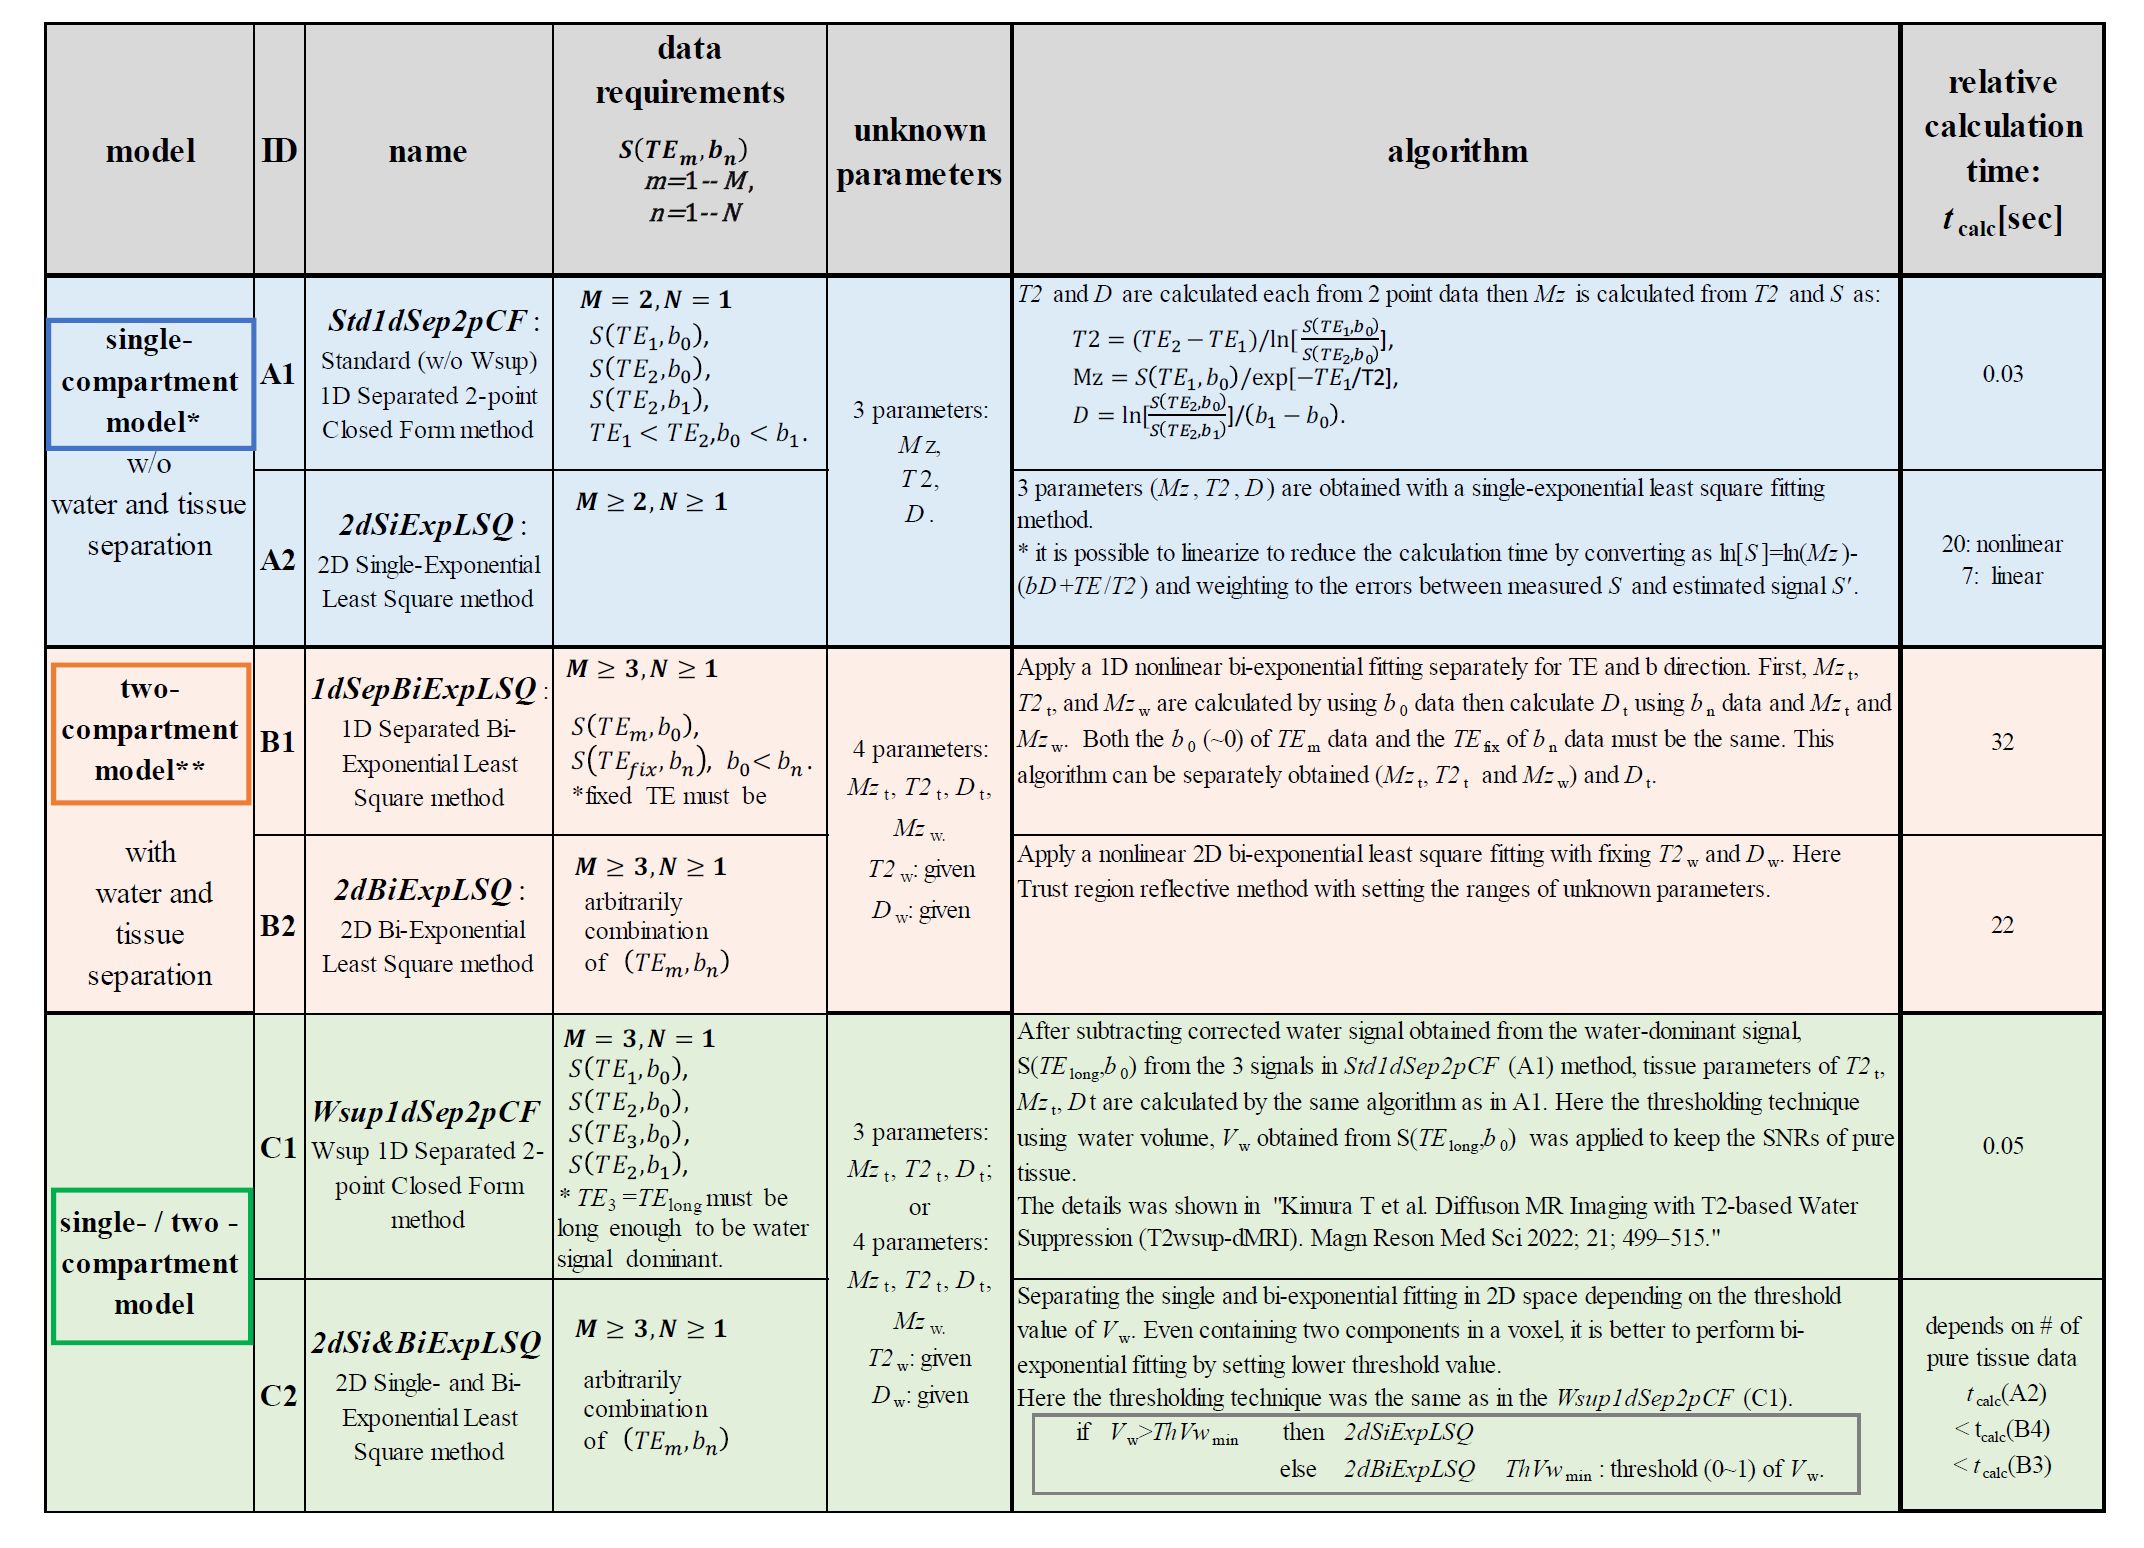
At first, the separation of pure tissue voxel or not was performed by using water volume (Vw) calculated from SE long-TE image. Then CF algorithm with tissue separation (Wsup1dSep2pCF) and 2 kinds of nonlinear LSQ curve fitting algorithms of 2dBiExpLSQ and 2dSi&BiExpLSQ (Fig. 3) were applied then compared the image qualities and SNRs of quantitative tissue parameter maps of Mzt, T2t, Dt and Mzw. For analysis software, MATLAB 2019a (MathWorks Corp.) was used. In those, an in-house program for the CF method, and function ‘fit’, trust-region-reflective algorithm for nonlinear LSQ fitting were used with setting a reasonable range of each parameter.
Results
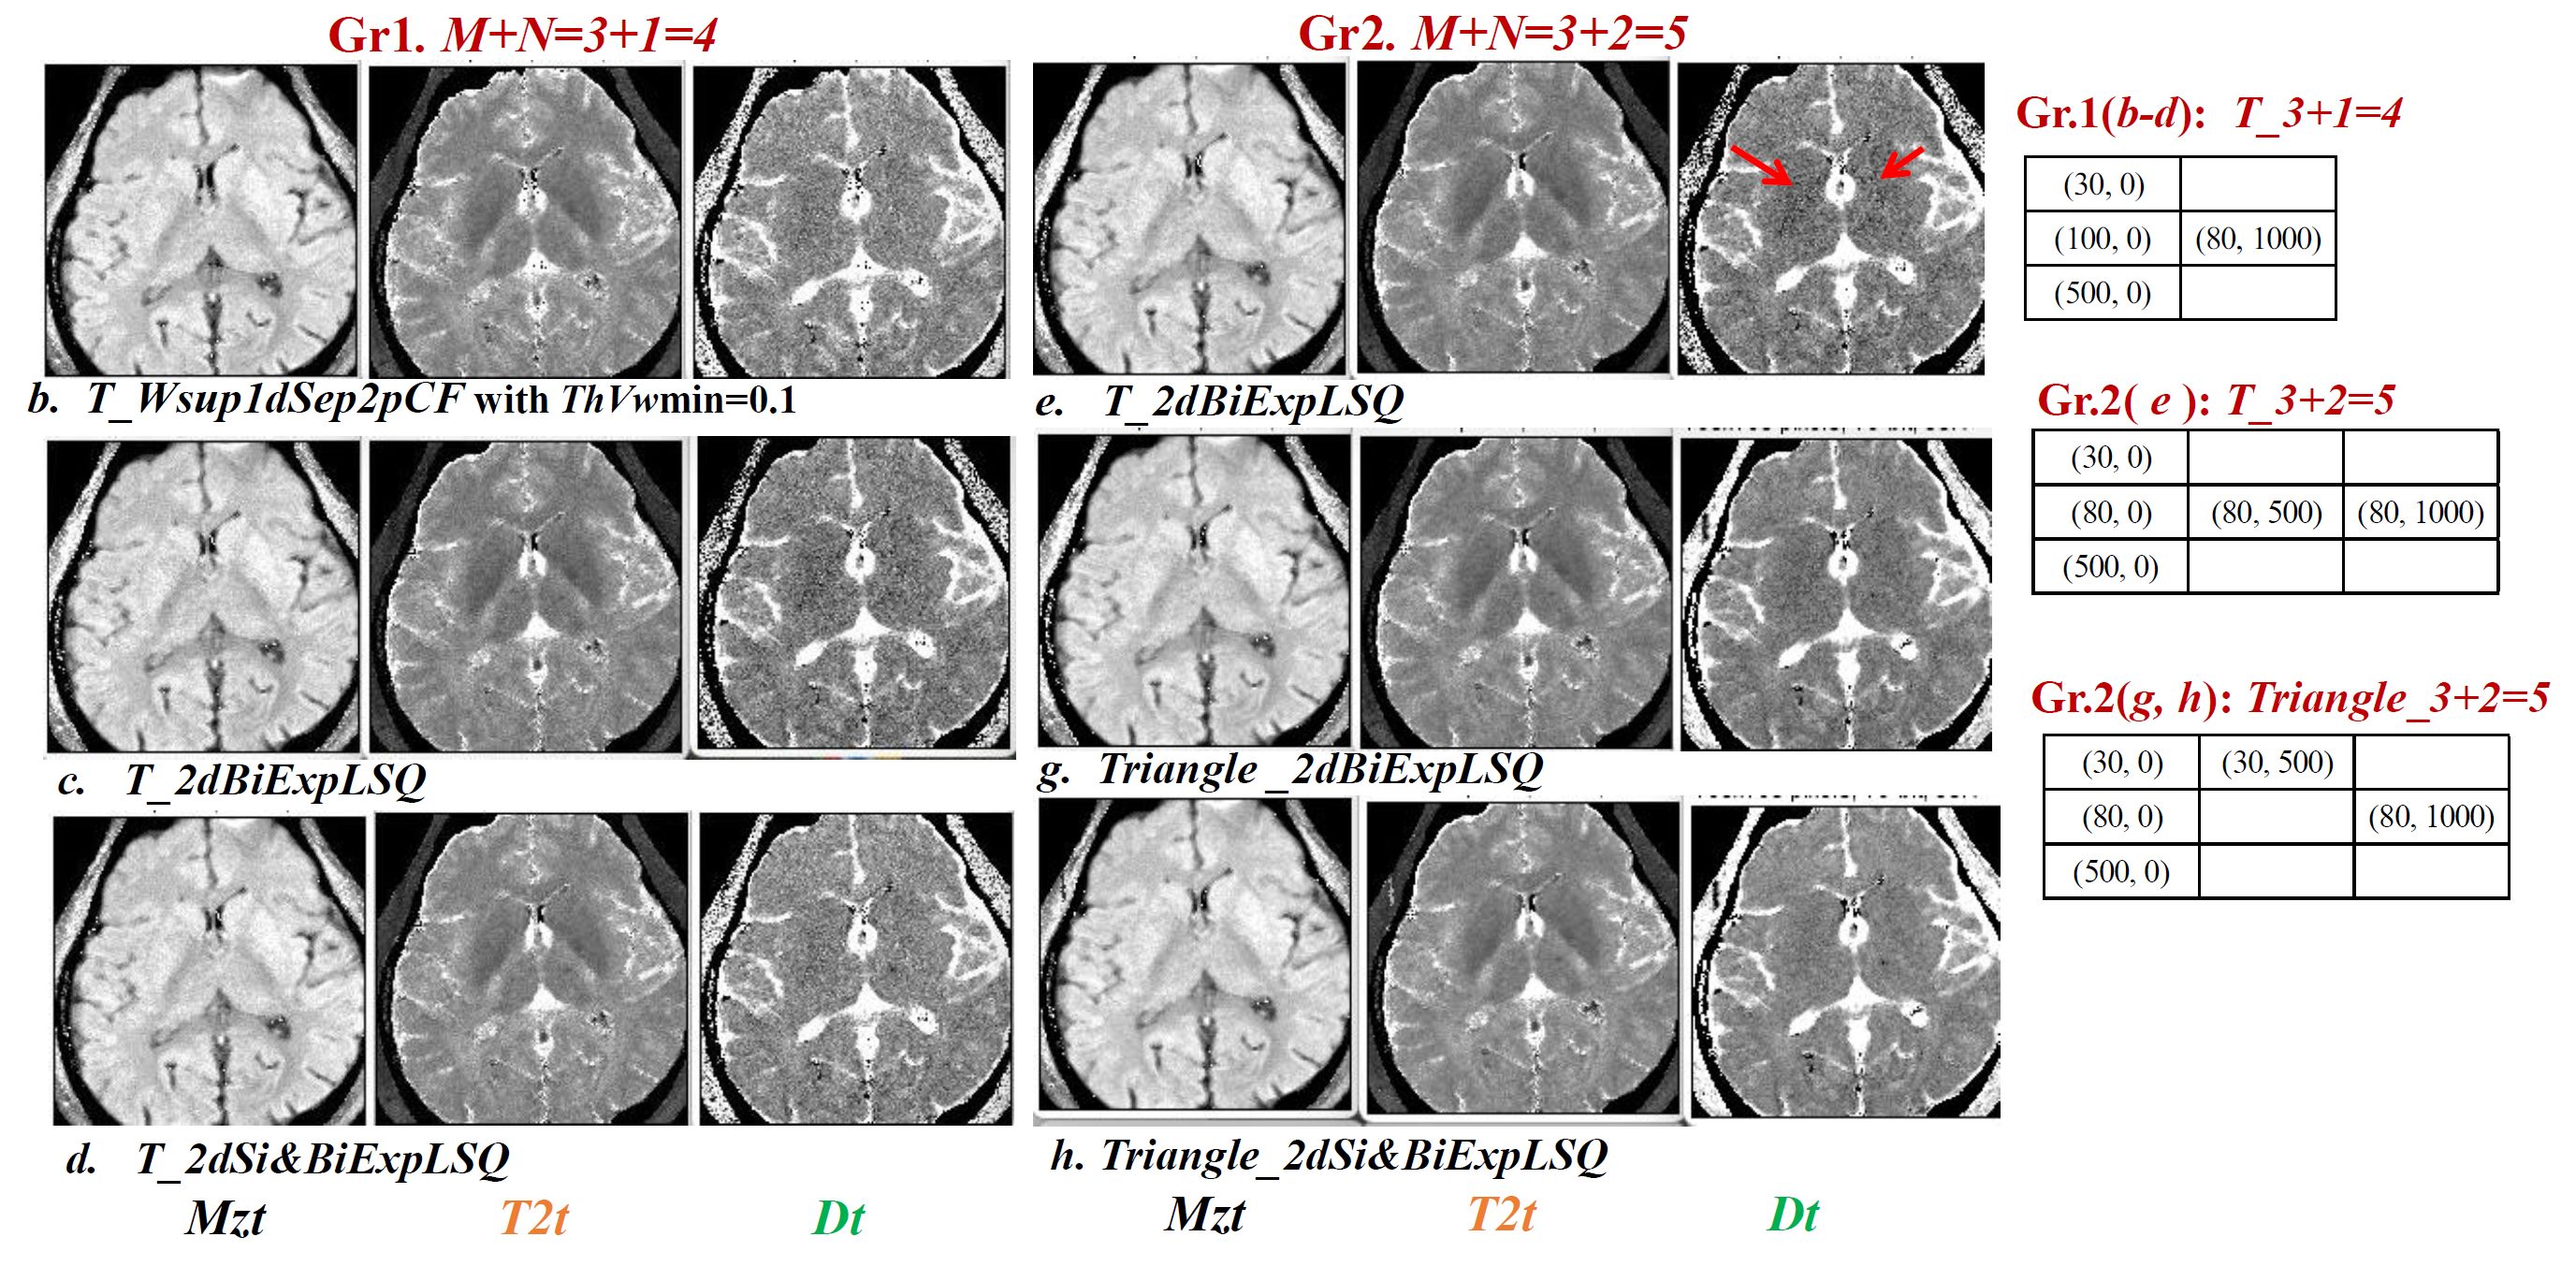
MRI quantitative maps (Fig. 4) and those ROI results (Fig. 5) are shown. Compared among the minimum data points (M+N=3+1=4) (a, b, c, d). the Wsup1dSep2pCF with ThVwmin=0.1(b) and 2dSi&BiExpLSQ (d) provided better SNR than the 2dBiExpLSQ (c) did in all parameter maps. Compared among the data points (M+N=3+2=5) (e, f, g, h), the Triangle-patterns (g, h) provided 50% better SNR than the T-patterns (e, f) did with the same algorithm in the Dt map. Furthermore, compared between the same Triangle-patterns with two algorithms (g, h), the 2dSi&BiExpLSQ fitting (h) provided better SNR of 24% than with 2dBiExpLSQ (g) did; i.e., the combination of Triangle-pattern with 2dSi&BiExpLSQ fitting algorithm (h) provided totally 85% better SNR than the T-pattern with 2dBiExpLSQ (e) in pure tissue region of WM while suppressing CSF-PVE artifacts. In addition, both the SNRs of Mzt and T2t maps were also slightly improved similarly as in each combination.Discussion
These in-vivo MRI results were obtained almost similarly to the simulation results8. At first, when the minimum data points of the T-pattern are given, the Wsup1dSep2pCF algorithm is the best viewing from the accuracy and computation time. When more data points are allowed to be given, the Triangle pattern with the 2d-LSQ algorithm can contribute to improve the Dt SNR, since the shorter TE provides higher SNR at the same b-value. It is further effective as the tissue T2 (T2t) is shorter. Furthermore, the Triangle pattern is suitable considering the gradient hardware load because the shorter TE requires a smaller b-value. For the analysis algorithm, the 2dSi&BiExpLSQ contributes to improving the tissue SNR and reducing the computing load, since the single-exp LSQ fitting can be easily modified to a fast linear algorithm, and the brain tissue regions applicable to a single-exponential fitting is usually over 50 %. The Wsup1dSep2pCF and 2dSi&BiExpLSQ algorithms are effective in keeping the tissue SNRs by suppressing the CSF depending on the CSF volume in each voxel. In conclusion, through the simulation and this in-vivo MRI study, our proposed T2wsup-dMRI combining with those optimal data pattern and analysis algorithm could improve the accuracy and precision with minimum cost. Further optimization of the fast data acquisition protocol is remaining challenge.Acknowledgements
This study was supported by the Policy-based Medical Services Foundation in Japan, and MRI data acquisition was supported by Canon Medical Systems Corp., Oatawara, Japan.References
1. Salminen LE, Conturo TE, Bolzenius JD, et al. Reducing CSF Partial Volume Effects to Enhance Diffusion Tensor Imaging Metrics of Brain Microstructure. Technol Innov. 2016; 18:5-20.
2. Tanenbaum LN, Tsiouris AJ, Johnson AN, et al. Synthetic MRI for clinical neuroimaging: results of the Magnetic Resonance Image Compilation (MAGiC) prospective, multicenter, multireader trial. AJNR Am J Neuroradiol 2017;38:1103–1110.
3. Hagiwara A, Hori M, Yokoyama K, et al. Synthetic MRI in the detection of multiple sclerosis plaques. AJNR Am J Neuroradiol 2017; 38:257–263.
4. Granberg T, Uppman M, Hashim F, et al. Clinical feasibility of synthetic MRI in multiple sclerosis: a diagnostic and volumetric validation study. AJNR Am J Neuroradiol 2016; 37:1023–1029.
5. Kimura T, Yamashita K, Fukatsu K. Synthetic MRI with T2-based Water Suppression to Reduce Hyperintense Artifacts due to CSF. Magn Reson Med Sci 2021; 20:325-337. 6. Kimura T, Yamashita K, Fukatsu K. Diffusion MR Imaging with T2-based Water Suppression (T2wsup-dMRI). Magn Reson Med Sci 2022; 21; 499–515.
7. Kimura T, Yamagishi N, Masuda Y. et al. Water Suppression of T1 map and Synthetic Inversion Recovery images in T2-based Water Suppression Synthetic MRI (T2wsup-synMRI). In: Proc of ISMRM,2023, #0435.
8. Kimura T. Enhancing Analysis Algorithm for T2-based water suppressed diffusion MRI (T2wsup-dMRI) by adding least-square fitting. In: Proc of ISMRM, 2022, #3823.
Figures