2148
DTI Denoising by Directional Filtering of k-space Inspired by the Pattern of Gradient Influence1Department of Biomedical Engineering, Amirkabir University of Technology, Tehran, Iran (Islamic Republic of), 2School of Cognitive Sciences, Institute for Research in Fundamental Sciences (IPM), Tehran, Iran (Islamic Republic of), 3Department of Biomedical Engineering, K. N. Toosi University of Technology, Tehran, Iran (Islamic Republic of)
Synopsis
Keywords: Diffusion Analysis & Visualization, Diffusion Tensor Imaging, Diffusion Denoising
Motivation: DTI suffers from intrinsic low SNR compared to conventional MRI, making denoising crucial.
Goal(s): Our study aims to introduce a novel filtration method based on an estimated pattern of areas most directionally affected in the spatial frequency domain.
Approach: A pattern was suggested through DTI theory and observations of simulation data. This was then used to propose a filter for noise reduction. The application of this filter was quantitatively and qualitatively evaluated on simulated MR and DTI images, considering added noise.
Results: The results showed not only the method’s increased robustness to noise but also a clearer representation of white matter tracts.
Impact: By integrating the fundamental concepts of diffusion within the white matter into our filter design, we present a promising approach to denoising DTI data, potentially yielding more reliable and biologically meaningful results, and benefiting researchers investigating brain connectivity.
Introduction
Diffusion MR imaging is a powerful method for characterizing white matter structures in the brain. In this modality, image acquisition is repeated several times with diffusion gradient fields applied in many directions. We can then expect a considerable amount of redundancy in the acquired k-space data that can be exploited to reduce the noise and improve image quality. In this study, we assume that some areas in the k-space have little new information influenced by direction of diffusion gradient. These areas can, therefore, be filled by the average signal collected from diffusion encoding in other directions. The assumption is based on the fundamental theory of DTI, which suggests that the primary effect of the diffusion gradient field is a signal loss caused by diffusion along tracts that are mostly parallel to the direction of the applied gradient1. Furthermore, as the directions of brain fiber tracts do not change rapidly and continue for at least a couple of pixels1, the signal drop (induced by diffusion) occurs in lower spatial frequencies in the direction of the diffusion gradient, but in all frequencies in its perpendicular direction. We simulated diffusion imaging to suggest a pattern based on these concepts in the k-space, and evaluate a filter based on such a pattern.Methods
Simulation: Tensor values of the human brain were obtained for all pixels of sixty slices using the ExploreDTI toolbox2. It has a resolution of 1.8×1.8×2.4 mm³ and a matrix size of 107×107. Subsequently, brain diffusion signals were generated, comprising a single b0 image (S0, representing no diffusion gradient) and 30 in-plane gradient directions with a step angle of 6°. The b value of 1000 was applied through its theoretical formula:$$S=S_0 e^{-b D}$$
The k-space for every gradient direction was then filled using the Cartesian filling approach, expressed mathematically as:
$$S\left(k_x, k_y\right)=\iint_{x, y} m(x, y) e^{-i 2 \pi\left[x \cdot k_x+y \cdot k_y\right]} d x d y$$
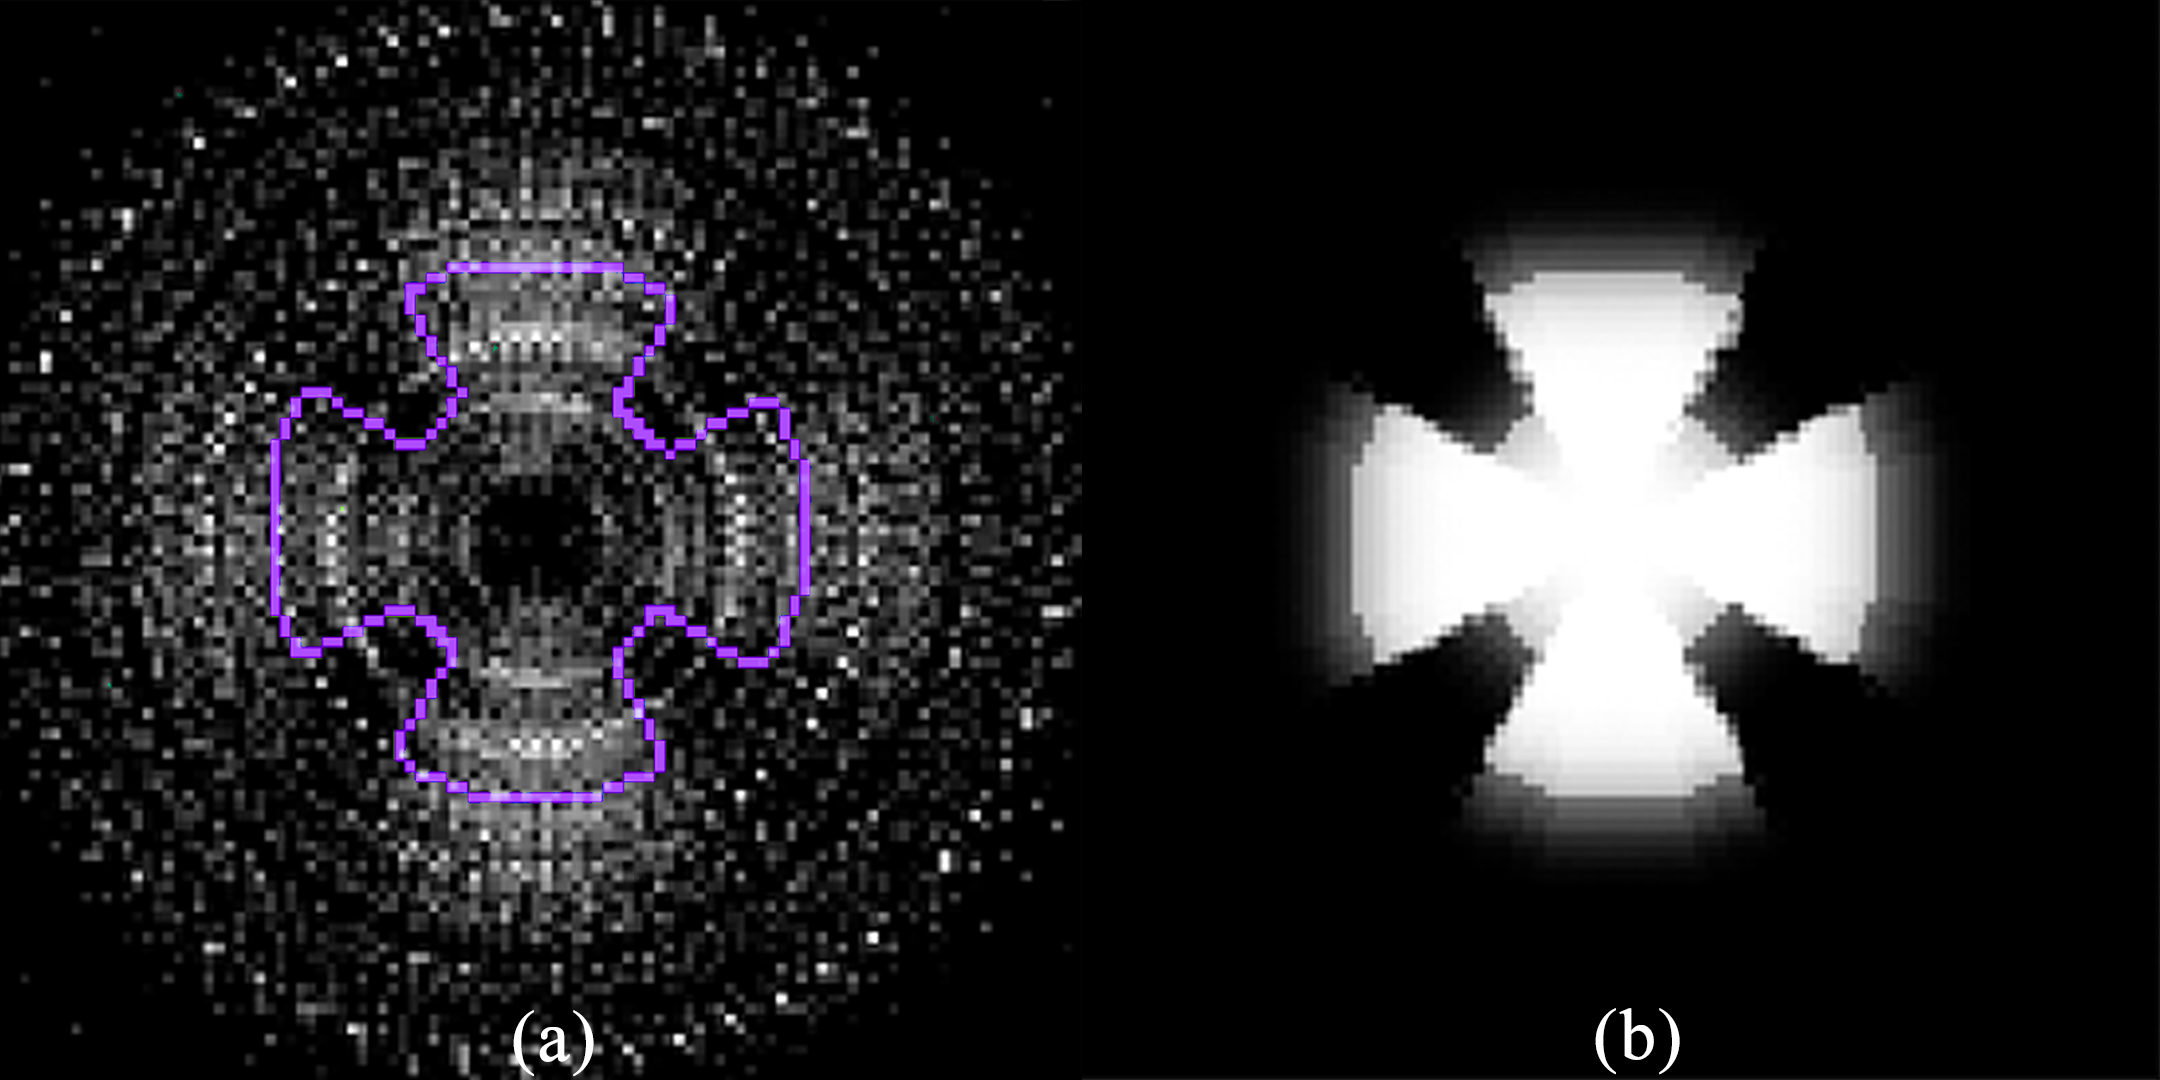
Filtration: Considering the image brightness, a petal-like pattern (purple overlay in Figure.1a) was suggested over a mean k-space with all diffusion gradient angles aligned. Following the main idea, we hypothesized that less directionally affected information lies outside of this pattern. Subsequently, a binary mask matrix was created with values inside the petal pattern assigned 1 and values outside assigned 0. The mask was then smoothed out to avoid a rigid cut-off boundary (Figure.1b). The filter was applied on each k-space, by aligning the mask with each gradient angle. We retained the k-space values inside the pattern while replacing values outside with the average k-space values from all diffusion directions.
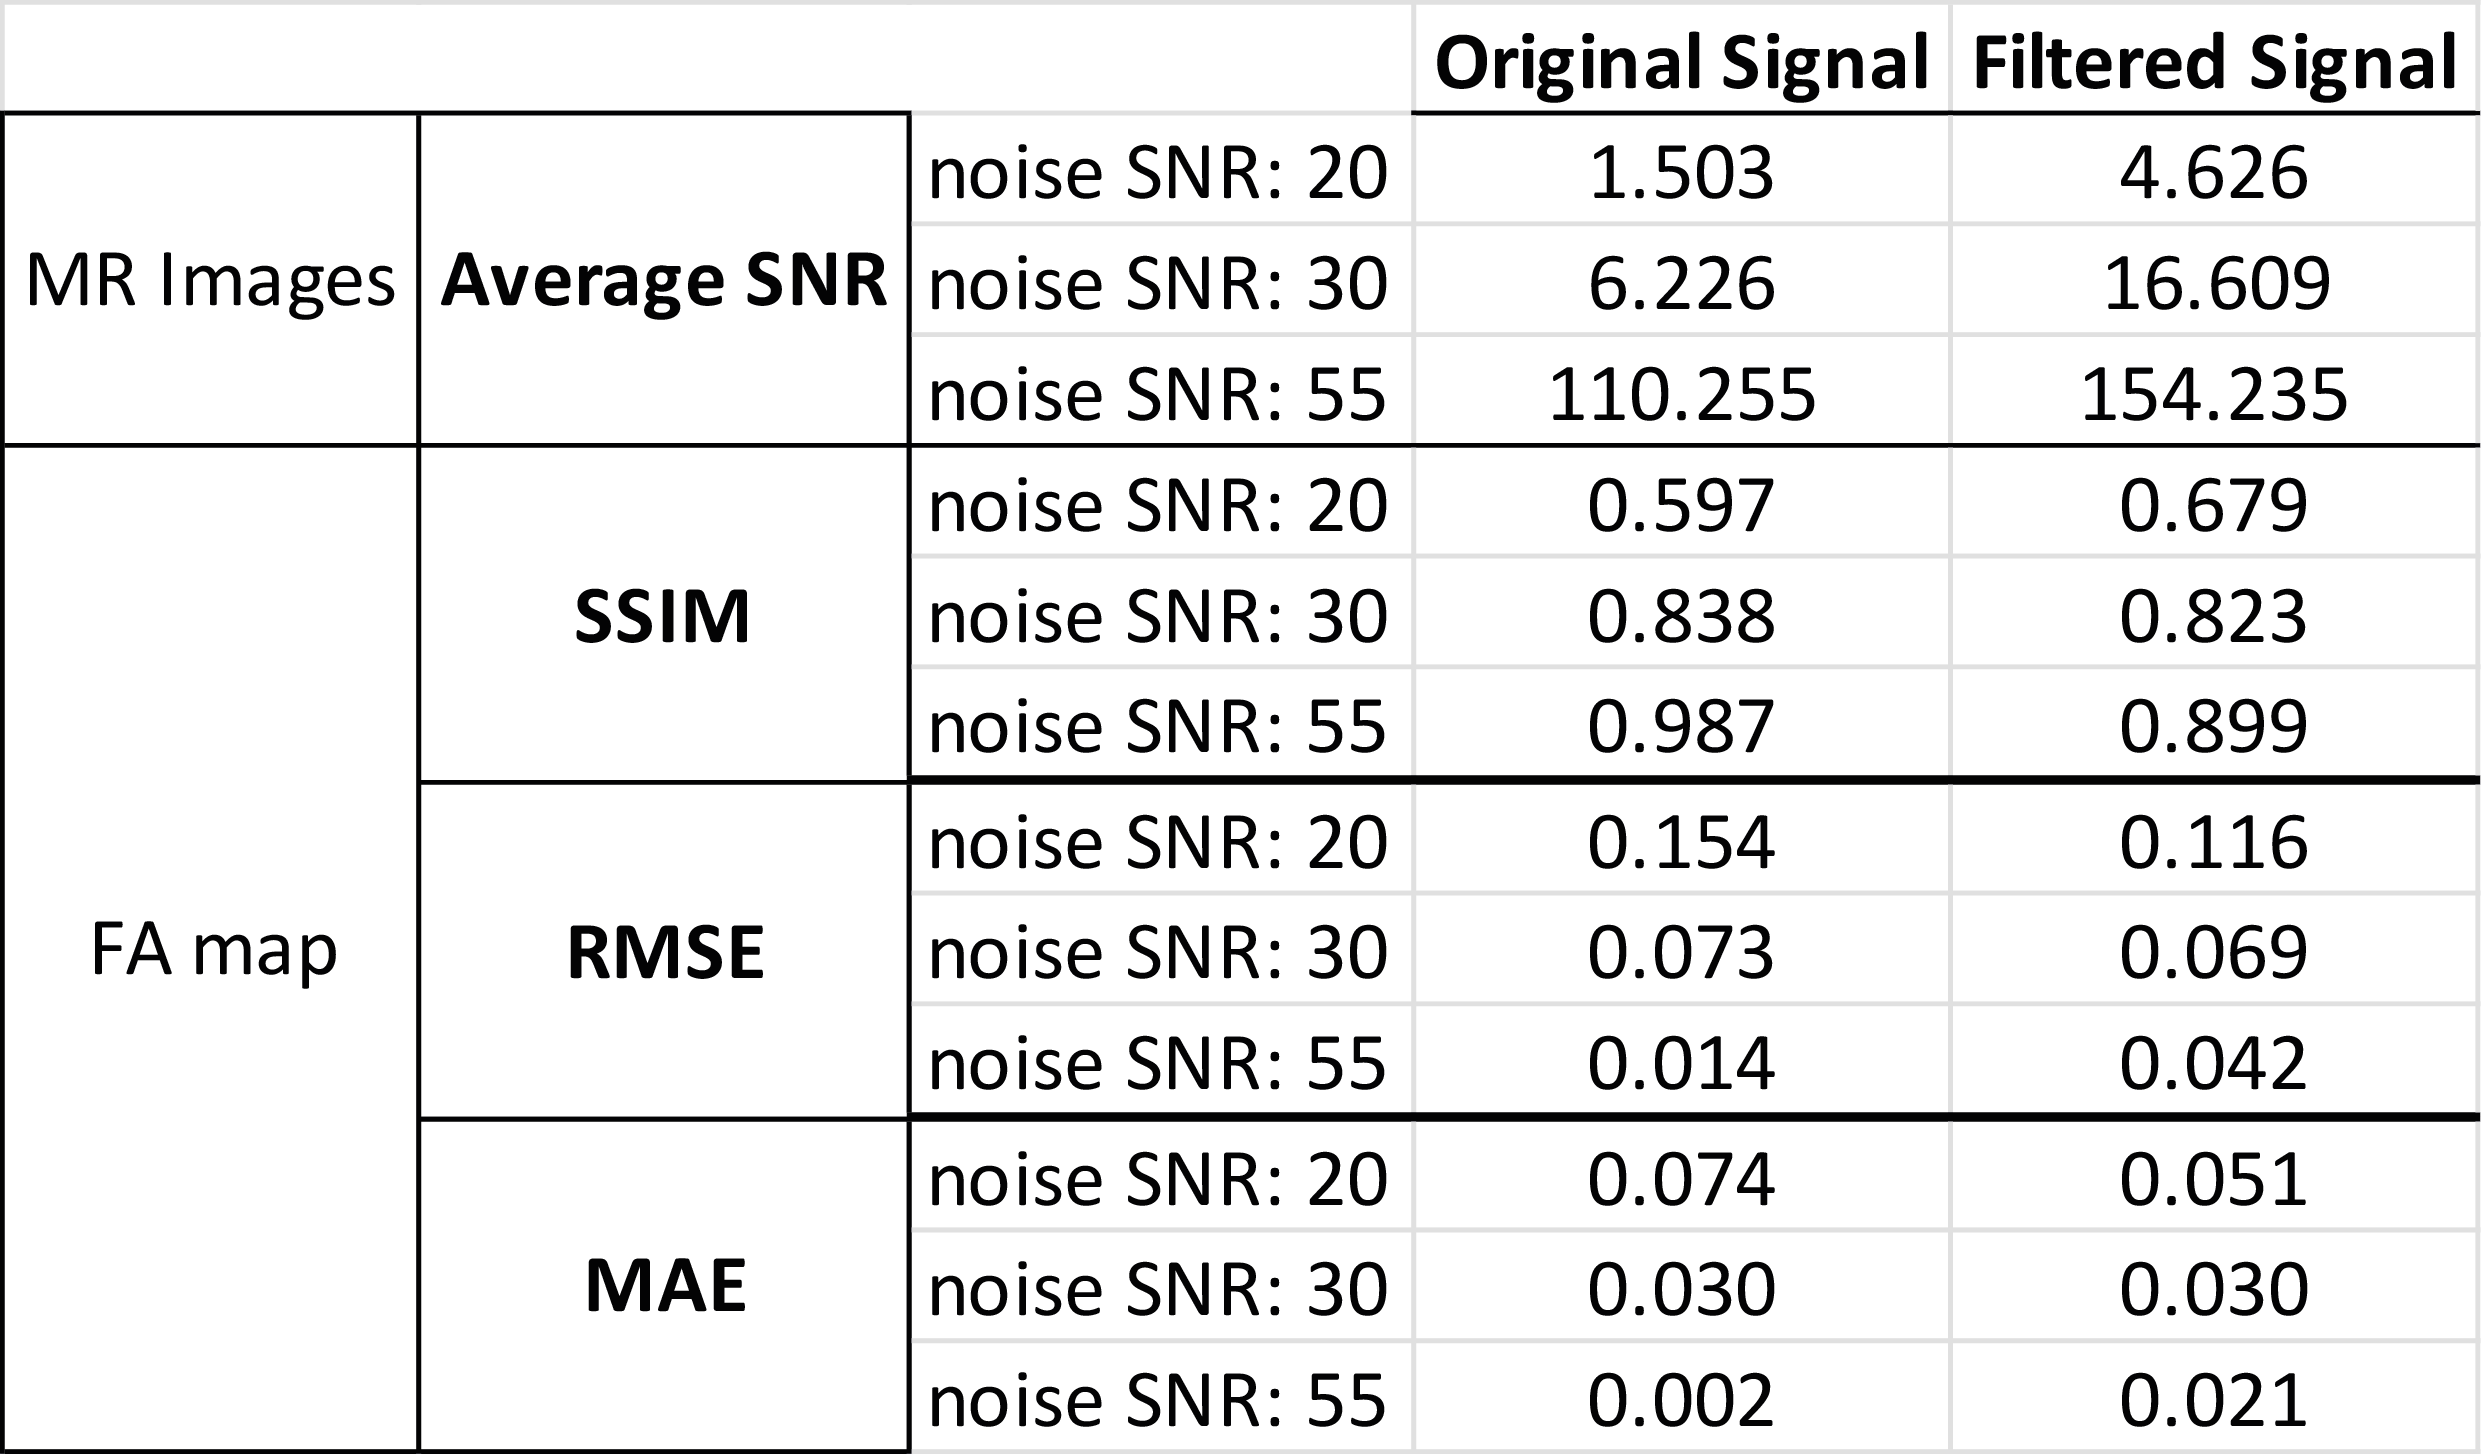
Evaluation: White Gaussian noise was introduced at varying levels to the k-space datasets to further examine the filtration effect. Our denoising approach was assessed in two stages: the reconstructed diffusion MR images and consequent fractional anisotropy (FA) maps. We used 4 metrics for quantitative evaluation, Signal-to-Noise Ratio (SNR), Structural Similarity Index (SSIM), Root-Mean-Square Error (RMSE), and Mean Absolute Error (MAE) metrics.
Results
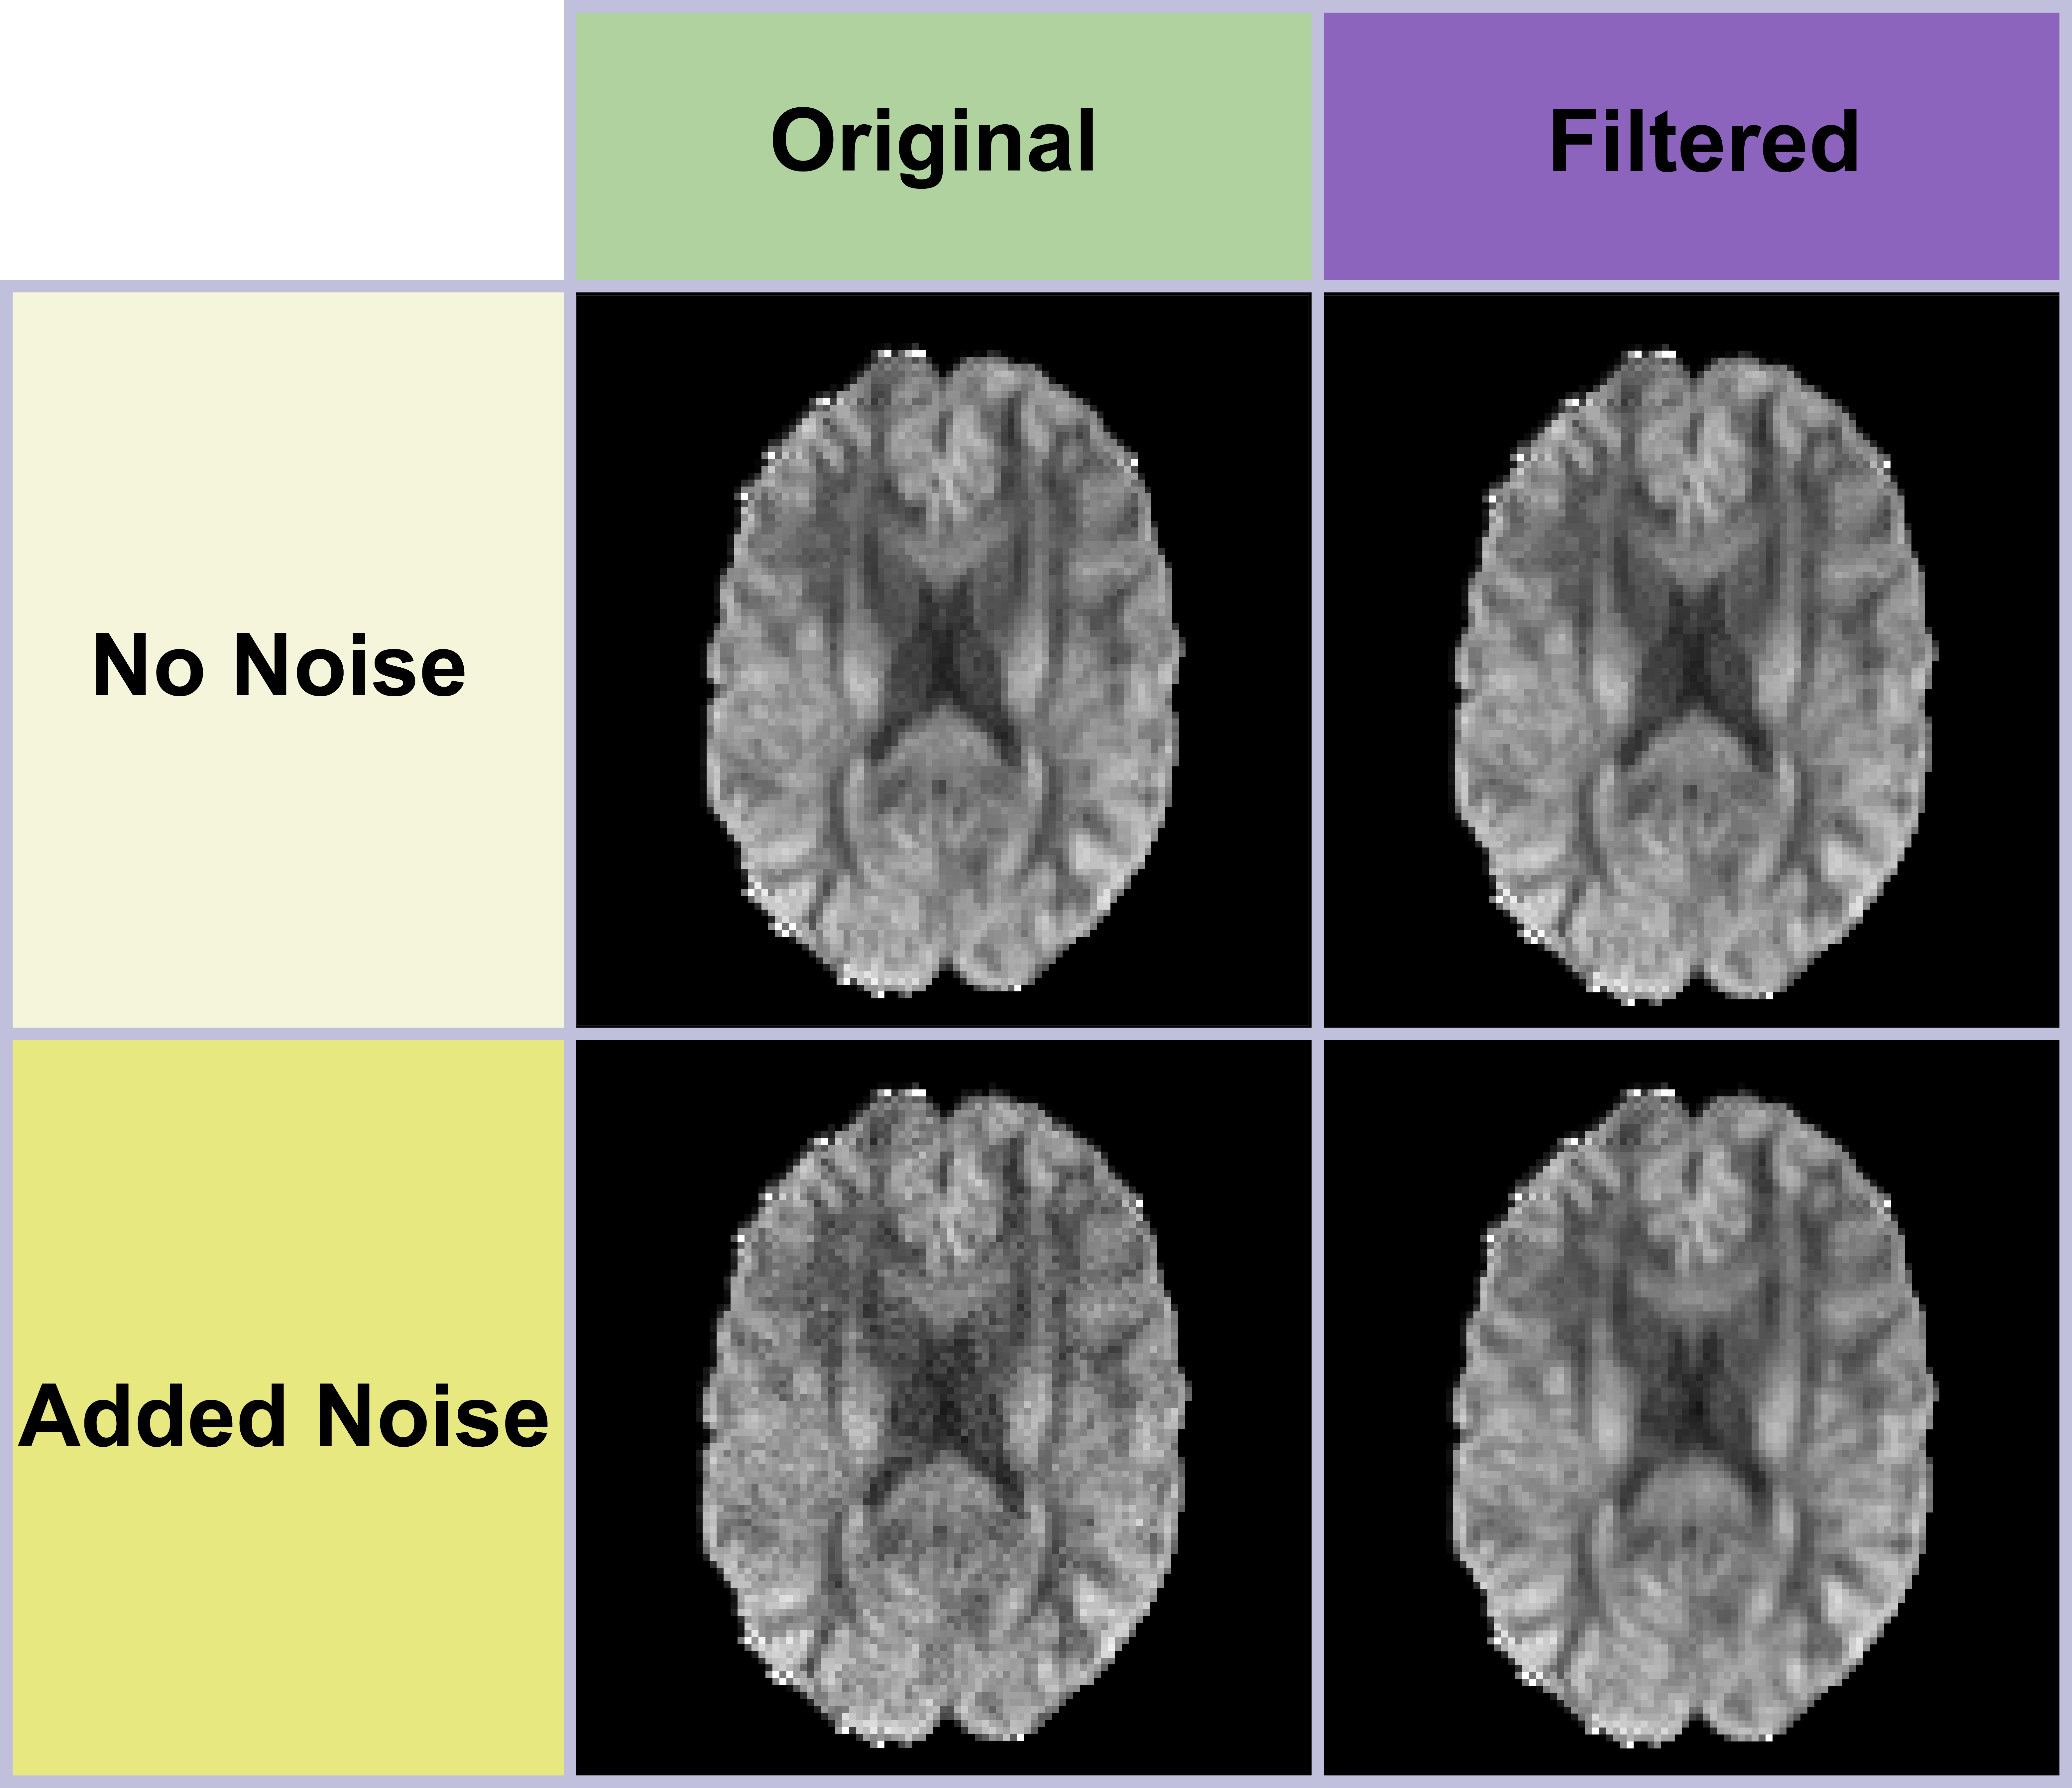
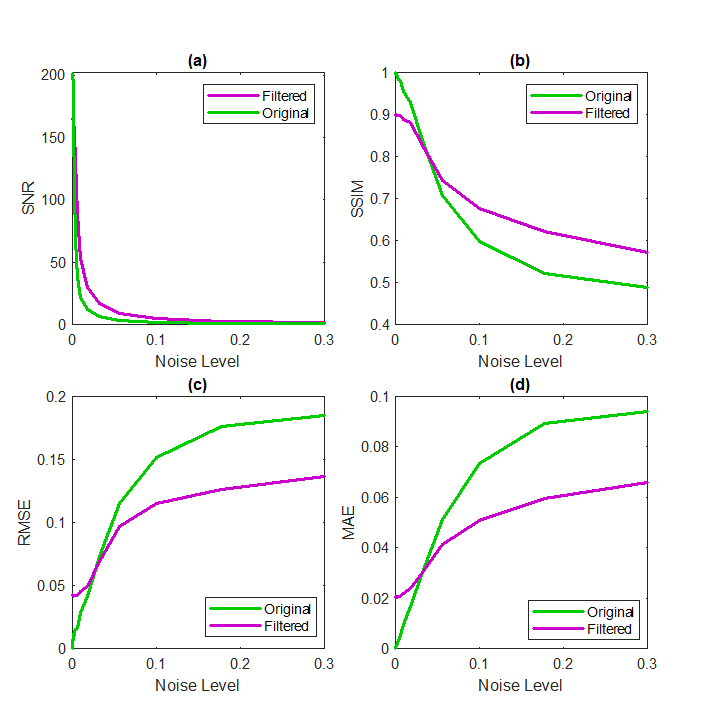
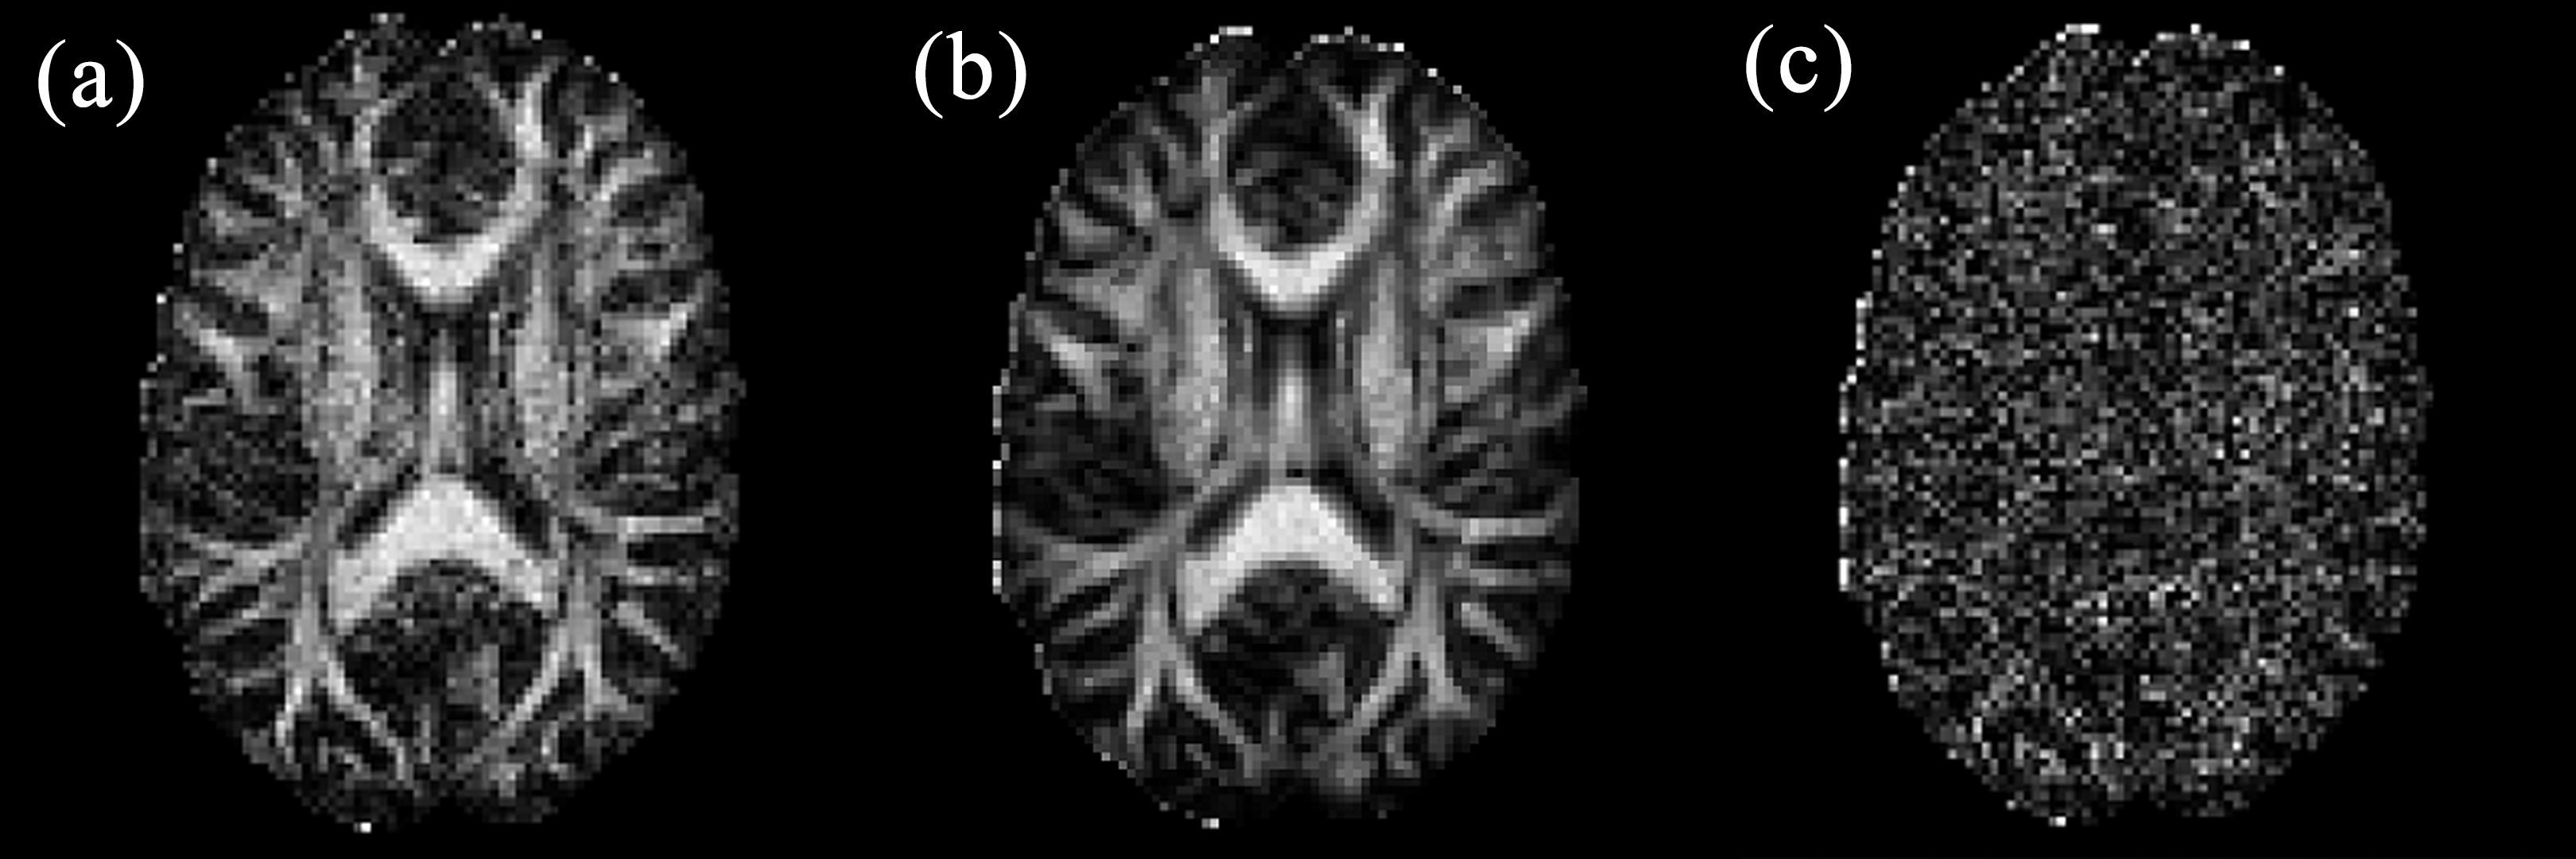
The results were shown on one middle slice due to its extensive coverage of the brain. Figure.2 illustrates the effect of filtration on one reconstructed MR image. The image seems visually smoother after filtration, specifically under added noise. Average SNRs of MR images from filtered and original k-space datasets are shown in Figure.3a, which displays higher values for the filtered signals. For instance, the average SNR of MR images increases by 39.89% using filtration under noise with an SNR value of 55 (Table 1). Figure 4 displays the FA map both with and without the filter under noise-free conditions. It can be visually confirmed that the filtered k-space results in a more robust, less noisy FA map with a clear representation of the tracts. The FA map metrics are depicted in Figure.3b, c, and d. The average rate of change for SSIM, RMSE, and MAE was reduced in the filtered results by 29.53%, 46.28%, and 47.64%, respectively, indicating a substantial increase in robustness.Discussion and Conclusion
In this study, we introduced a novel filtration technique in the spatial frequency domain that distinguishes areas minimally/maximally affected by the diffusion gradient’s direction. Resultant MR images and FA map after applying the suggested filter show efficient denoising. Additionally, filtration seems to show a better representation of tracts in the FA map (Figure.4). These observations align with our primary hypothesis, which suggests the primary effect of the diffusion gradient field can be obtained in specific directions, not all the k-space. Future work can explore alternative strategies for replacing removed data in the filtration process and evaluations of real-world data.Acknowledgements
No acknowledgement found.References
1. Mori S, J -Donald Tournier. Introduction to Diffusion Tensor Imaging and Higher Order Models. Elsever/Academic Press; 2014.
2. Leemans A, Jeurissen B, Sijbers J, and Jones DK. ExploreDTI: a graphical toolbox for processing, analyzing, and visualizing diffusion MR data. In: 17th Annual Meeting of Intl Soc Mag Reson Med, p. 3537, Hawaii, USA, 2009.
Figures