2147
Quantifying uncertainty in diffusion MRI: a comparative study at different magnetic fields1IRCCS Stella Maris Foundation, Pisa, Italy, 2University of Pisa, Pisa, Italy
Synopsis
Keywords: Diffusion Analysis & Visualization, Diffusion/other diffusion imaging techniques
Motivation: Diffusion MRI (dMRI) is a very noisy MRI technique. The low signal-to-noise ratio introduces uncertainties in diffusion metrics and structural connectivity measures.
Goal(s): We searched for a method to investigate the uncertainty in dMRI measurements and to compare them across different magnetic field strengths.
Approach: We assessed uncertainties using wild and residual bootstrapping techniques in a group of 7 healthy subjects undergoing optimized acquisition protocols at 1.5T, 3T, and 7T.
Results: 7T diffusion metrics and uncertainties are comparable with 3T and exhibited significant differences with 1.5T. The enhanced 7T spatial resolution demonstrated capabilities in representing structural connectivity with greater complexity and reduced uncertainty.
Impact: The findings support the hypothesis that 7T dMRI can offer new insights into structural connectivity and may be particularly valuable for single-subject studies, thanks to its ability to detect more connections and reduce uncertainty compared to clinical fields.
Introduction
Diffusion Magnetic Resonance Imaging (dMRI) is one of the noisiest MRI techniques, due to signal attenuation induced by diffusion-encoding gradients and high sensitivity to thermal noise. This inherently low SNR introduces uncertainty into diffusion metrics and structural connectivity measures. Numerous studies have explored methods for estimating uncertainty in dMRI-based measures, and wild and residual bootstrapping approaches have proven efficient1,2,3. In this study, we implemented these bootstrapping methods to assess uncertainty in both diffusion metrics and graph theory measures. Our goal was to establish a method for comparing acquisitions at various magnetic field strengths (1.5T, 3T, and 7T) beyond SNR considerations, assessing the reliability of estimates for each metric at each magnetic field.Method
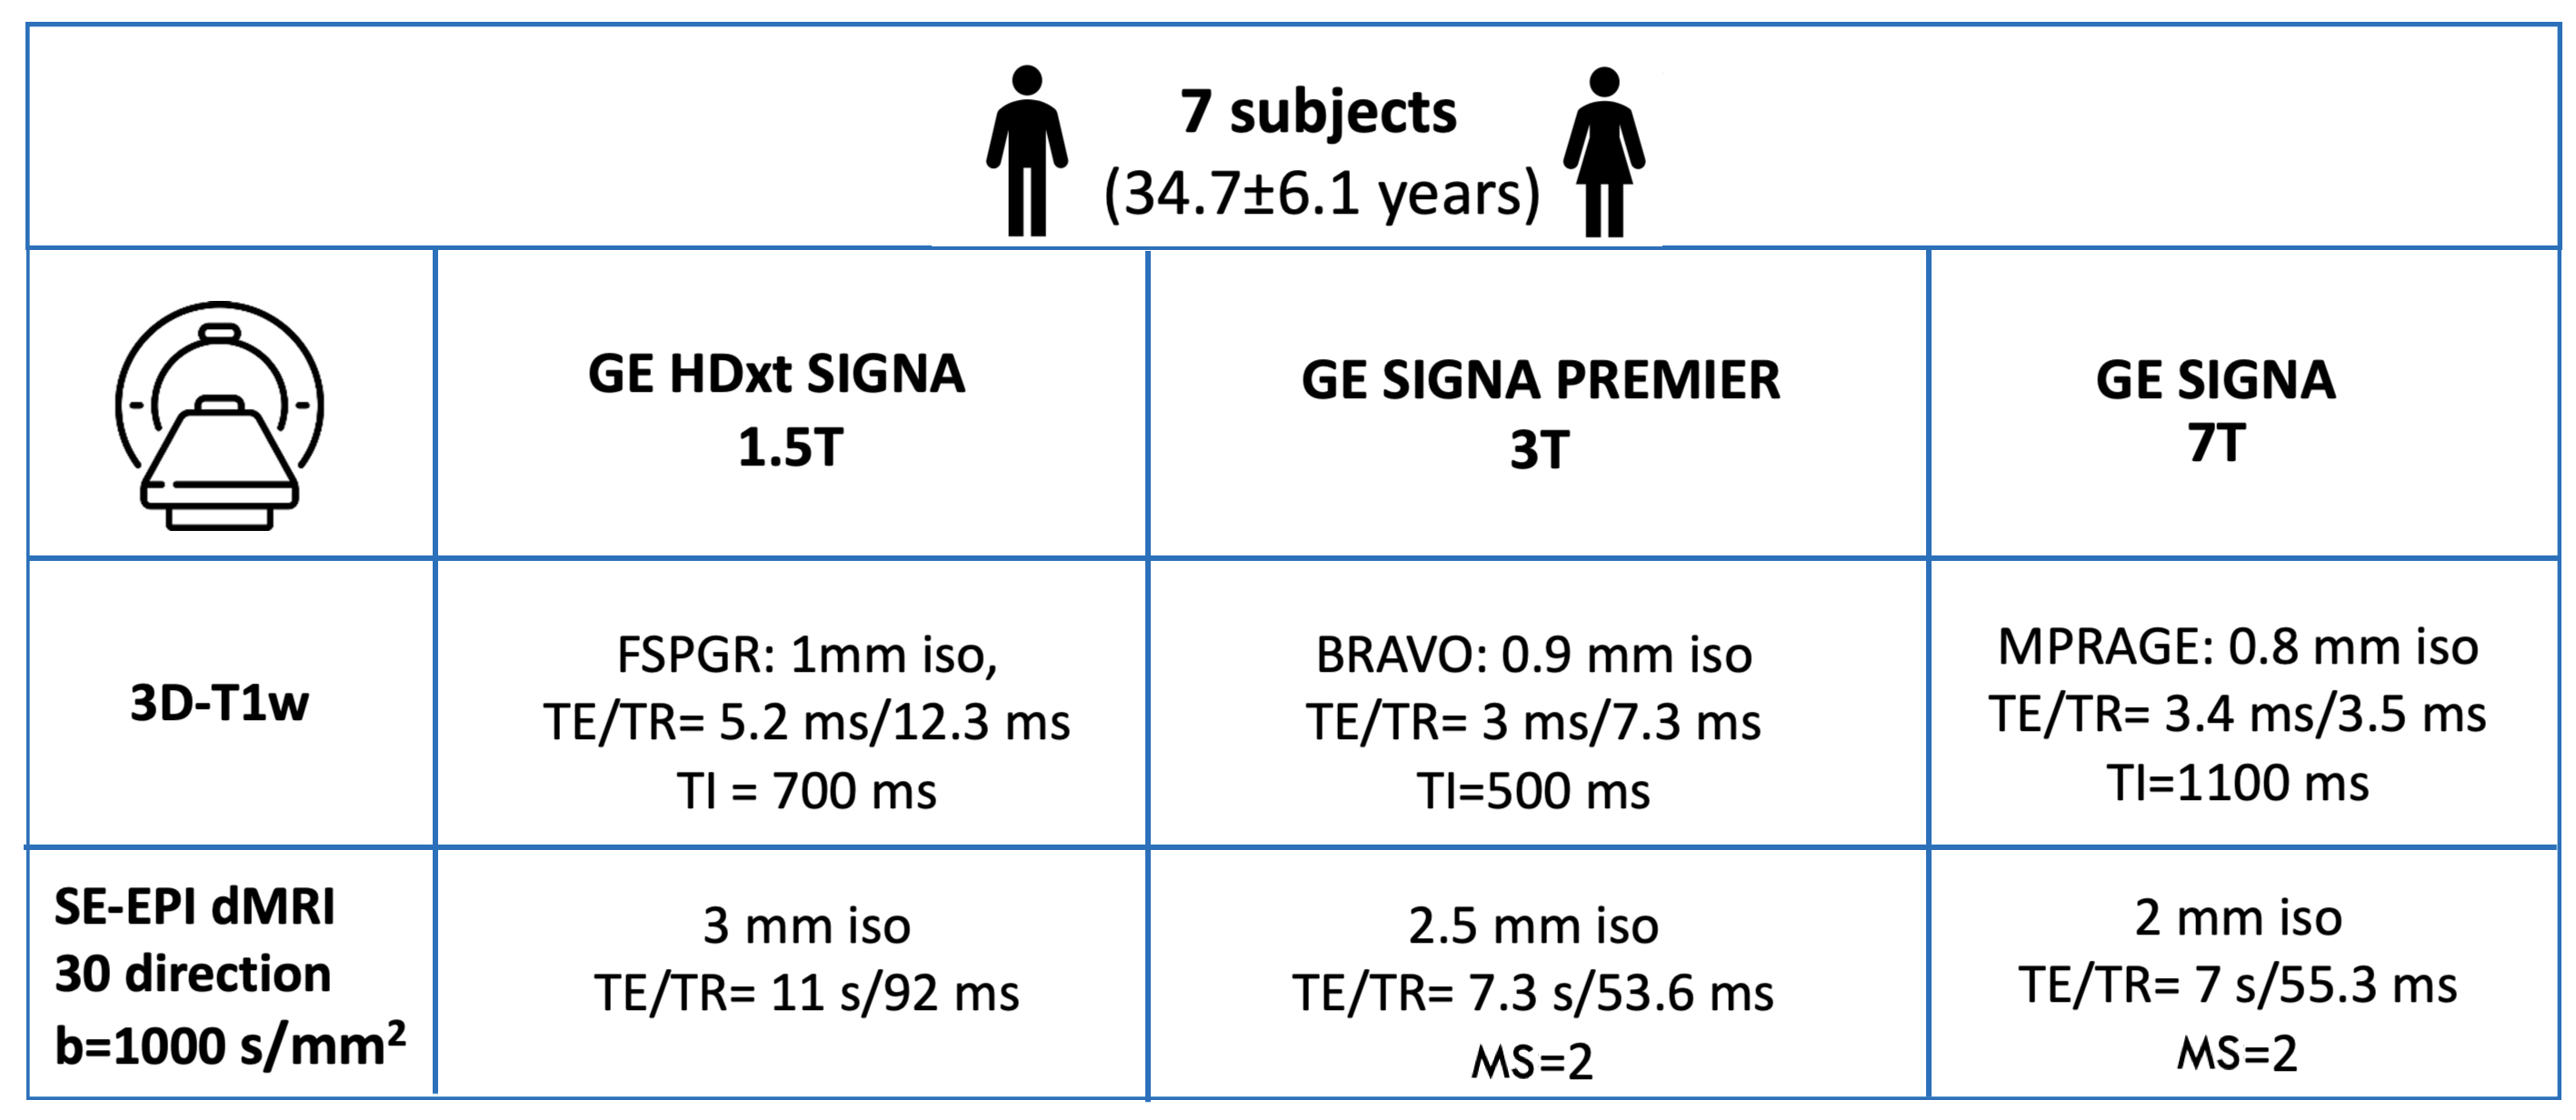
Seven healthy subjects (34.7±6.1 years) underwent scans on three GE HealthCare MRI systems: a 1.5T HDxt-SIGNA, a 3T SIGNA-Premier, and a SIGNA-7T. The protocol, including a 3D T1-weighted and a dMRI sequence, was optimized for each magnetic field strength (details in Figure 1). Each diffusion sequence was followed by additional three volumes with b-value=0 acquired with reversed phase encoding direction to correct geometric distortions. At 7T, 7mm-thick dielectric pads were placed in the occipital region, to mitigate B1 inhomogeneity effects.Diffusion images were preprocessed via MRtrix4, including coregistration, eddy current correction, geometric distortion correction, and registration to anatomical data. We analyzed the following diffusion metrics: FA, MD, AD, and RD. T1-weighted images were segmented using Freesurfer5 to define the nodes of the structural connectivity network. We obtained graph theory measures, which were divided into local and global categories, using the bctpy package6. The extracted local measures included Clustering Coefficient, Local Efficiency, Eigenvector Centrality, Betweenness Centrality, and Degree. Regarding global measures, we examined Density, Global Efficiency, and Coefficient ω.
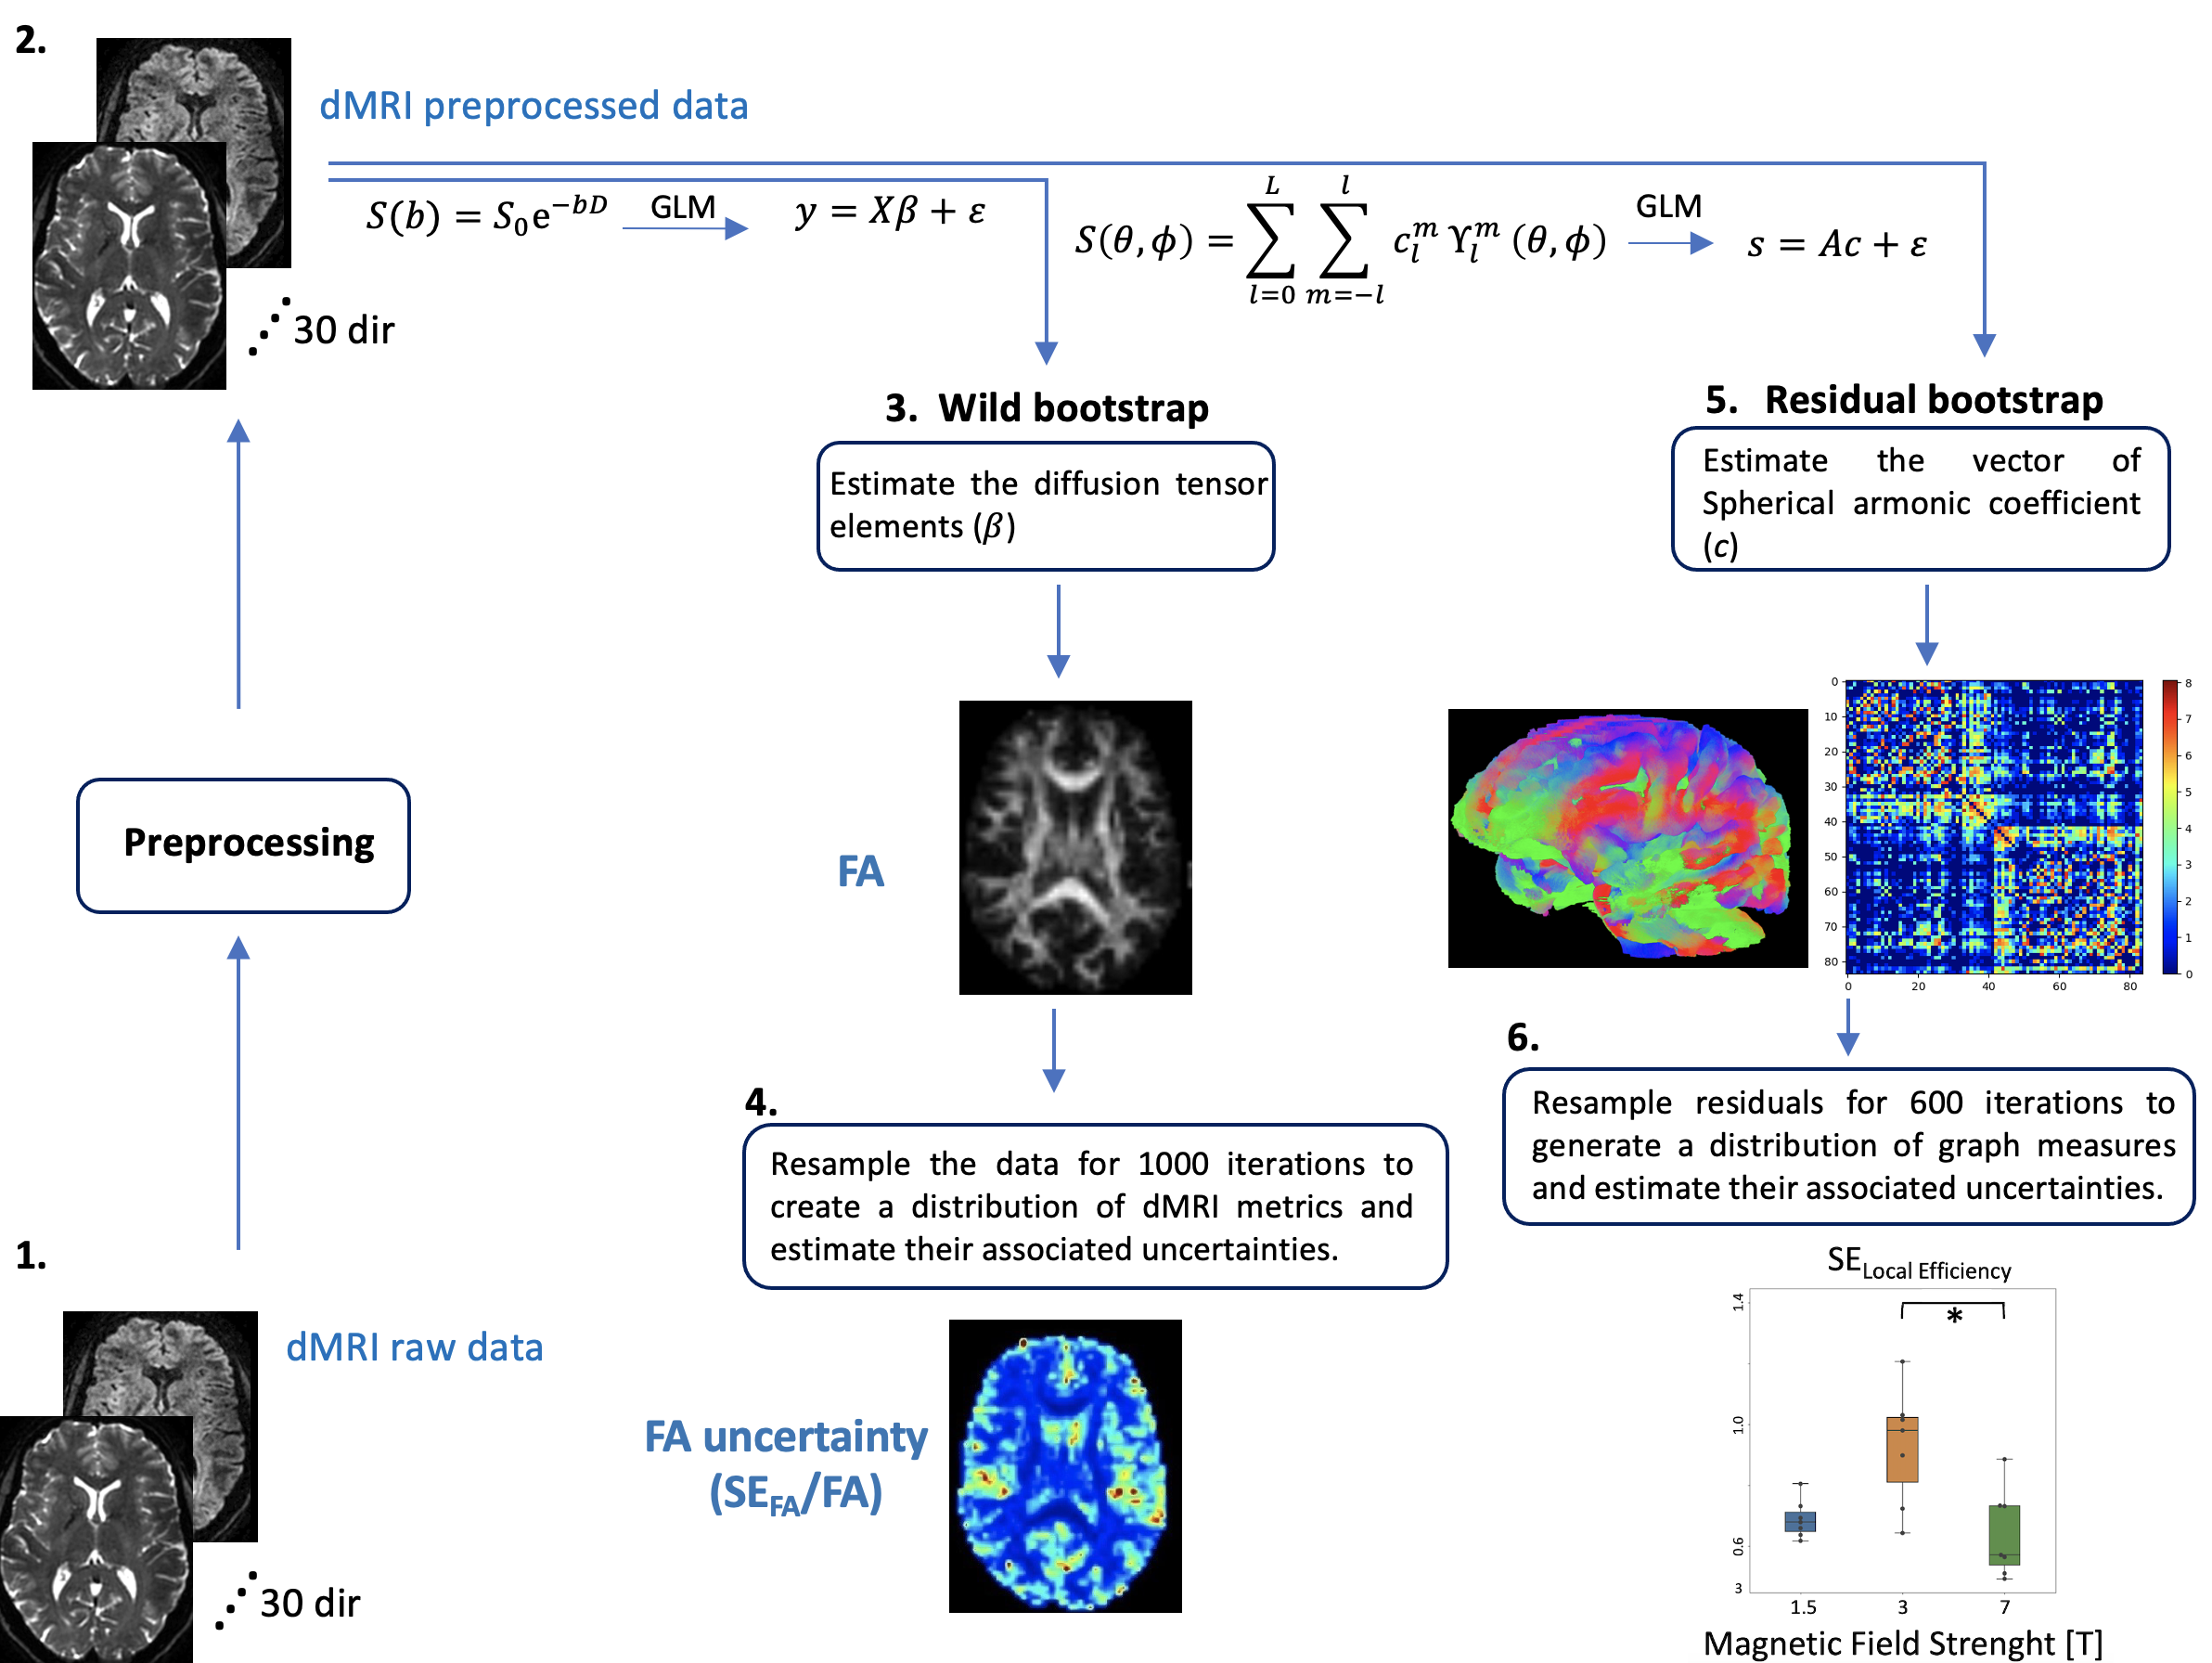
To assess the uncertainty (SE) in diffusion metrics and graph theory measures, we employed in-house software based on the dipy package7, using bootstrap methods to generate multiple datasets through resampling with replacement, specifically employing wild and residual bootstrapping approaches1. Figure 2 shows a detailed flowchart of the analysis.
We assessed diffusion metric values and their associated uncertainties in a mask of Corpus Callosum (CC) derived from Hammersmith atlas8, which was eroded by one voxel to mitigate the Partial Volume Effect (PVE). We compared dMRI-based measures among subjects using paired t-test at various magnetic field strengths, setting a significance threshold of p<0.005.
Results
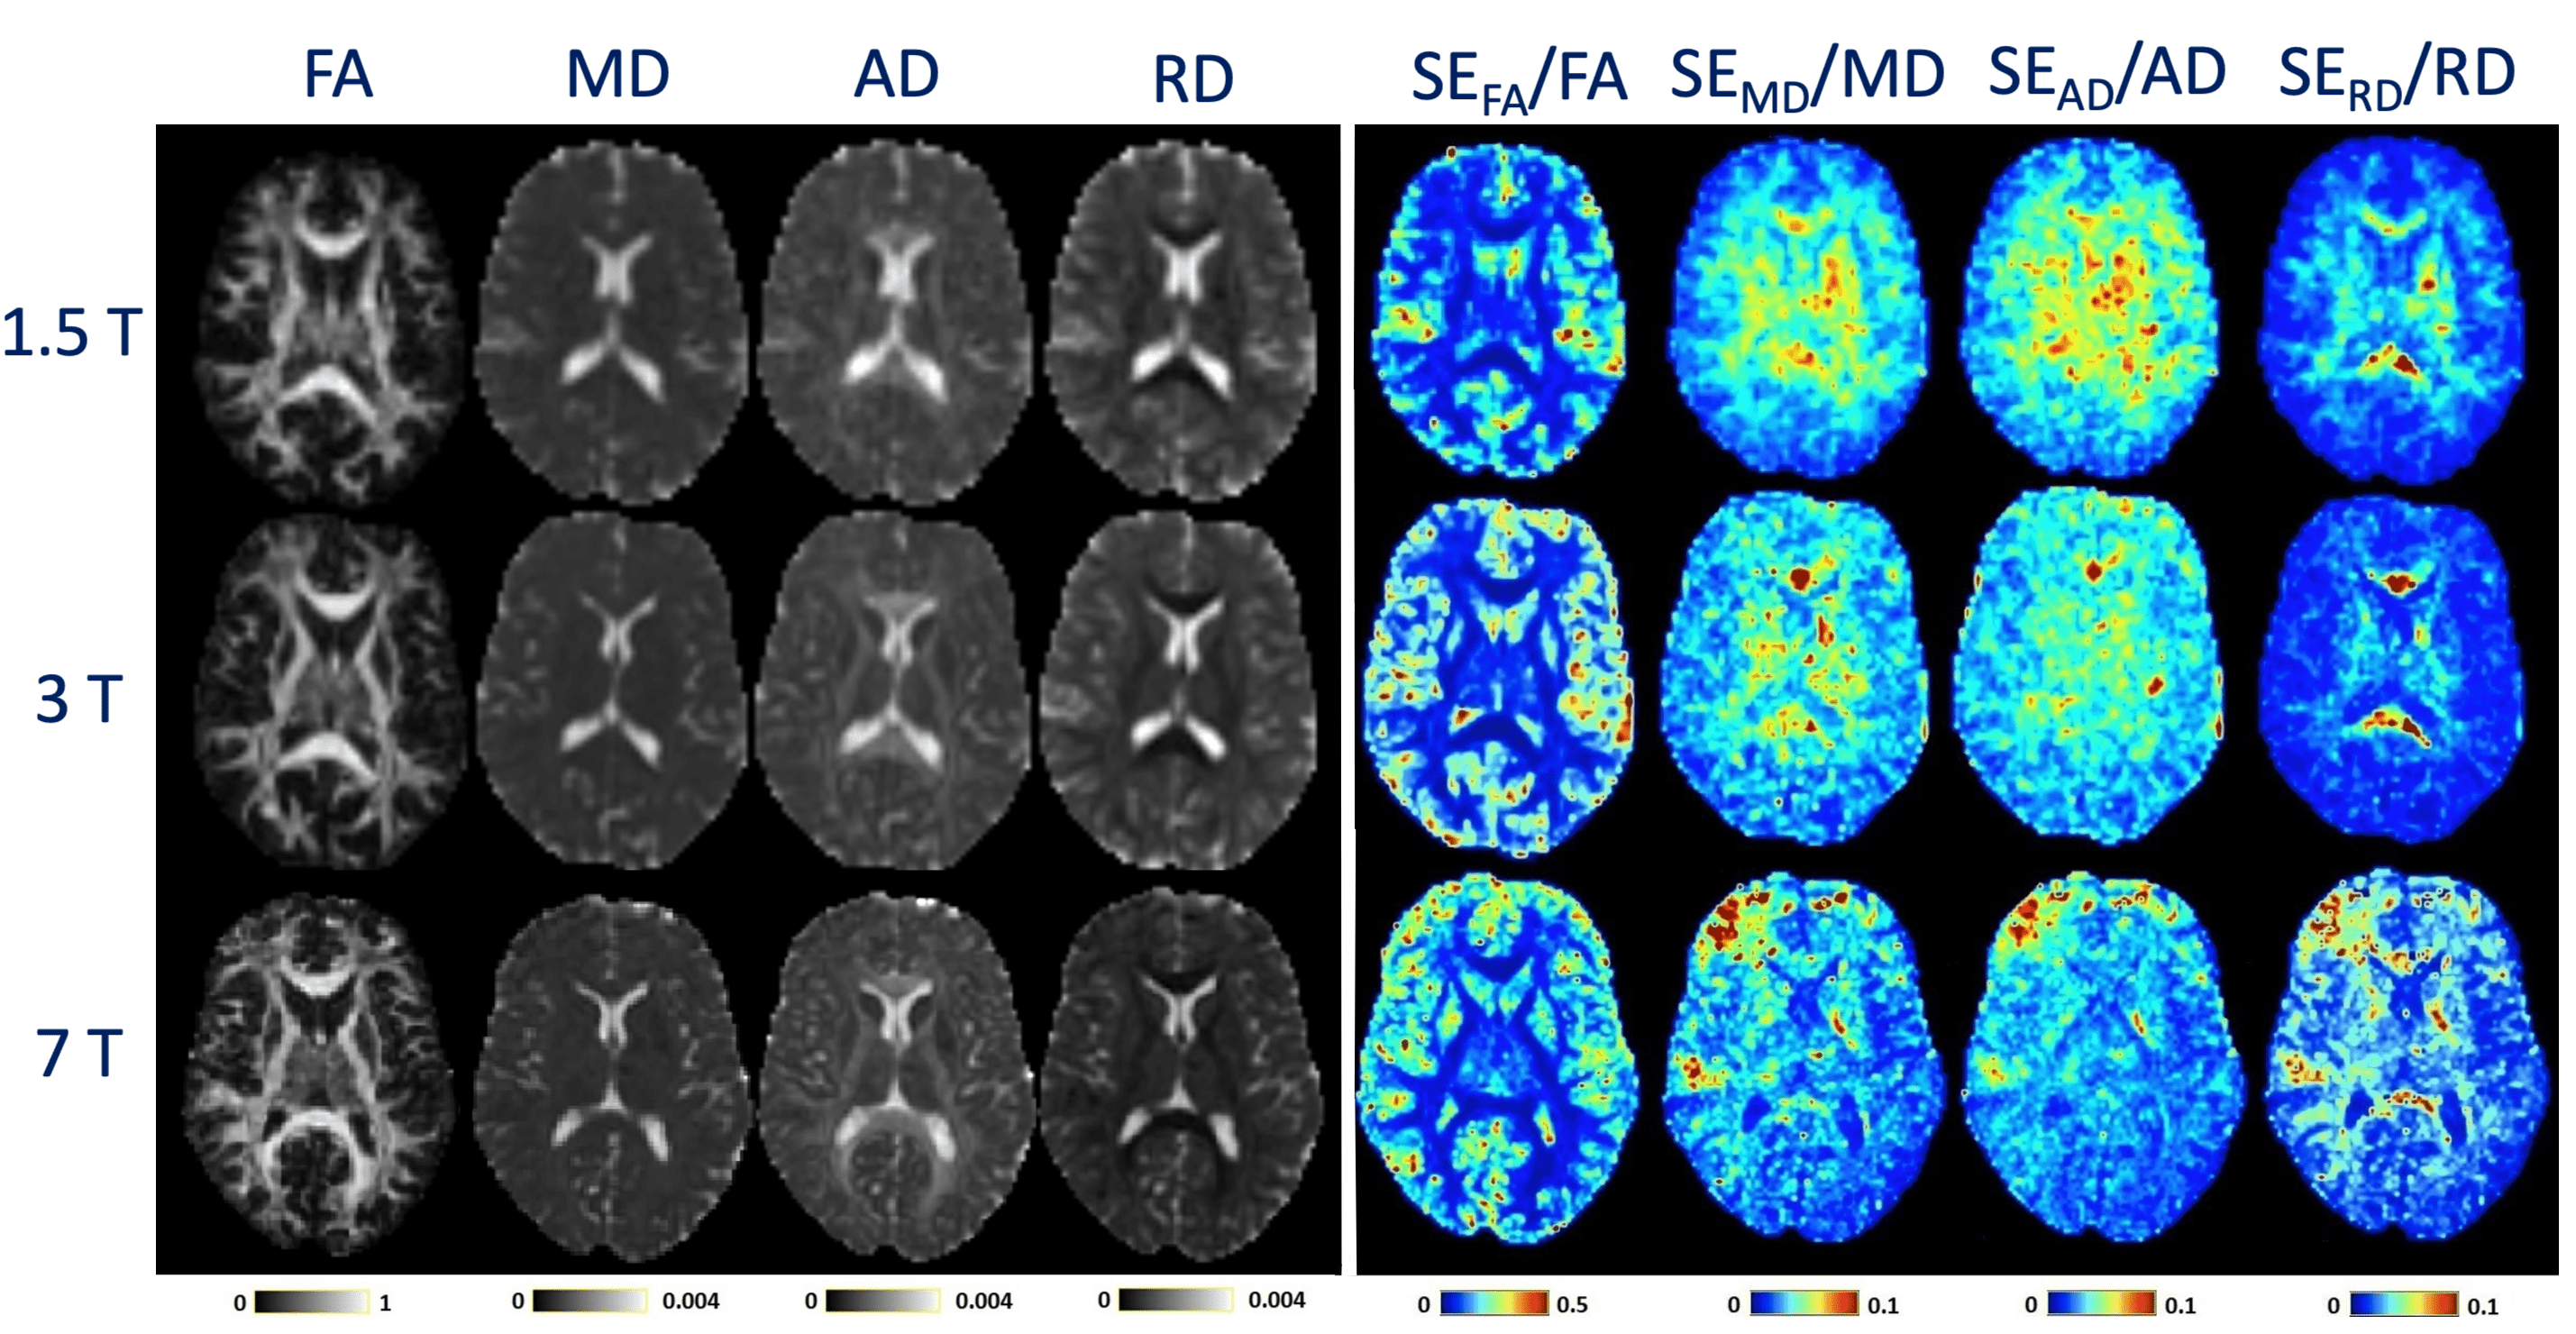
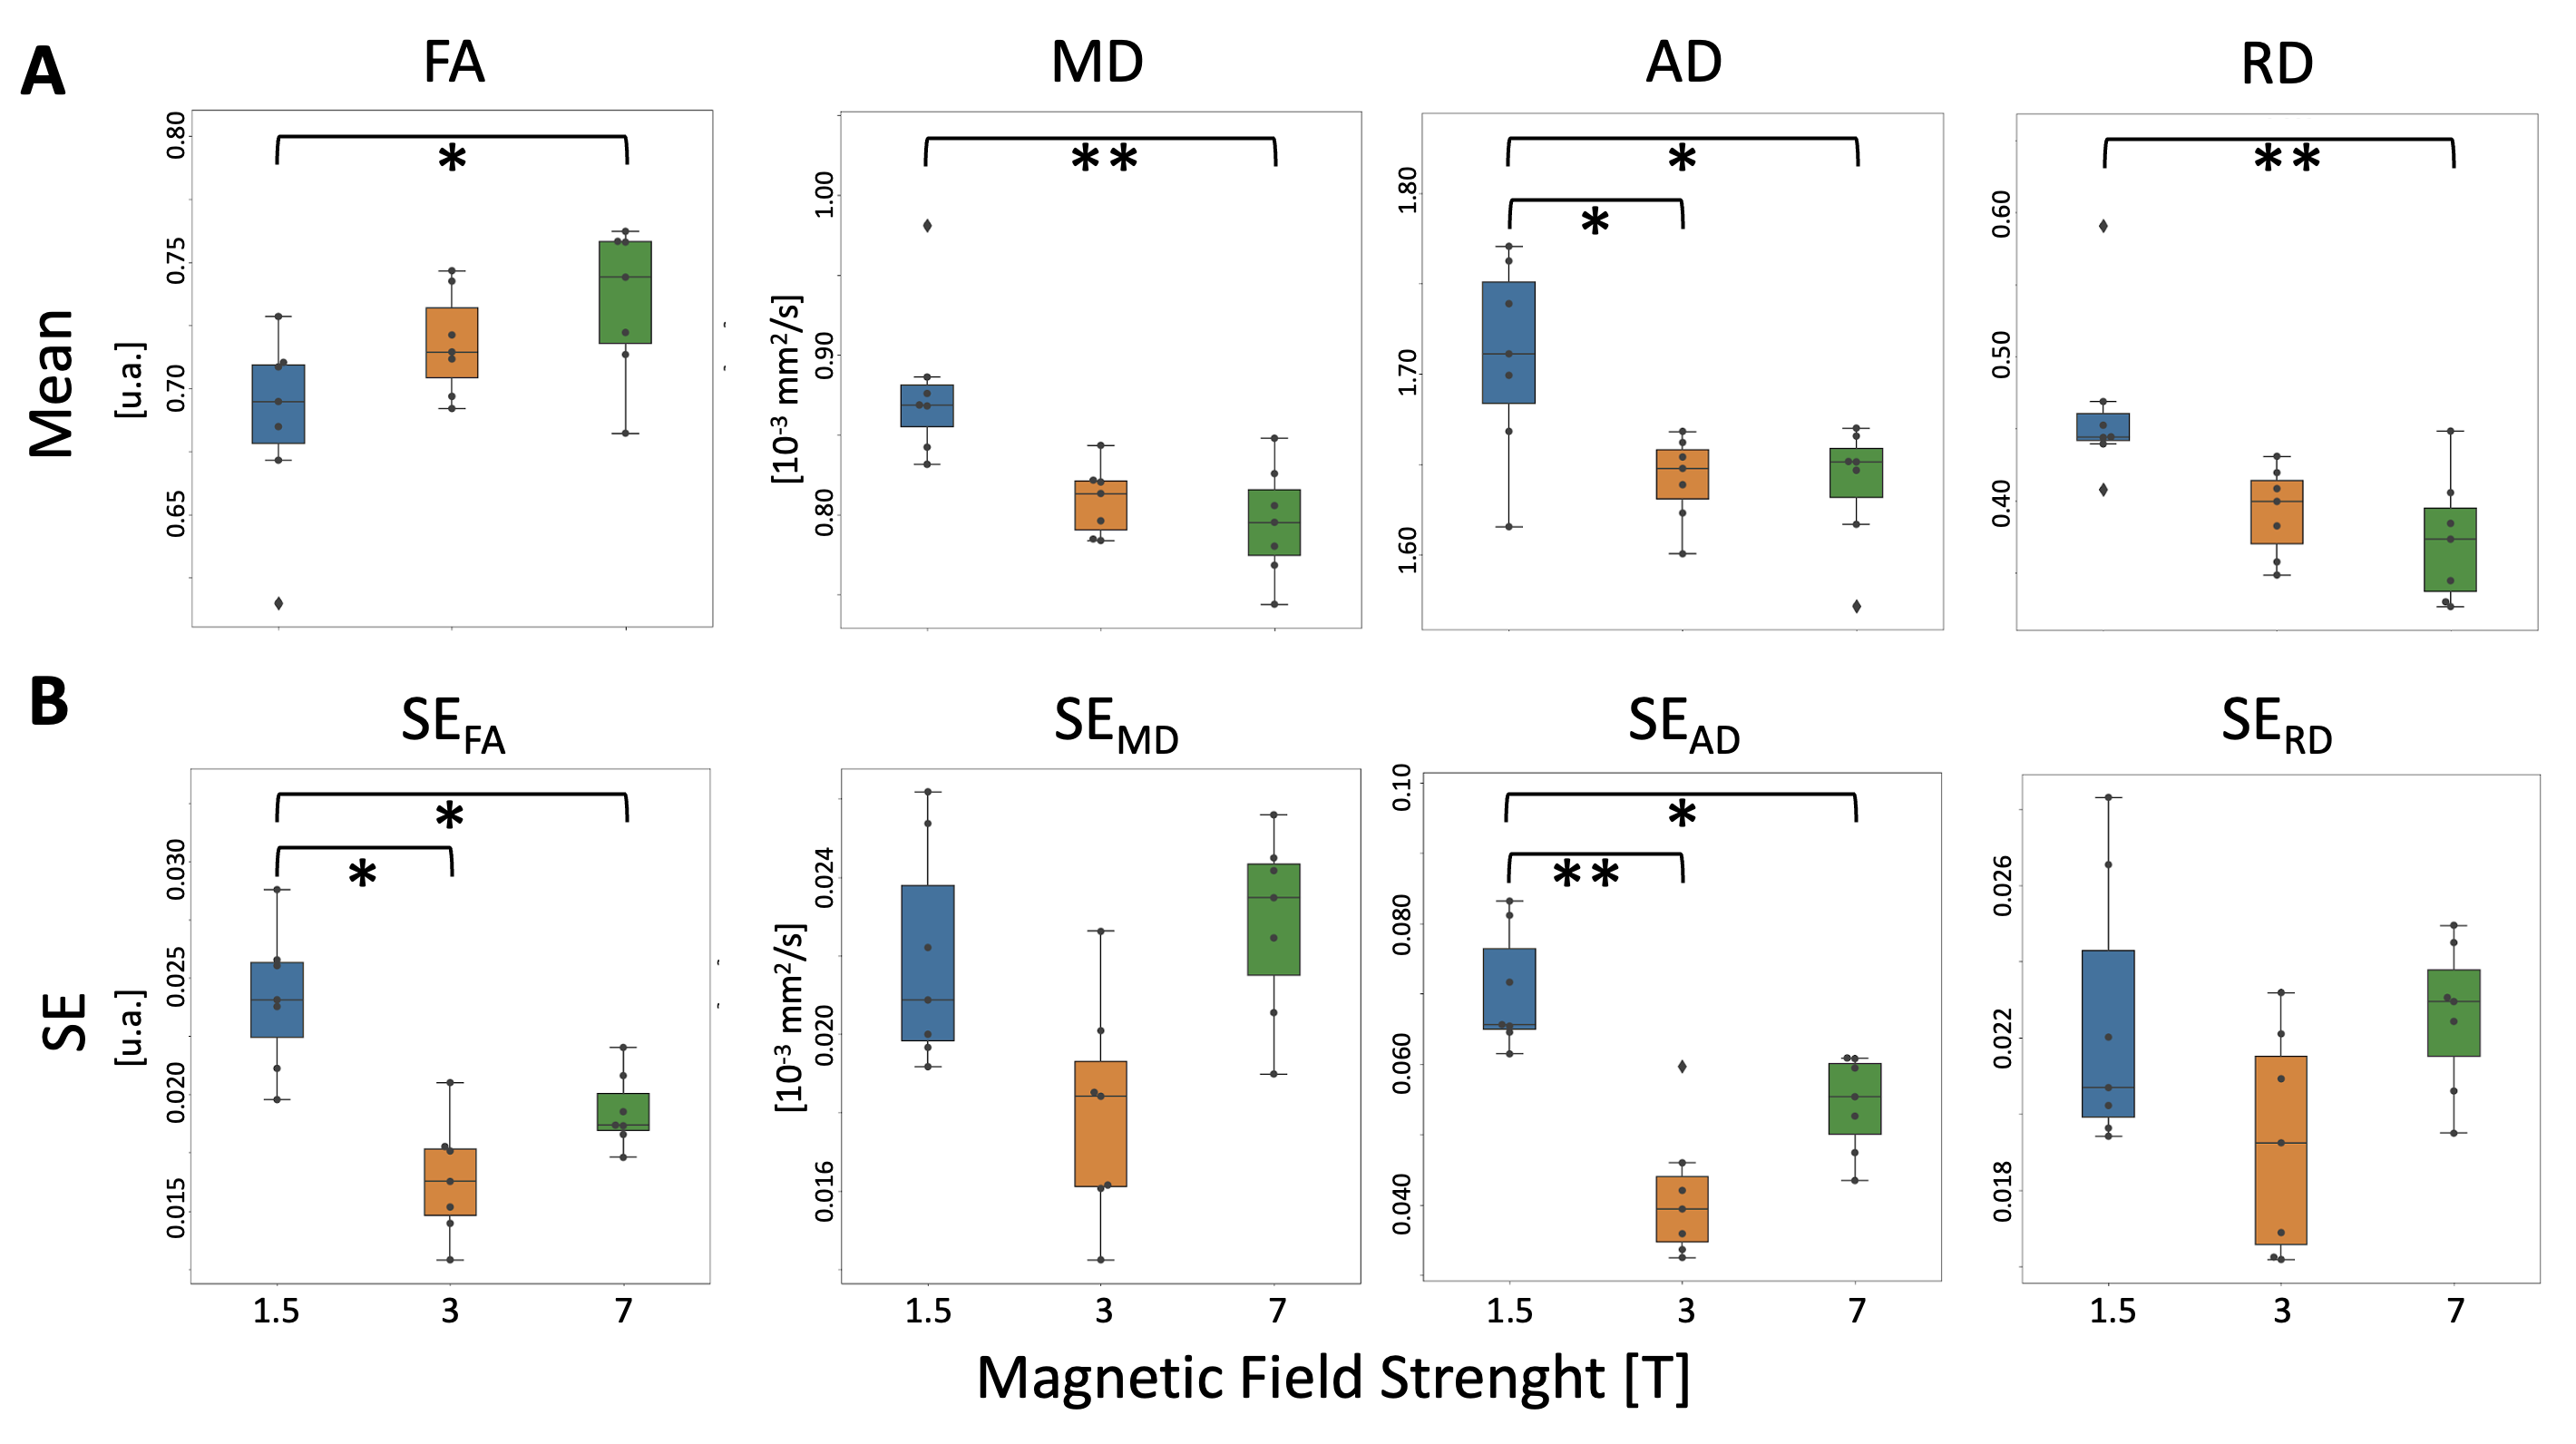
Maps of dMRI metrics and respective uncertainties obtained at different field strengths are shown in Figure 3, while the results of the statistical comparison in CC are reported in Figure 4. No significant differences between 3T and 7T were found for any of the measurements. All diffusion metrics show significant differences between 1.5T and 7T. For AD, we also found a significant difference between 1.5T and 3T. Mean FA increased at higher magnetic field strength, while the other metrics exhibited an opposing trend.Uncertainty in FA and AD was significantly higher at 1.5T compared to other field strengths, with no significant differences between 3T and 7T.
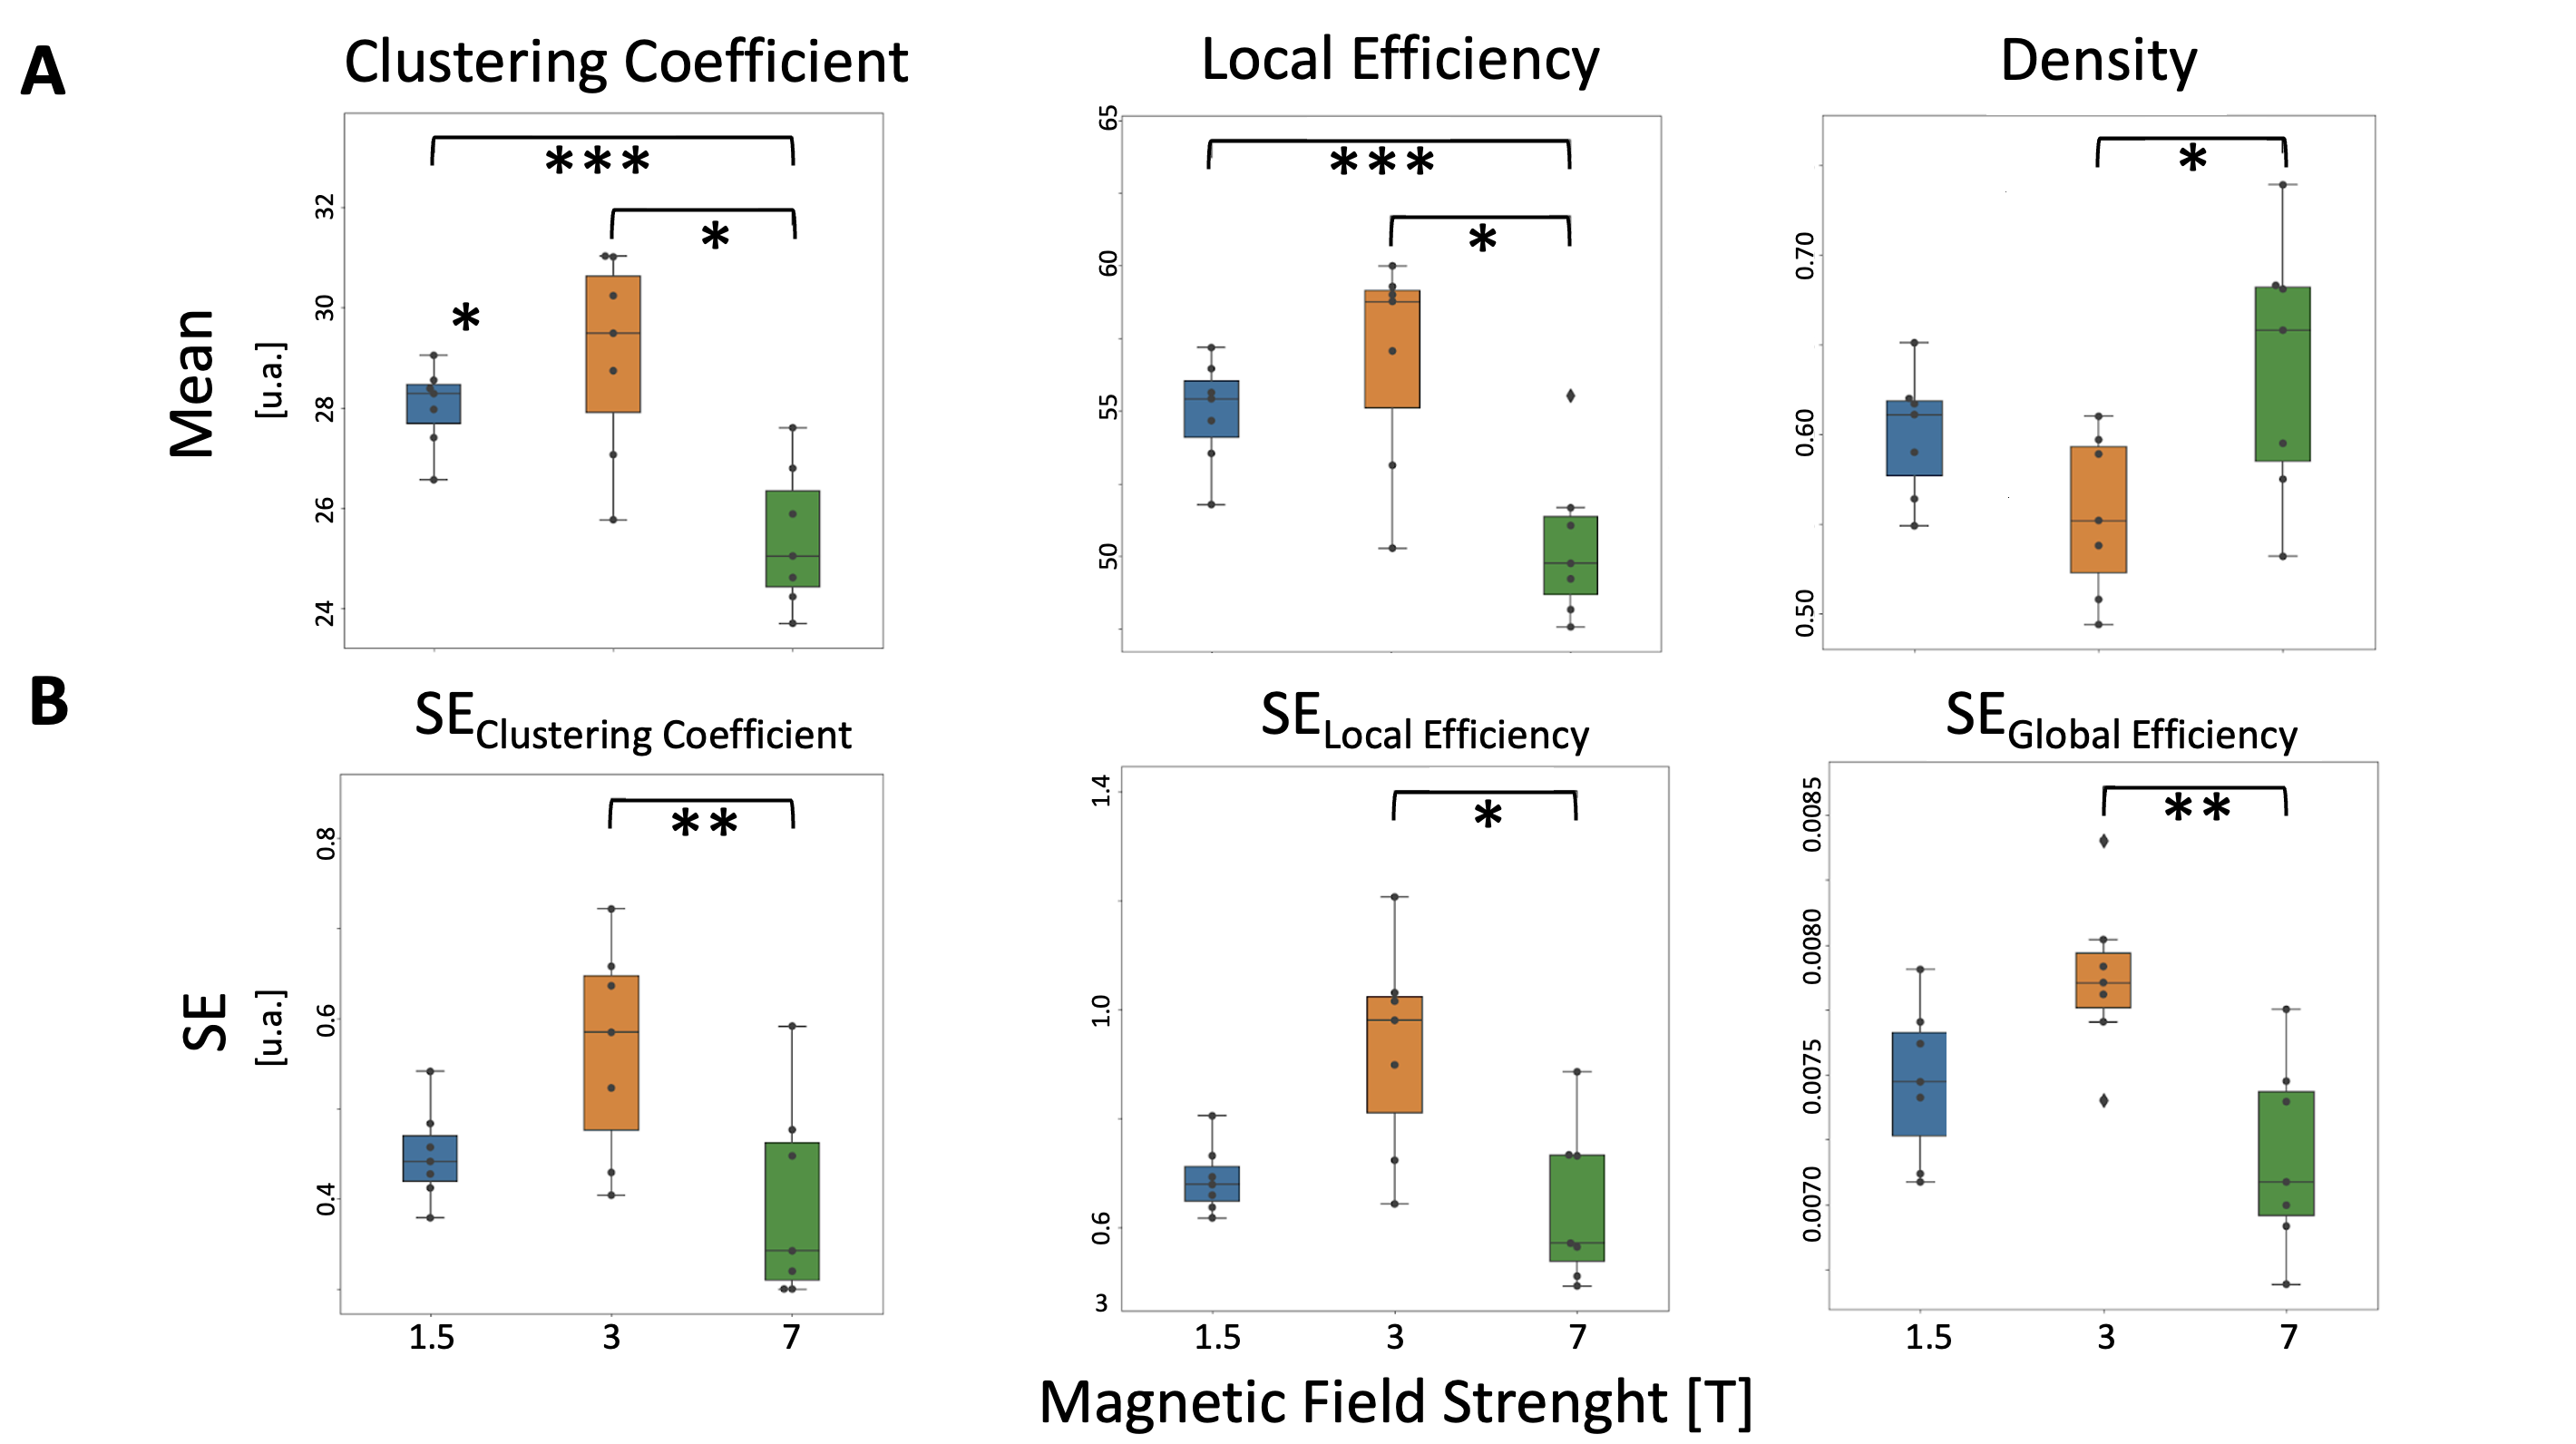
Figure 5 shows the boxplots of the graph measures and associated uncertainties, resulting significantly different among magnetic fields. Compared to lower fields, graph measures at 7T present lower values for local measures (Local Efficiency and Clustering Coefficient), and higher values for global measures (Density). Additionally, the uncertainty of clustering coefficient, local efficiency, and global efficiency measures was significantly lower at 7T compared to 3T, indicating more reliable results at higher magnetic field strength.
Discussion
The lack of differences in diffusion metrics between 3T and 7T validates the measures and indicates that optimized protocols for both field strengths can produce reliable data. In contrast, significant differences at 1.5T suggested lower data quality, likely due to spatial resolution limitations and potential bias from PVE. Uncertainty values did not decrease with higher magnetic field strength, differing from previous research9, emphasizing the importance of optimized protocols for each field.The findings on graph measures suggest that dMRI at 7T can depict greater structural connectivity complexity, likely due to increased spatial resolution and sensitivity. In fact, the higher tract density and lower local efficiency and clustering coefficient at 7T suggest the potential for revealing new structural connections.
Conclusion
We employed residual and wild bootstrap methods to assess the uncertainty in dMRI measurements and to compare dMRI measures themselves with relative uncertainties at different magnetic fields. The result showed the potential of 7T to detect more connections compared to clinical fields, with comparable or lower levels of uncertainty on graph theory measures.Acknowledgements
No acknowledgement found.References
1. Chung S, Lu Y, Henry RG. Comparison of bootstrap approaches for estimation of uncertainties of DTI parameters. NeuroImage. 2006;33: 531–541. doi:10.1016/j.neuroimage.2006.07.001
2. Whitcher B, Tuch DS, Wisco JJ, Sorensen AG, Wang L. Using the wild bootstrap to quantify uncertainty in diffusion tensor imaging. Hum Brain Mapp. 2008;29: 346–362. doi:10.1002/hbm.20395
3. Roine T, Jeurissen B, Perrone D, Aelterman J, Philips W, Sijbers J, et al. Reproducibility and intercorrelation of graph theoretical measures in structural brain connectivity networks. Med Image Anal. 2019;52: 56–67. doi:10.1016/j.media.2018.10.009
4. Tournier JD, Smith R, Raffelt D, et al. MRtrix3: A fast, flexible and open software framework for medical image processing and visualisation. Neuroimage. 2019;202:116137. doi:10.1016/j.neuroimage.2019.116137
5. Fischl B, van der Kouwe A, Destrieux C, et al. Automatically parcellating the human cerebral cortex. Cereb Cortex. 2004;14(1):11-22. doi:10.1093/cercor/bhg087
6. Rubinov M, Sporns O. Complex network measures of brain connectivity: uses and interpretations. Neuroimage. 2010;52(3):1059-1069. doi:10.1016/j.neuroimage.2009.10.003
7. Garyfallidis E, Brett M, Amirbekian B, et al. Dipy, a library for the analysis of diffusion MRI data. Front Neuroinform. 2014;8:8. Published 2014 Feb 21. doi:10.3389/fninf.2014.00008
8. Hammers A, Allom R, Koepp MJ, Free SL, Myers R, Lemieux L, et al. Three-dimensional maximum probability atlas of the human brain, with particular reference to the temporal lobe. Hum Brain Mapp. 2003;19: 224–247. doi:10.1002/hbm.10123
9. Polders DL, Leemans A, Hendrikse J, Donahue MJ, Luijten PR, Hoogduin JM. Signal to noise ratio and uncertainty in diffusion tensor imaging at 1.5, 3.0, and 7.0 Tesla. J Magn Reson Imaging. 2011;33: 1456–1463. doi:10.1002/jmri.22554Figures