2146
Structural Volumetric and Periodic Table DTI Patterns in Complex Normal Pressure Hydrocephalus – Towards Principles of a Translational Taxonomy1Neurosurgery, NNI, Singapore, Singapore, 2Duke-NUS medical school, Singapore, Singapore, 3Yong Loo Lin School of Medicine, National University of Singapore, Singapore, Singapore
Synopsis
Keywords: Diffusion Analysis & Visualization, Diffusion Tensor Imaging, structural volumes
Motivation: The Periodic Table of DTI Elements organizes neural tract patterns by their diffusivity and neural properties but mainly describes white matter injury.
Goal(s): Our goal was to expand the utility of this methodology by interrogating other subcortical and cortical structures of interest and comparing them to brain metrics in controls derived from an open-access dataset.
Approach: We examined brain volumes and DTI profiles in Complex Normal Pressure Hydrocephalus (CoNPH) vs. healthy controls from ADNI.
Results: Lateral ventricular volumes were significantly higher but most other volumes significantly lower in CoNPH vs. controls. Most DTI metrics (supratentorial and infratentorial) were significantly higher in CoNPH.
Impact: The Periodic Table of DTI Elements can demonstrate white matter and cortical injury and alterations of grey matter structures. The strategy can be used to compare cohorts with controls-in-common from an open-access dataset for wider community use.
Introduction
We have previously proposed a novel strategy – a Periodic Table of DTI Elements; an originally-derived taxonomic framework to describe white matter tracts by their diffusivity and neural properties and shown its relevance to cohorts of Classic Normal Pressure Hydrocephalus (ClNPH) vs. comparator cohorts of mild traumatic brain injury (TBI) and Alzheimer’s disease (AD).[1] We aimed to – i) examine patterns of tissue distortion in CoNPH vs. healthy controls by comparing differences in brain volumes and DTI profiles, ii) expand the application of the periodic table of DTI elements to include other cortical and subcortical regions-of-interest (ROIs) and iii) provide baseline values in comparison to healthy controls derived from the ADNI project.Methods
SubjectsThe CoNPH patient group comprised 12 patients (10 males and 2 females; mean age 71.3 ± 7.57 years) recruited from the NPH Programme at the National Neuroscience Institute, Singapore (2016-2017). 45 cognitively normal controls from the ADNI study were included (21 males and 24 females; mean age 72.8 ± 6.09 years).
MRI acquisition
MR imaging data for CoNPH subjects were acquired with a 3.0-T MR scanner (Ingenia, Philips Medical Systems, Best, the Netherlands), including 3D T1, T2, FLAIR, and DTI sequences. DTI was obtained with a slice thickness of 2.3 mm, images acquired in 20 gradient directions with parameters: b = 0 and 1,000 s/mm2, TR = 7,274 ms; TE = 80 ms; FOV 220 x 220 mm; and matrix = 96 x 96, resulting in a voxel size of 2.3 x 2.3 x 2.3 mm, with SENSE factor of 2.5. The ADNI scanning protocol is published elsewhere.[2]
Imaging analysis
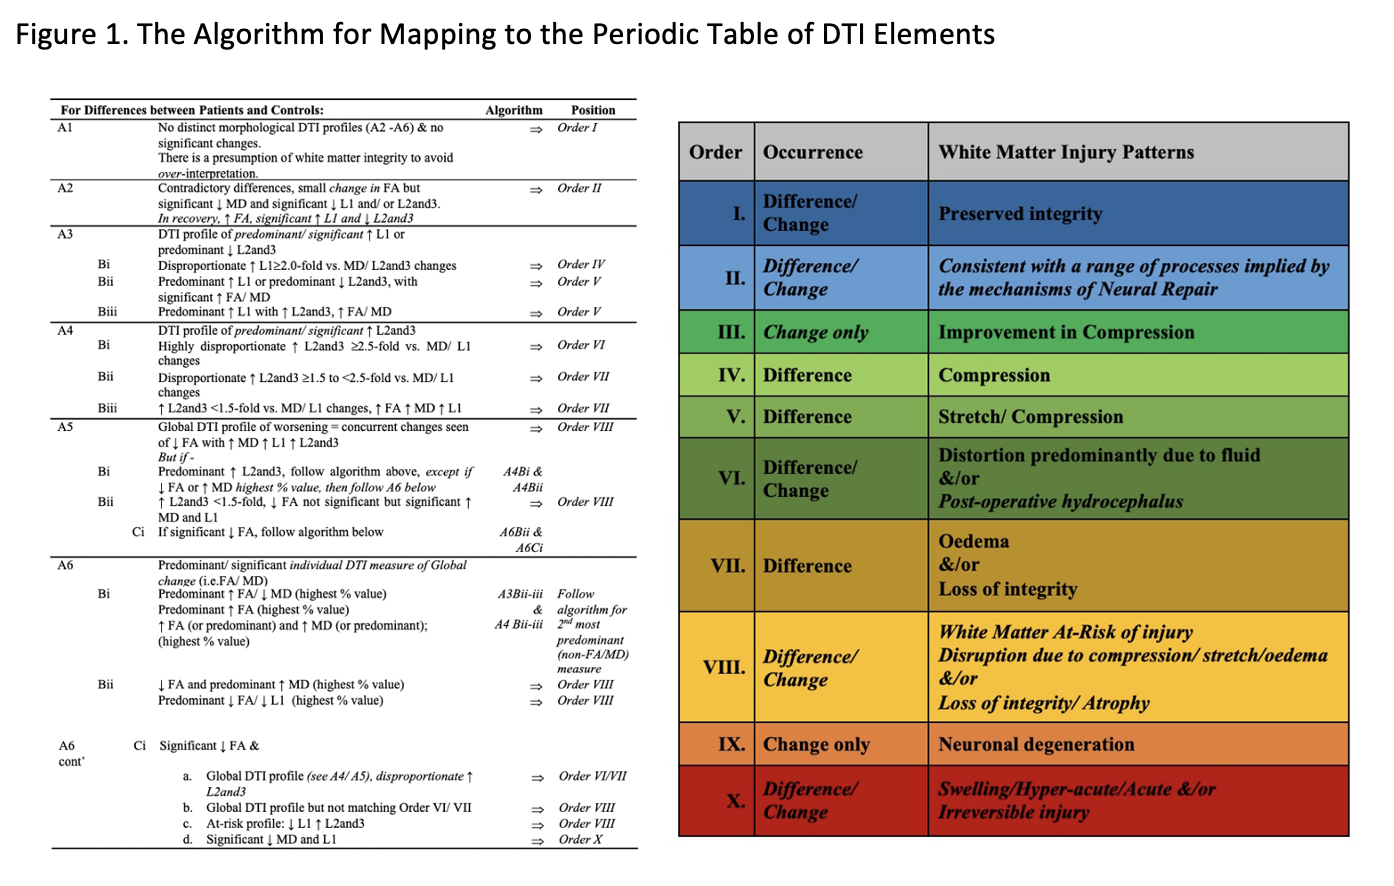
We performed anatomical preprocessing of deidentified T1-weighted images and reoriented them to match the MNI152 template using the FMRIB Software Library (FSL).[3-5] Linearly aligned images were post-processed using Freesurfer,[6] with segmentation by the Destrieux atlas. DTI Data was processed using pipelines via the brainlife.io secure cloud platform,[7] using MRTrix3, [8] ACT [9] and cortex tissue mapping as per Fukutomi et al..[10] We mapped differences in DTI profiles (FA, MD, L1 and L2and3) to the Periodic Table of DTI Elements, refined for this iteration (Figure 1).
Statistics
Statistical analyses were conducted using SPSS Statistics Version 23.0 (IBMCorp., Armonk, NY, USA). Data is reported as mean ± standard deviation, unless otherwise stated. DTI metrics and volumes were compared using the Mann-Whitney U test and corrected for multiple comparisons with a false discovery rate (FDR) of 0.05. P values reported are unadjusted; after controlling for FDR, p is significant at ≤0.033.
Results
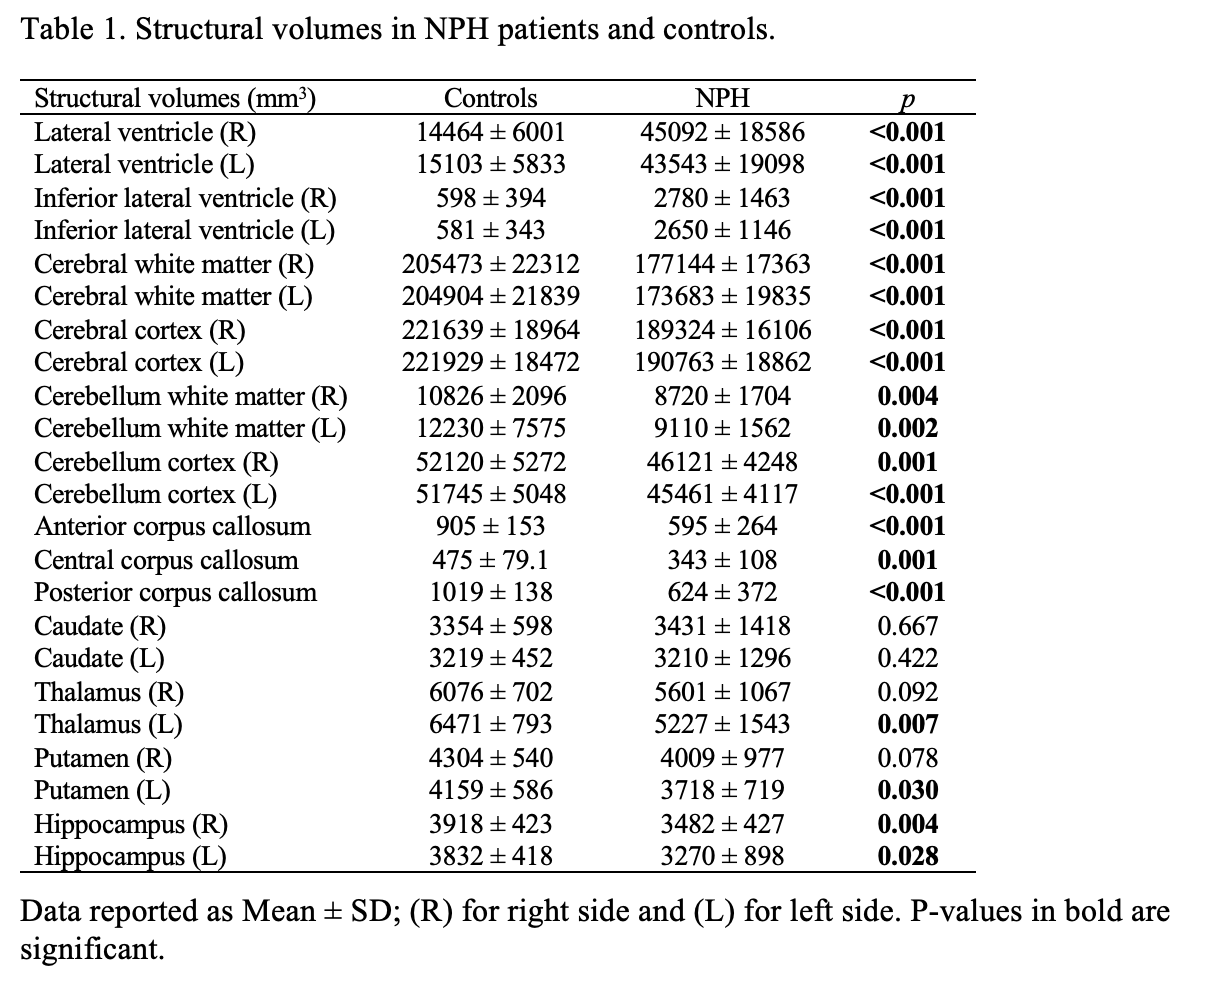
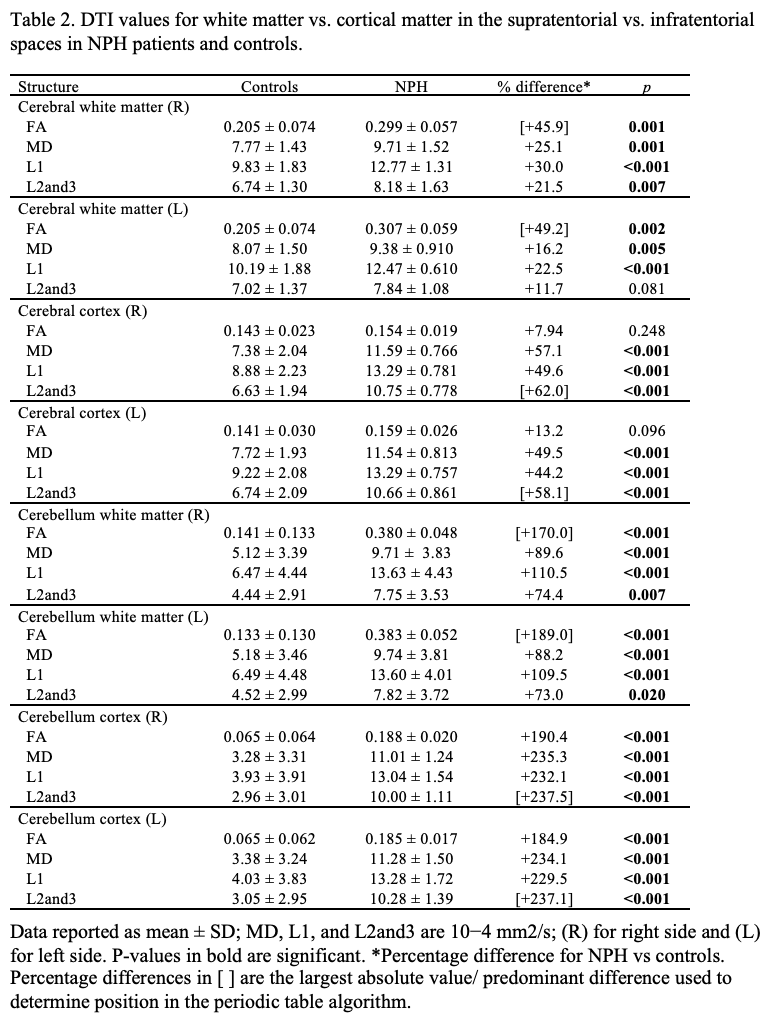
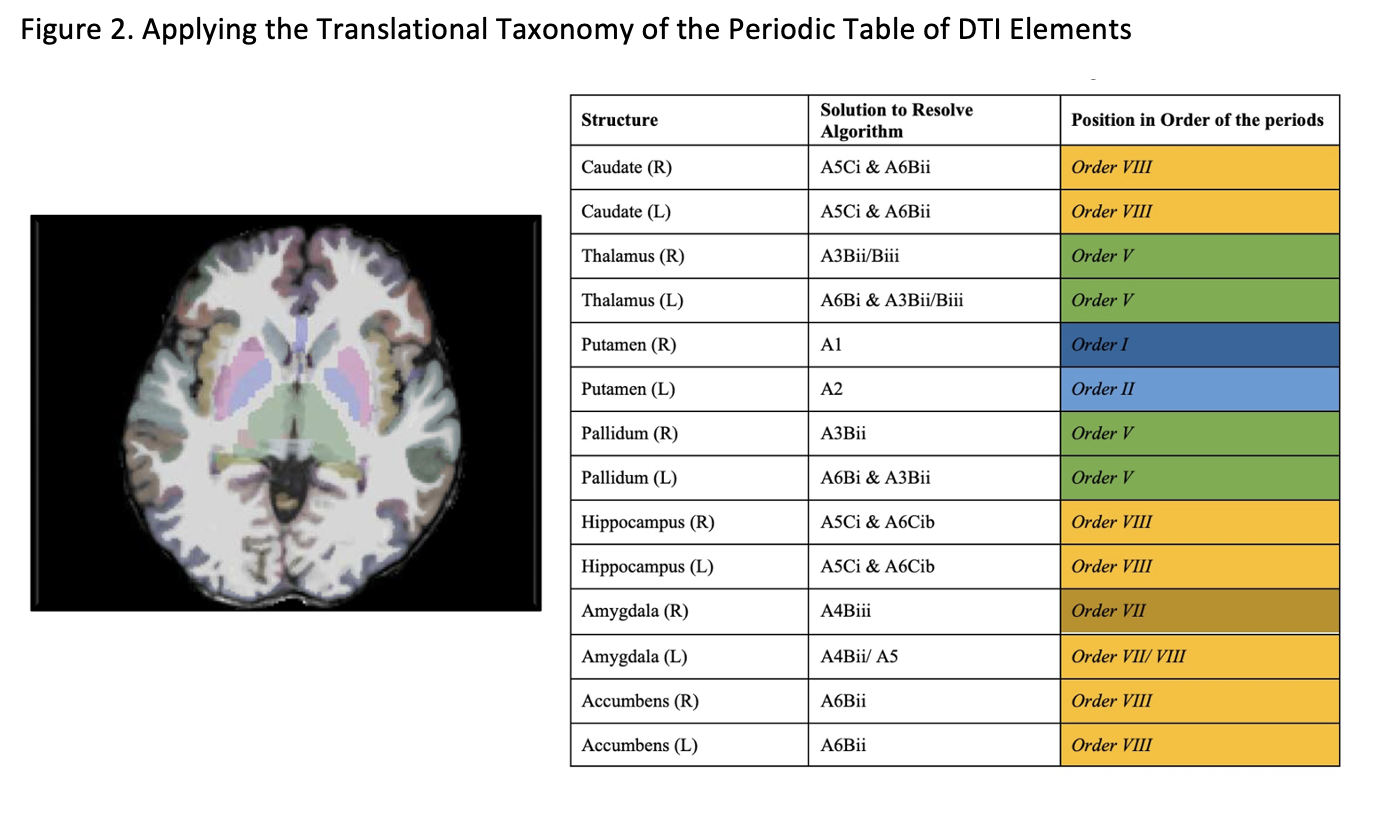
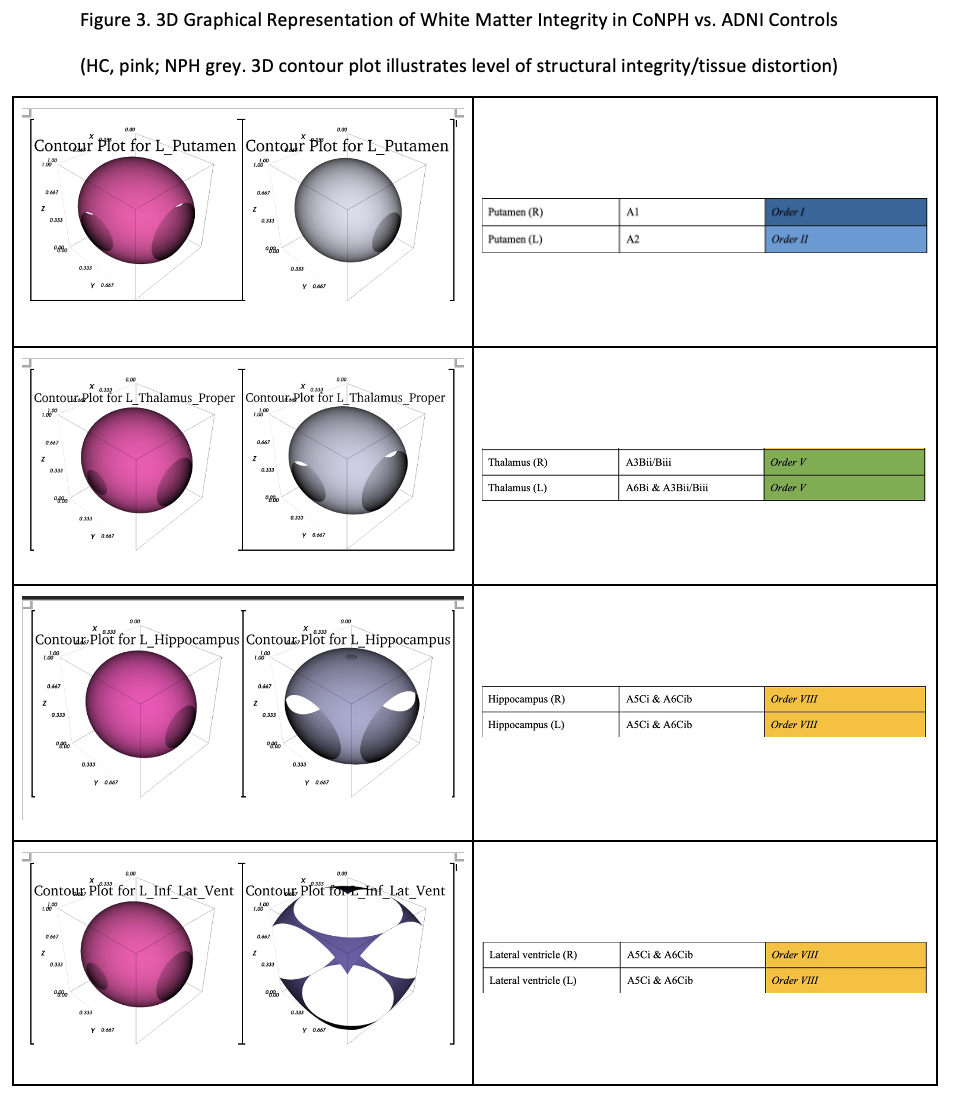
Mean structural volumes for NPH patients and controls are shown in Table 1. In the lateral ventricles, structural volumes were significantly higher in CoNPH and more than 1.5 times of that compared to controls (p<0.001 for right and left lateral ventricles and inferior lateral ventricles). Volumes of most other structures tested were significantly lower in CoNPH compared to healthy controls, except for the right and left caudate, right thalamus, right putamen, and left accumbens (p<0.001 for right and left cerebral white matter and cortex; p≤0.004 for right and left cerebellum white matter and cortex; p≤0.001 for corpus callosum; p=0.007 for left thalamus; p=0.030 for left putamen; p=0.004 for right hippocampus and p=0.028 for left hippocampus). DTI metrics (FA, MD, L1, L2and3) across right and left sided supratentorial and infratentorial structures were significantly higher in CoNPH compared to controls, with the exception of FA in the right and left cerebral cortex and L2and3 in the left cerebral white matter (Table 2). The largest differences were in the cerebellum cortex, where FA, MD, L1, and L2and3 in CoNPH were 2 times that of controls (p<0.001 for all). The Periodic Table of DTI Elements confirmed that significant patterns of injury on DTI profiles could be mapped to their respective Orders by successfully resolving these patterns via the algorithmic solutions declared a priori (Figures 1-3).Conclusions
In this iteration of the Periodic Table of DTI elements, we examined patterns of tissue distortion in CoNPH and validated the strategy against an open-access dataset of healthy control subjects, to expand its accessibility to a larger community of users. We found widespread and significant reductions in subcortical deep grey matter structures in CoNPH in comparison to healthy controls. The use of the algorithm of the Periodic Table of DTI Elements allowed for greater consistency in the interpretation of DTI results by resolving them to specific Orders of reversibility of brain injury. Our aim is to provide a prototype that could be refined and improved for an approach towards the concept of a “translational taxonomy”.Acknowledgements
Data used in preparation of this article were obtained from the Alzheimer’s Disease Neuroimaging Initiative (ADNI) database (adni.loni.usc.edu). As such, the investigators within the ADNI contributed to the design and implementation of ADNI and/or provided data but did not participate in analysis or writing of this report. A complete listing of ADNI investigators can be found at: http://adni.loni.usc.edu/wp-content/uploads/how_to_apply/ADNI_Acknowledgement_List.pdfReferences
1. Keong, N.C., Lock, C., Soon, S., Hernowo, A.T., Czosnyka, Z., Czosnyka, M., et al. (2022). Diffusion tensor imaging profiles can distinguish diffusivity and neural properties of white matter injury in hydrocephalus vs. non-hydrocephalus using a strategy of a periodic table of DTI elements. Front Neurol. 13, 868026. doi: 10.3389/fneur.2022.868026
2. Nir, T.M., Jahanshad, N., Villalon-Reina, J.E., Toga, A.W., Jack, C.R., Weiner, M.W., et al. (2013). Effectiveness of regional DTI measures in distinguishing Alzheimer’s disease, MCI, and normal aging. Neuroimage Clin. 3, 180– 95. doi: 10.1016/j.nicl.2013.07.006
3. Jenkinson, M., Beckmann, C.F., Behrens, T.E., Woolrich, M.W., and Smith, S.M. (2012). FSL. Neuroimage. 62, 782-90. doi: 10.1016/j.neuroimage.2011.09.015
4. Smith, S.M., Jenkinson, M., Woolrich, M.W., Beckmann, C.F., Behrens, T.E., Johansen-Berg, H., et al. (2004). Advances in functional and structural MR image analysis and implementation as FSL. Neuroimage. 23(Suppl 1), S208–S219. doi: 10.1016/j.neuroimage.2004.07.051
5. Woolrich, M.W., Jbabdi, S., Patenaude, B., Chappell, M., Makni, S., Behrens, C., et al. (2009). Bayesian analysis of neuroimaging data in FSL. Neuroimage 45, S173-86. doi: 10.1016/j.neuroimage.2008.10.055
6. Dale, A.M., Fischl, B., and Sereno, M.I. (1999). Cortical surface-based analysis: I. Segmentation and surface reconstruction. Neuroimage. 9, 179-194.
7. Caron, B., Stuck, R., McPherson, B., Bullock, D., Kitchell, L., Faskowitz, J., et al. (2021). Collegiate athlete brain data for white matter mapping and network neuroscience. Sci Data. 8, 56. doi: 10.1038/s41597-021-00823-z
8. Tournier, J.D., Smith, R., Raffelt, D., Tabbara, R., Dhollander, T., Pietsch, M., et al. (2019). MRtrix3: A fast, flexible and open software framework for medical image processing and visualisation. Neuroimage. 202, 116137. https://doi.org/10.1016/j.neuroimage.2019.116137
9. Smith, R.E., Tournier, J.D., Calamante, F., and Connelly, A. (2012). Anatomically-constrained tractography: improved diffusion MRI streamlines tractography through effective use of anatomical information. Neuroimage. 62(3), 1924-1938
10. Fukutomi, H., Glasser, M.F., Zhang, H., Autio, J.A., Coalson, T.S., Okada, T., et al. (2018). Neurite imaging reveals microstructural variations in human cerebral cortical gray matter. Neuroimage. 182, 488–499. doi: 10.1016/j.neuroimage.2018.02.017
Figures