2143
Diffusion-T2 relaxation correlation spectroscopic imaging at 3T versus 5T: in vivo human brain application
1Institute of Science and Technology for Brain-Inspired Intelligence, Fudan University, Shanghai, China, 2Central Research Institute, United Imaging Healthcare Group, ShangHai, China, 3Department of Neurology, Zhongshan Hospital, Fudan University, ShangHai, China, 4Human Phenome Institute, Fudan University, ShangHai, China
Synopsis
Keywords: Diffusion Analysis & Visualization, High-Field MRI, diffusion-relaxation correlation spectroscopic imaging,brain
Motivation: Motivated by the promise of higher SNR and gradient performance at ultra-high magnetic fields (5T), we conducted in-vivo experiments of diffusion-relaxation correlation spectroscopic imaging (DR-CSI) to tap into its prospects at 5T.
Goal(s): This study aims to assess the feasibility and performance of DR-CSI at 5T for brain tissue measurement and to explore its 5T applications compared to 3T.
Approach: We have acquired two-dimensional diffusion-relaxation data and resolved the 2D spectra and spatial maps at both field strengths for comparative analysis.
Results: Results at 5T showed clearer differentiation of brain tissues and improved sensitivity to deep brain nuclei.
Impact: At 5T, diffusion-relaxation correlation spectroscopic imaging excels in estimating deep brain nuclei, promising for future applications in infarcts and neurodegenerative conditions.
Introduction
Diffusion-relaxation encoding and spatial-spectral regularization can mitigate the ill-posedness of one-dimensional multiexponential modeling and the trade-off between signal-to-noise ratio (SNR) and spectral-spatial resolution. Previous in-vivo experiments were conducted at 3T1,2, but the sensitivity and potential of the diffusion-relaxation correlation spectroscopic imaging (DR-CSI) approach for in-vivo brain tissue measurement at higher field strength have not been assessed. The uMR Jupiter 5T MRI system offers important technical advantages for DR-CSI, including an ultra-high field strength improving SNR, as well as the high gradient performance (120 $$$mT/m$$$ & 200 $$$T/m/s$$$) enabling smaller TE. Higher gradient amplitudes shorten effective diffusion time, strengthen diffusion encoding and also boosts sensitivity to microstructures3. This study aims to evaluate the feasibility of implementing DR-CSI at 5T and compare its performance with 3T.Methods
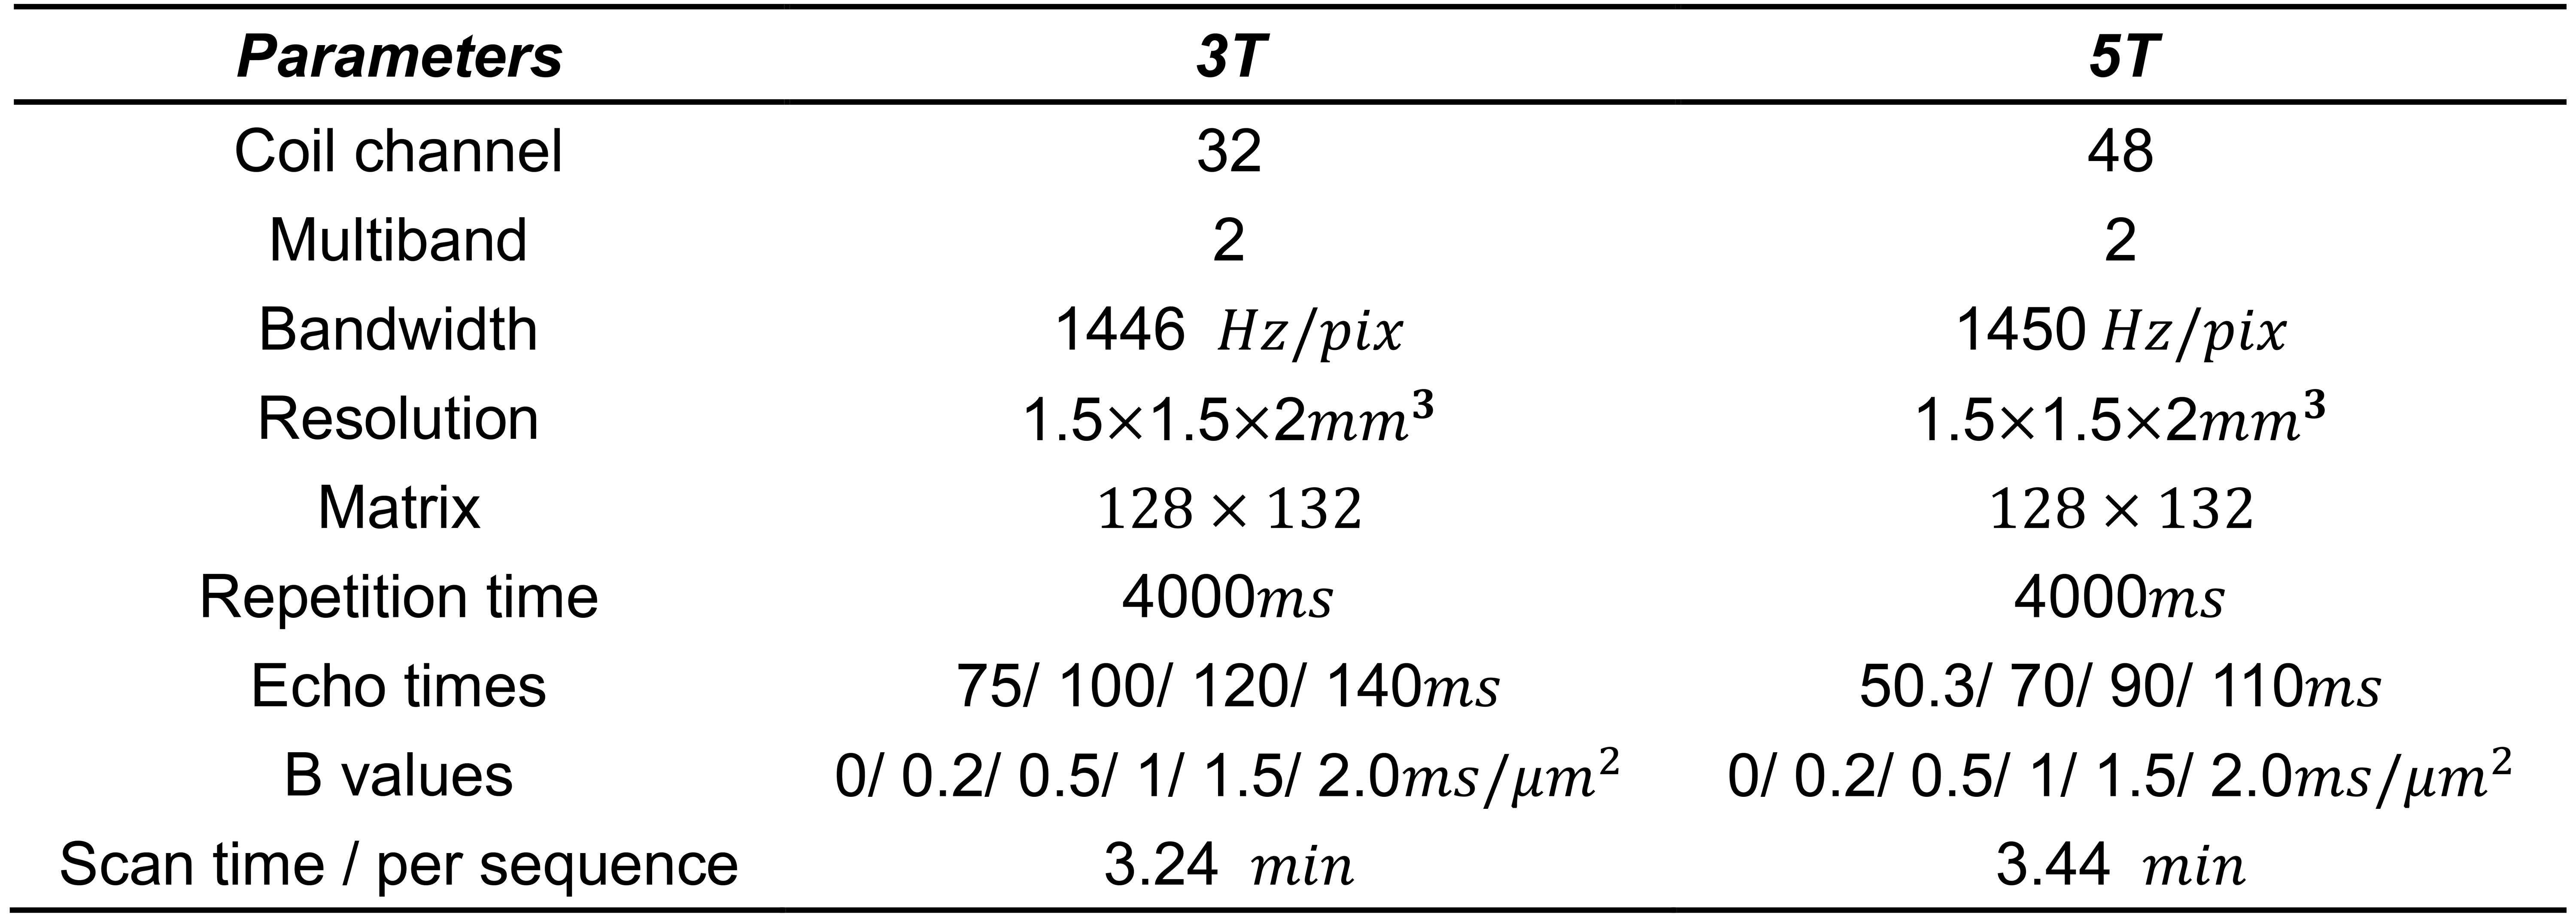
Six healthy subjects underwent MRI examinations on a 3T (Prisma, Siemens Healthcare, 80$$$mT/m$$$& 200$$$T/m/s$$$) and a 5T MR system (uMR Jupiter, United Imaging Healthcare). DR-CSI data were acquired using a single-shot spin-echo EPI sequence with a combination (P=24) of four echo times (TEs of 75, 100, 120, 140 ms at 3T, and 50.3, 70, 90, 110 $$$ms$$$ at 5T) and six b-values (0, 200, 800, 1000, 1500, 2000 $$$s/mm²$$$). The high field strength enables shorter TE at 5T for the same TR and maximum b-value, optimizing imaging protocols. Detailed information is provided in Table 1.All diffusion data underwent pre-processing steps including eddy current correction and skull stripping. The DR-CSI modeled the signal in each voxel with T2 and diffusion decays as Eq.11.
\begin{equation}
\begin{split}
m(x,y,b,TE) = \int_{}^{} \int_{}^{} f(x,y,D,T2)e^{-bd}e^{-TE/T2}\end{split}
\end{equation} (1)
Where $$$x,y$$$ is the coordinates and the optimization problem in Eq.2, was achieved using the ADMM algorithm4.
\begin{equation}
\begin{split}
{\bf F}=argmin||{\bf MT-KFT}||_{\bf F}^2+\lambda||{\bf FC^{H}}||_{\bf F}^2\end{split}\end{equation} (2)
\begin{equation}
\begin{split}
c=\begin{bmatrix}3 & -1 &-1 &-1 \\-1 & 3 &-1&-1\\-1&-1&3&-1\\=1&-1&-1&3 \end{bmatrix}, {\bf C}=\begin{bmatrix}c & 0 & ...&0\\0 & c&...&0\\0&0&...&0\\0&0&...&c \end{bmatrix}\end{split}\end{equation} (3)
where $$$M$$$ is the signal matrix, $$$T$$$ is the brain mask, and $$$K^{[P\times Q]}$$$ represents the dictionary values. In this work, 50 values of $$$D$$$ (ranging from 0.03-10$$$\mu m^2 /ms$$$, spaced logarithmically) and 50 values of $$$T2$$$ (ranging from 5-300$$$ms$$$, spaced logarithmically) were used, totaling $$$Q=2500$$$ dictionary elements. $$$\bf C$$$ is the spatial smoothing matrix. The ranges of $$$D$$$ and $$$T2$$$ of various brain tissues were derived from peaks of 2D spectra and averaged across six subjects. Spatial maps for the DR-CSI approach were obtained by spectrally integrating the spectral peaks and normalizing by the sum of the total spectra.
Results
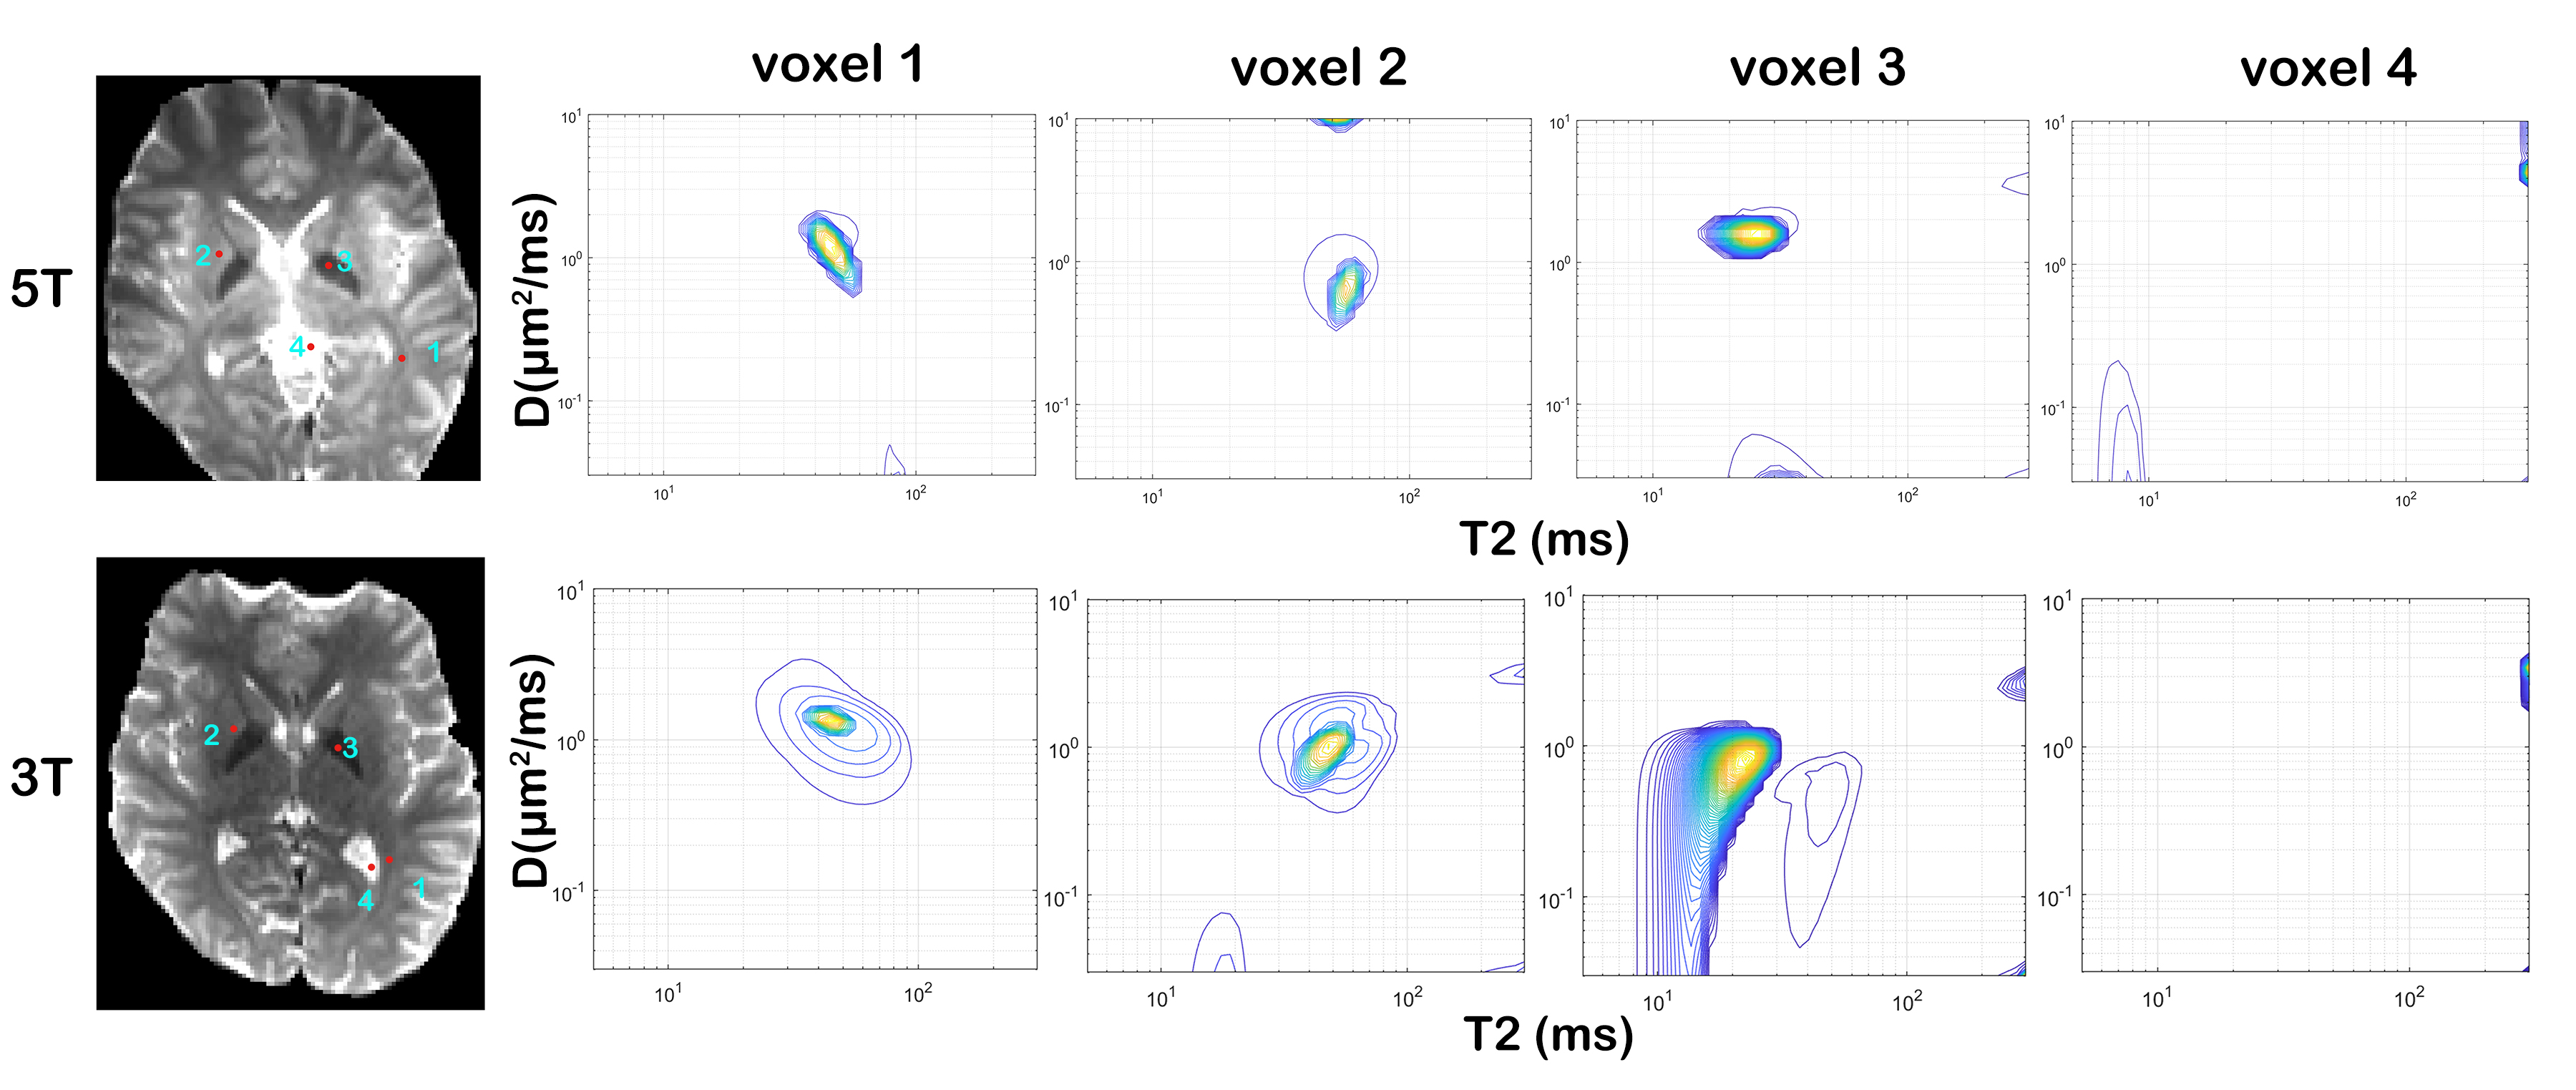
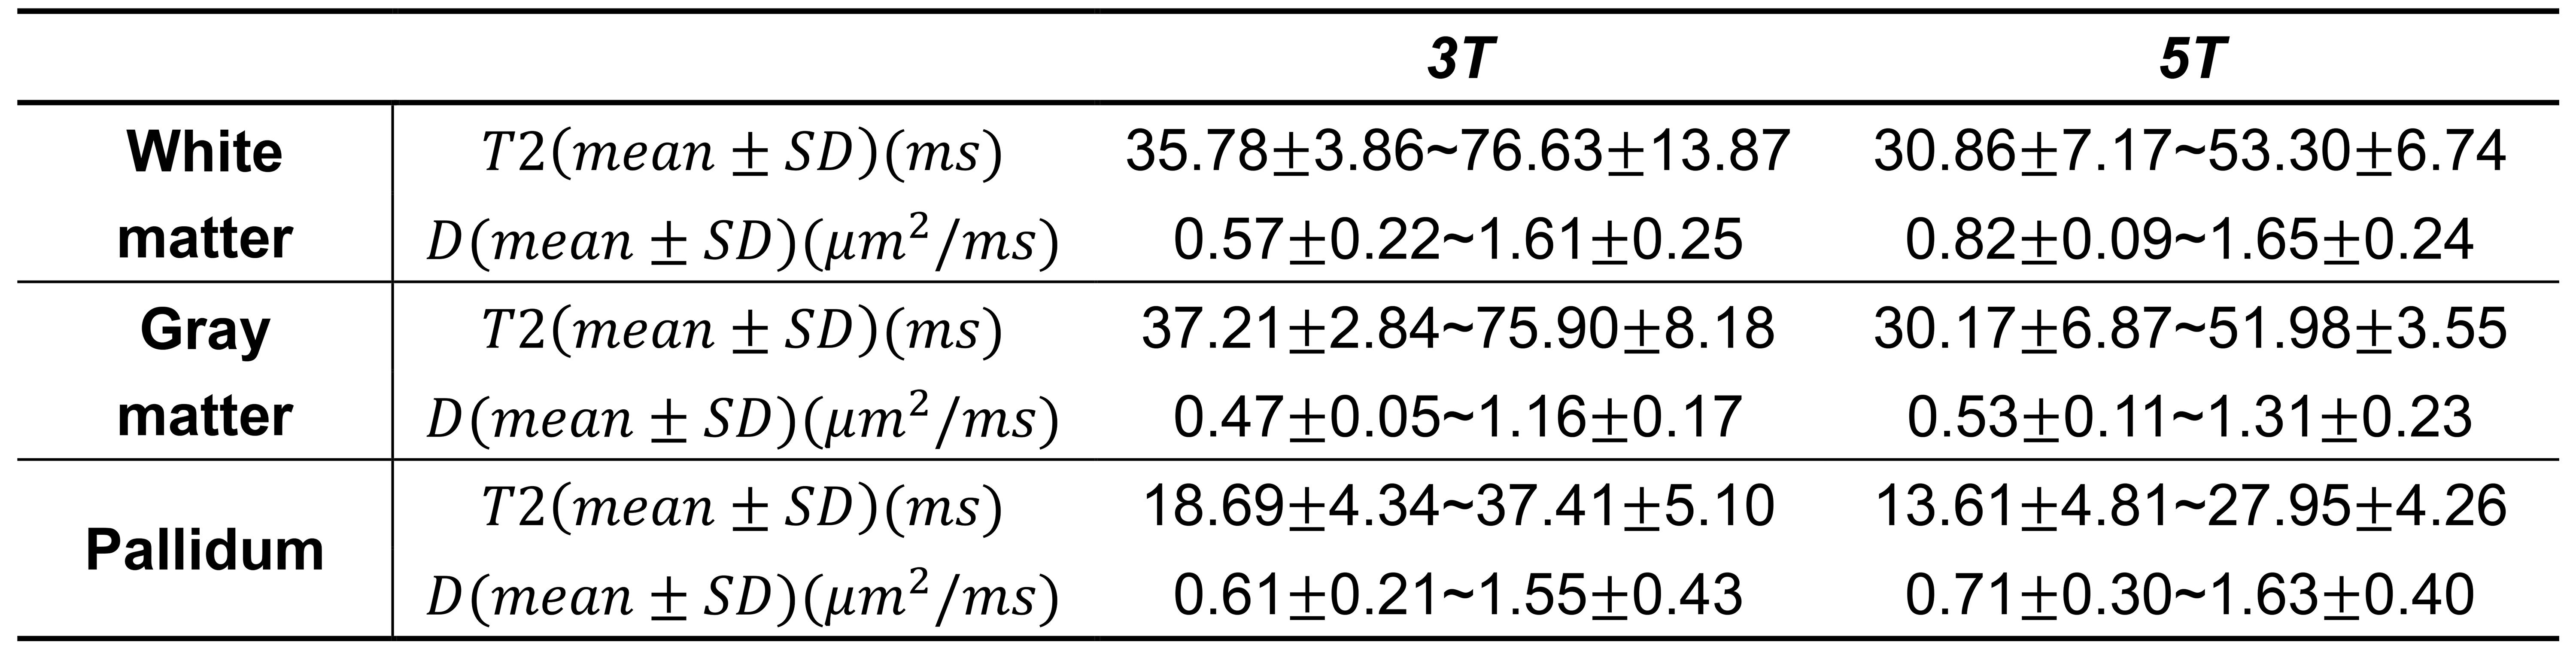
Figure 1 displays the two-dimensional spectral solutions for a single voxel. Voxels 1 to 4 represent white matter (WM), gray matter (GM), the globus pallidus, and cerebrospinal fluid (CSF), respectively. Compared to the concentrated distribution seen in the 2D spectra of 5T, the spectra of 3T exhibit some cross-contamination, particularly for voxel 3 (globus pallidus).Table 2 shows quantitative parameters (T2, D) derived from 2D spectra. Components at 5T exhibit lower T2 values compared to 3T, while showing similar D values. White matter shows higher peak D values than gray matter at both field strengths. The globus pallidus, rich in iron, has the smallest T2 values.
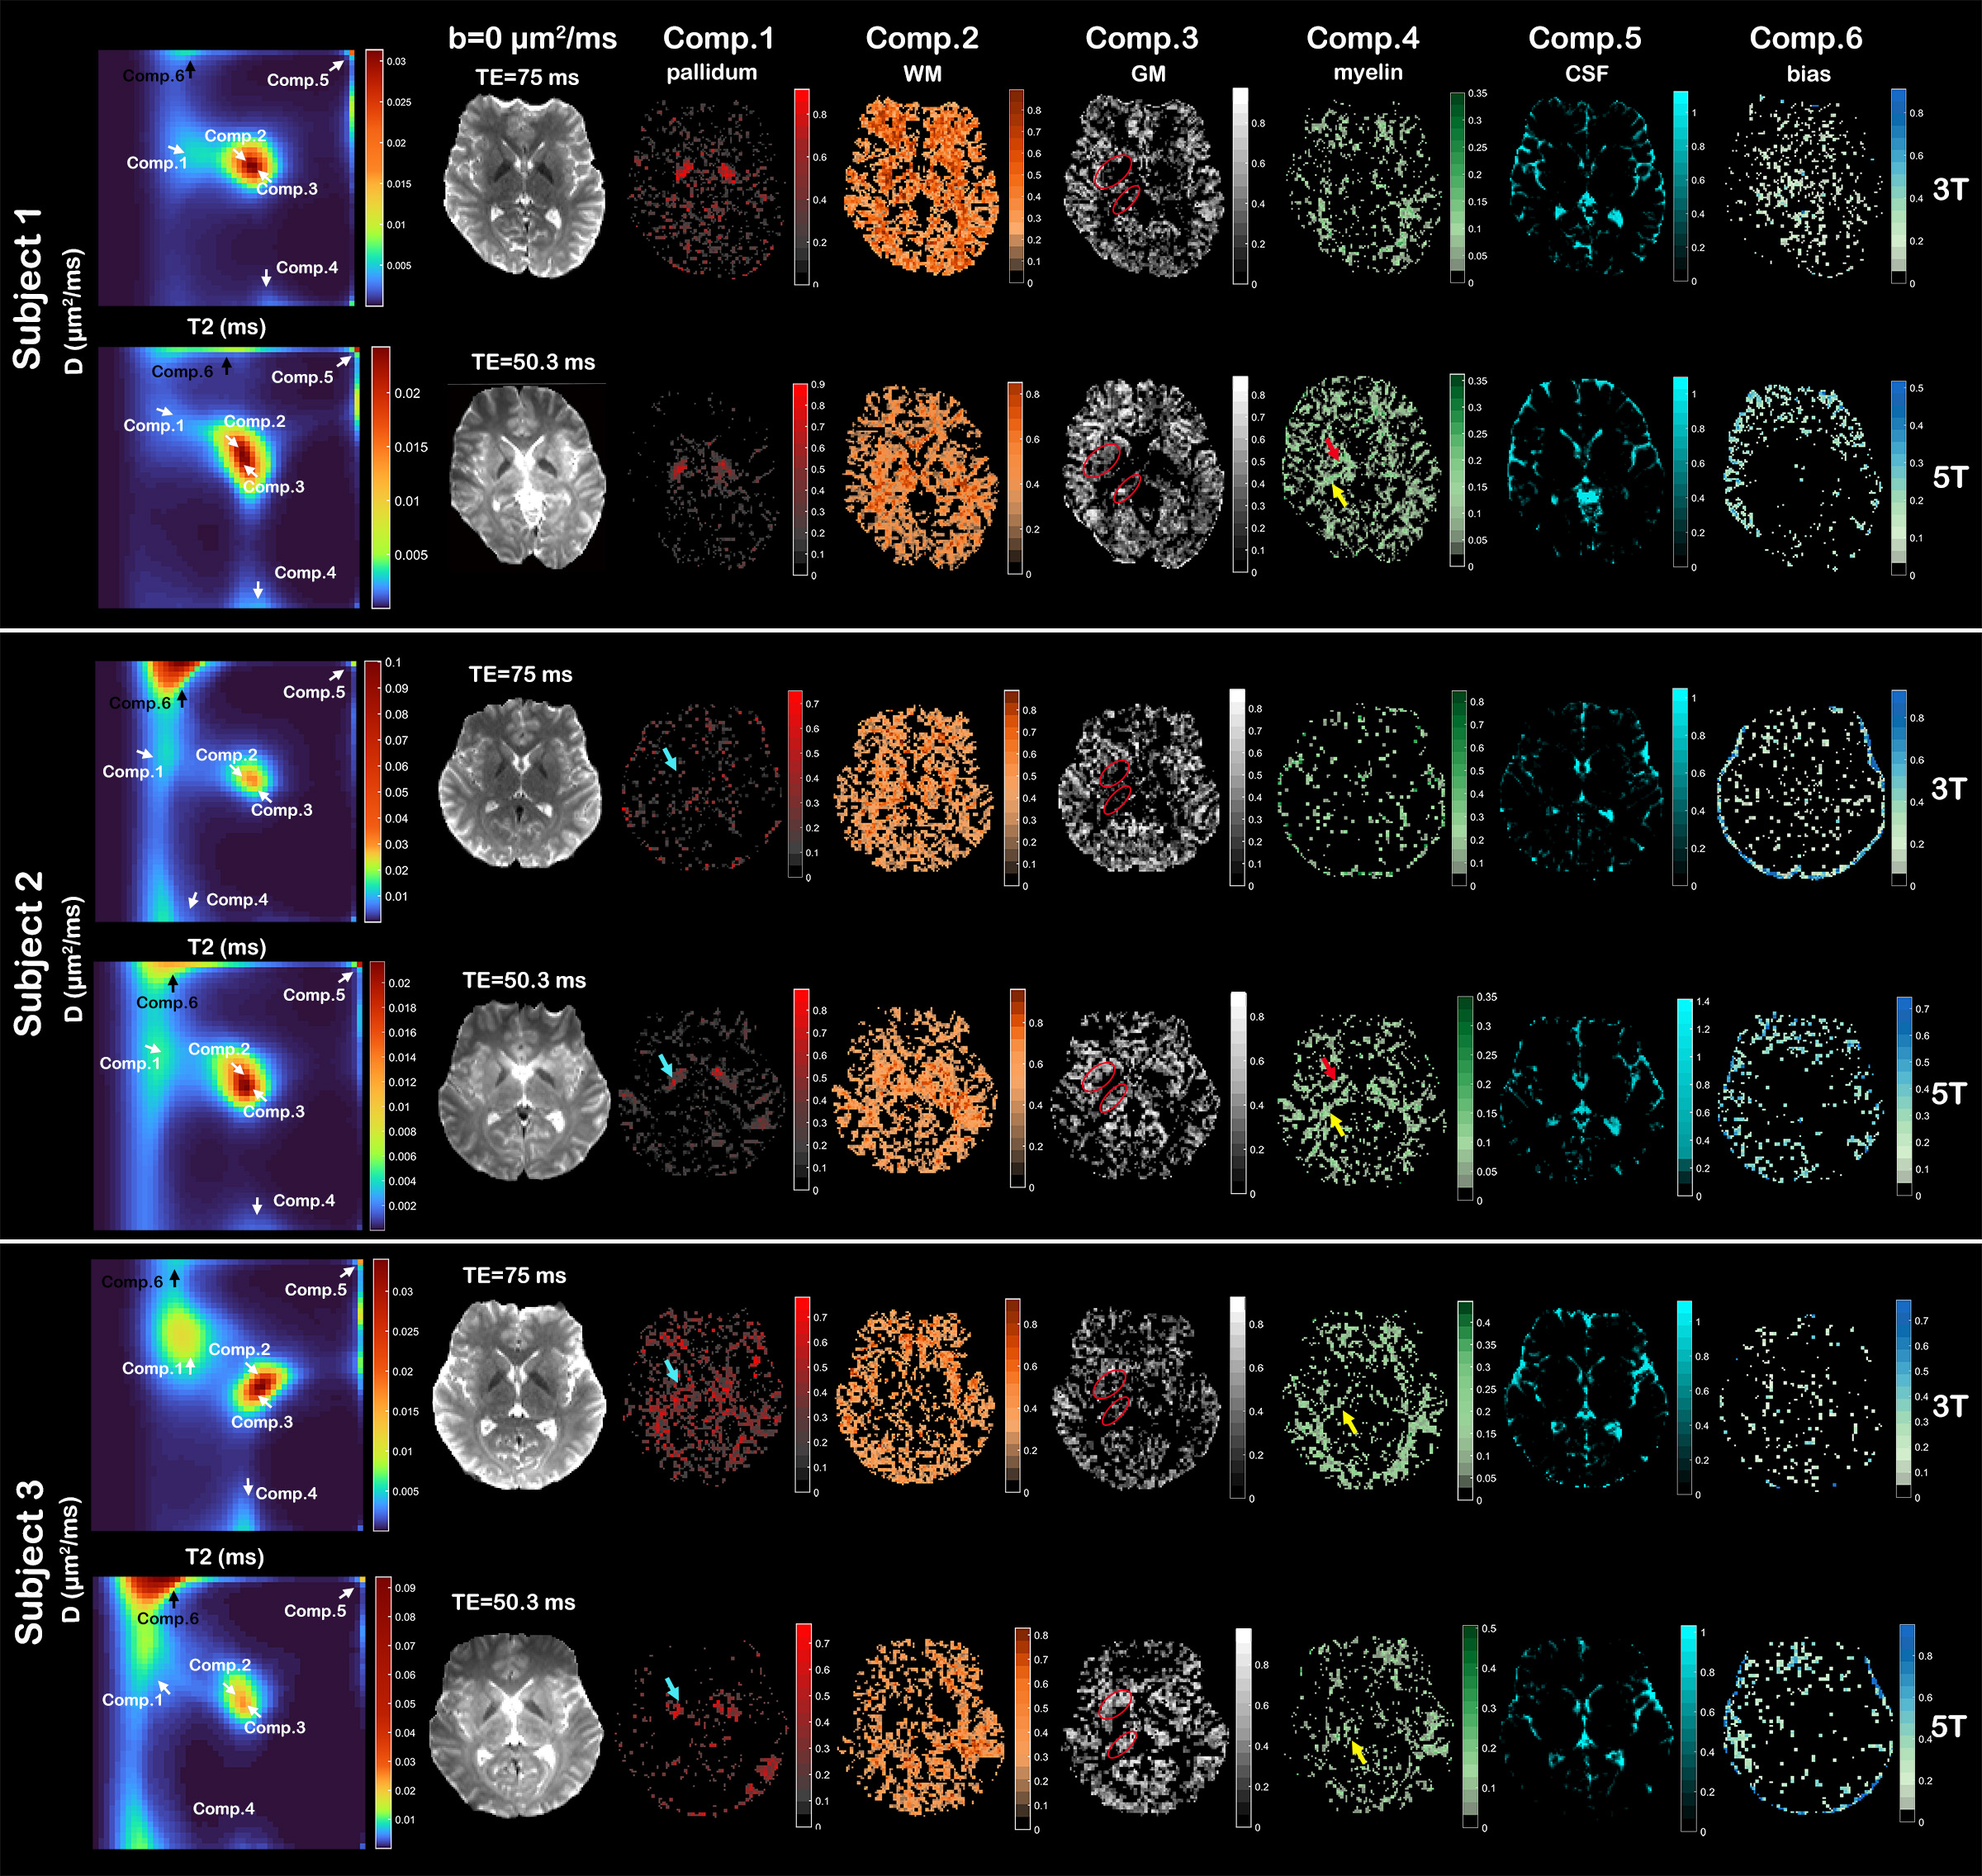
Figure 2 presents spatially averaged 2D spectra and spatial maps from three subjects, highlighting six components. The globus pallidus (component 1) at 5T is more identifiable compared to that at 3T. The 2D spectra at 5T maps more clearly differentiate gray and white matter. In addition, the spatial maps at 5T show distinct visibility of deep brain nuclei, such as the globus pallidus, thalamus, and putamen in components 3 and 4.
Discussion
Benefiting from its ultra-high field strength and high gradient performance, the 5T MR system offers superior performance in DR-CSI, especially for the detection of deep brain nuclei, revealing unique spectral signatures for iron-rich globus pallidus. Despite limitations in accurate T2 estimation of myelin water due to the insufficient range of contrast encoding parameters, the range of ($$$T2,D$$$) values and Comp. 4's consistency with prior studies5 indicates the method's potential ability to resolve myelin water spatial mapping.The presence of component 6 in spectra may be caused by susceptibility artifacts, which are more pronounced at higher fields, especially around the brain's edge.
Lacking a gold standard, we emphasized qualitative assessment over quantitative validation, yielding promising repeatability and consistency across subjects. Future study will perform quantitative comparison across a larger number of subjects.
Conclusion
DR-CSI at 5T offers enhanced sensitivity to brain microstructures and advantages in mapping globus pallidus compared to 3T. The promising outcomes at 5T indicate DR-CSI’s potential for future clinical applications in studying diseases such as infarcts and neurodegenerative conditions.Acknowledgements
This work was supported by the National Natural Science Foundation of China (No. 81971583, No. 82271956), Shanghai Municipal Science and Technology Major Project (No. 2018SHZDZX01), National Key R&D Program of China (No. 2018YFC1312900).References
1. Kim D, Doyle EK, Wisnowski JL, Kim JH, Haldar JP. Diffusion-relaxation correlation spectroscopic imaging: A multidimensional approach for probing microstructure. Magn Reson Med 2017;78(6):2236-2249.
2. Kim D, Wisnowski JL, Nguyen CT, Haldar JP. Multidimensional correlation spectroscopic imaging of exponential decays: From theoretical principles to in vivo human applications. NMR Biomed 2020;33(12):e4244.
3. Vachha B, Huang SY. MRI with ultrahigh field strength and high-performance gradients: challenges and opportunities for clinical neuroimaging at 7 T and beyond. European Radiology Experimental 2021;5(1).
4. Afonso MV, Bioucas-Dias JM, Figueiredo MA. An augmented Lagrangian approach to the constrained optimization formulation of imaging inverse problems. IEEE Trans Image Process 2011;20(3):681-695.
5. Hwang D, Kim D-H, Du YP. In vivo multi-slice mapping of myelin water content using T2* decay. NeuroImage 2010;52(1):198-204.
Figures