2140
Validating a novel normalization method - 'Pscore' to assess individual deviations using diffusion MRI data from the Human Connectome Project1Quantitative Medical Imaging, NIBIB, NIH, Bethesda, MD, United States, 2Military Traumatic Brain Injury Initiative, Bethesda, MD, United States, 3The Henry Jackson Foundation for the Advancement of Military Medicine, Bethesda, MD, United States
Synopsis
Keywords: Diffusion Analysis & Visualization, Diffusion/other diffusion imaging techniques, Statistical Analysis, Normalization Techniques, Zscore, Pscore, Human Connectome Project
Motivation: Conventional methods like Zscores are often used to evaluate individual patients against a normative distribution. This can lead to biased estimations when distributions are skewed. We showed this in a pilot study using 48 controls and proposed a novel metric - 'Pscore', to address this bias. We aimed to reproduce these results systematically using a larger dataset.
Goal(s): Validate the 'Pscore' approach on a large-scale high resolution neuroimaging dataset.
Approach: Diffusion MRI data from the Human Connectome Project (HCP) was used to test various normalization methods
Results: Pscores demonstrate symmetric distributions and no systematic biases observed in Zscores of all diffusion MRI derived metrics.
Impact: The non-Gaussian nature of neuroimaging data has implications for building normative databases and their use to assess abnormalities in individual subjects. The proposed 'Pscore' approach reliably addresses this, which implies its usefulness for individual assessments even in smaller neuroimaging datasets.
INTRODUCTION
Normative modeling is often used to assess individuals.1-3 Quantitative MRI metrics hold the potential to assess individual deviations and typically incorporate the Zscore approach. A fundamental assumption for such parametric models is that the data is normally distributed. However, neuroimaging metrics, such as those derived from diffusion MRI (dMRI), often do not conform to Gaussianity, even in large-scale datasets.4 Biases are introduced when inferences are made from such skewed distributions.5 In ISMRM 2023, we also reported similar skews and biases in Zscores using dMRI data from 48 controls and how the proposed Pscore approach accounts for it.6 We showed that when the normative distribution itself is skewed and an individual is assessed against such a distribution, the direction of skew causes an extreme value bias in the corresponding tails. But these findings were from a small sample and normative models are typically built using larger datasets. Therefore, we designed this work based on two important questions – (a) do these inconsistencies in Zscores persist in large-scale datasets? If so, how well does the Pscore approach account for it? We address this by using dMRI data from an effective sample of 960 healthy young adults from the Human Connectome Project (HCP).7METHODS
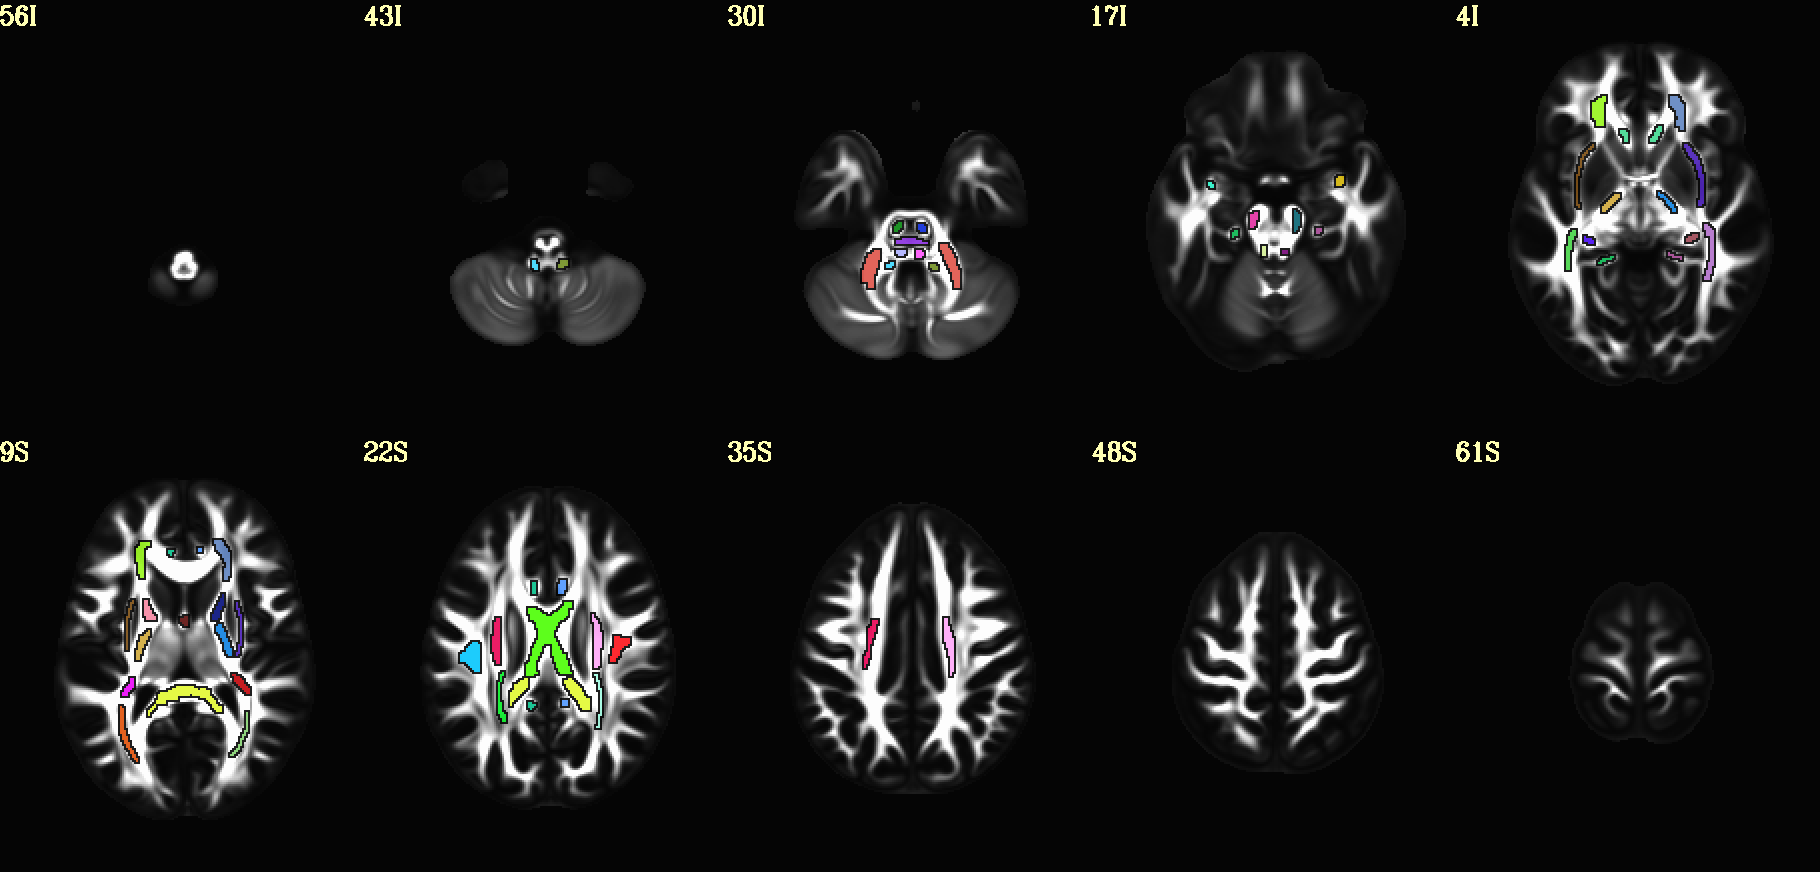
We used the latest version of our robust TORTOISEV48 pipeline to preprocess the dMRI data. Four diffusion tensor (DT)9, 10 and five mean apparent propagator (MAP)11 voxelwise metrics were computed and average values within atlas ROIs12 generated from the same dataset (see Figure1), were extracted. The method delineating the computation of Pscores is detailed in our pilot work.6 The 'Pscore' approach uses the median as the reference and incorporates percentile ranks computed from the normative sample. It normalizes the difference between a subject's position and the median of the distribution with the corresponding difference between the 5th/95th percentile edge values. Other normalization techniques like ‘Log’ transformations and standardized ‘Zscores’ were also tested ROIwise. The distributions from the raw data were compared against distributions from these three normalization techniques. Particularly, Zscores and Pscores from the entire sample were taken across all white matter ROIs to evaluate two parameters: (a) the total percentage (%) of positive and negative values around the 0-line, and (b) the percentage (%) of extreme values above and below the 95th and 5th percentiles, respectively. The first parameter identifies the skewness in the normative distribution and the second parameter quantifies the bias introduced in extreme values at the left/right tails.RESULTS AND DISCUSSION
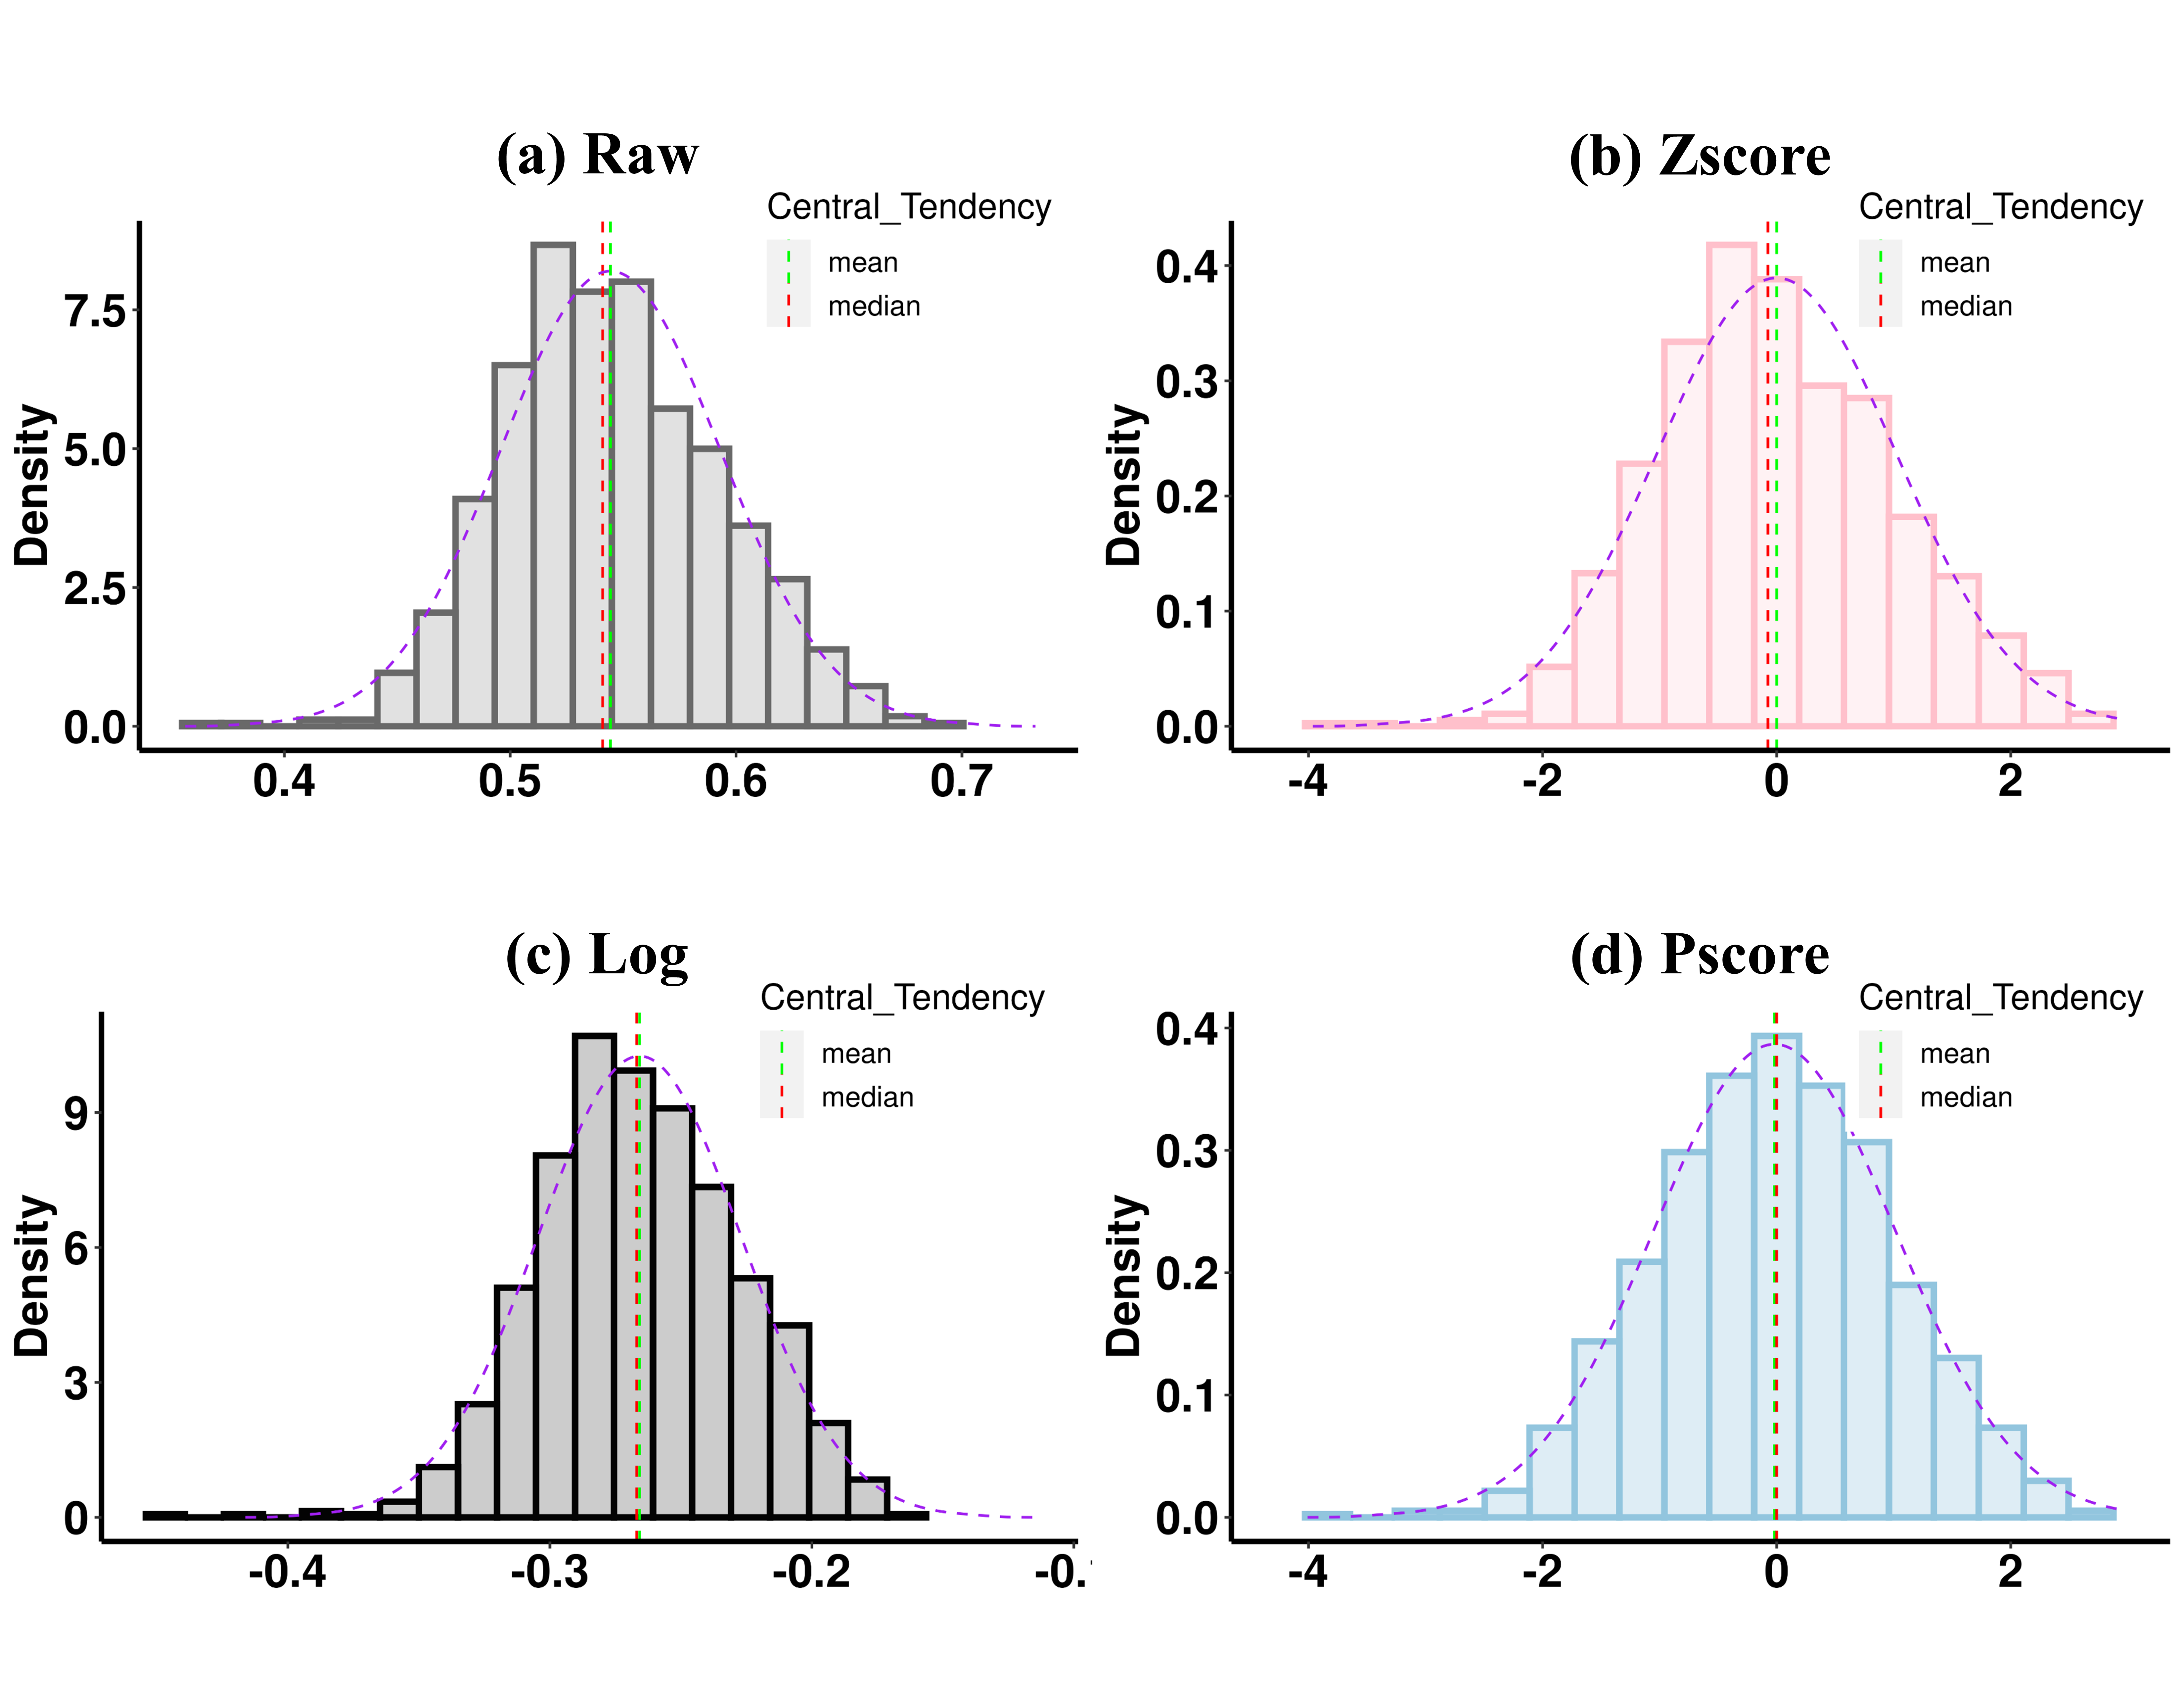
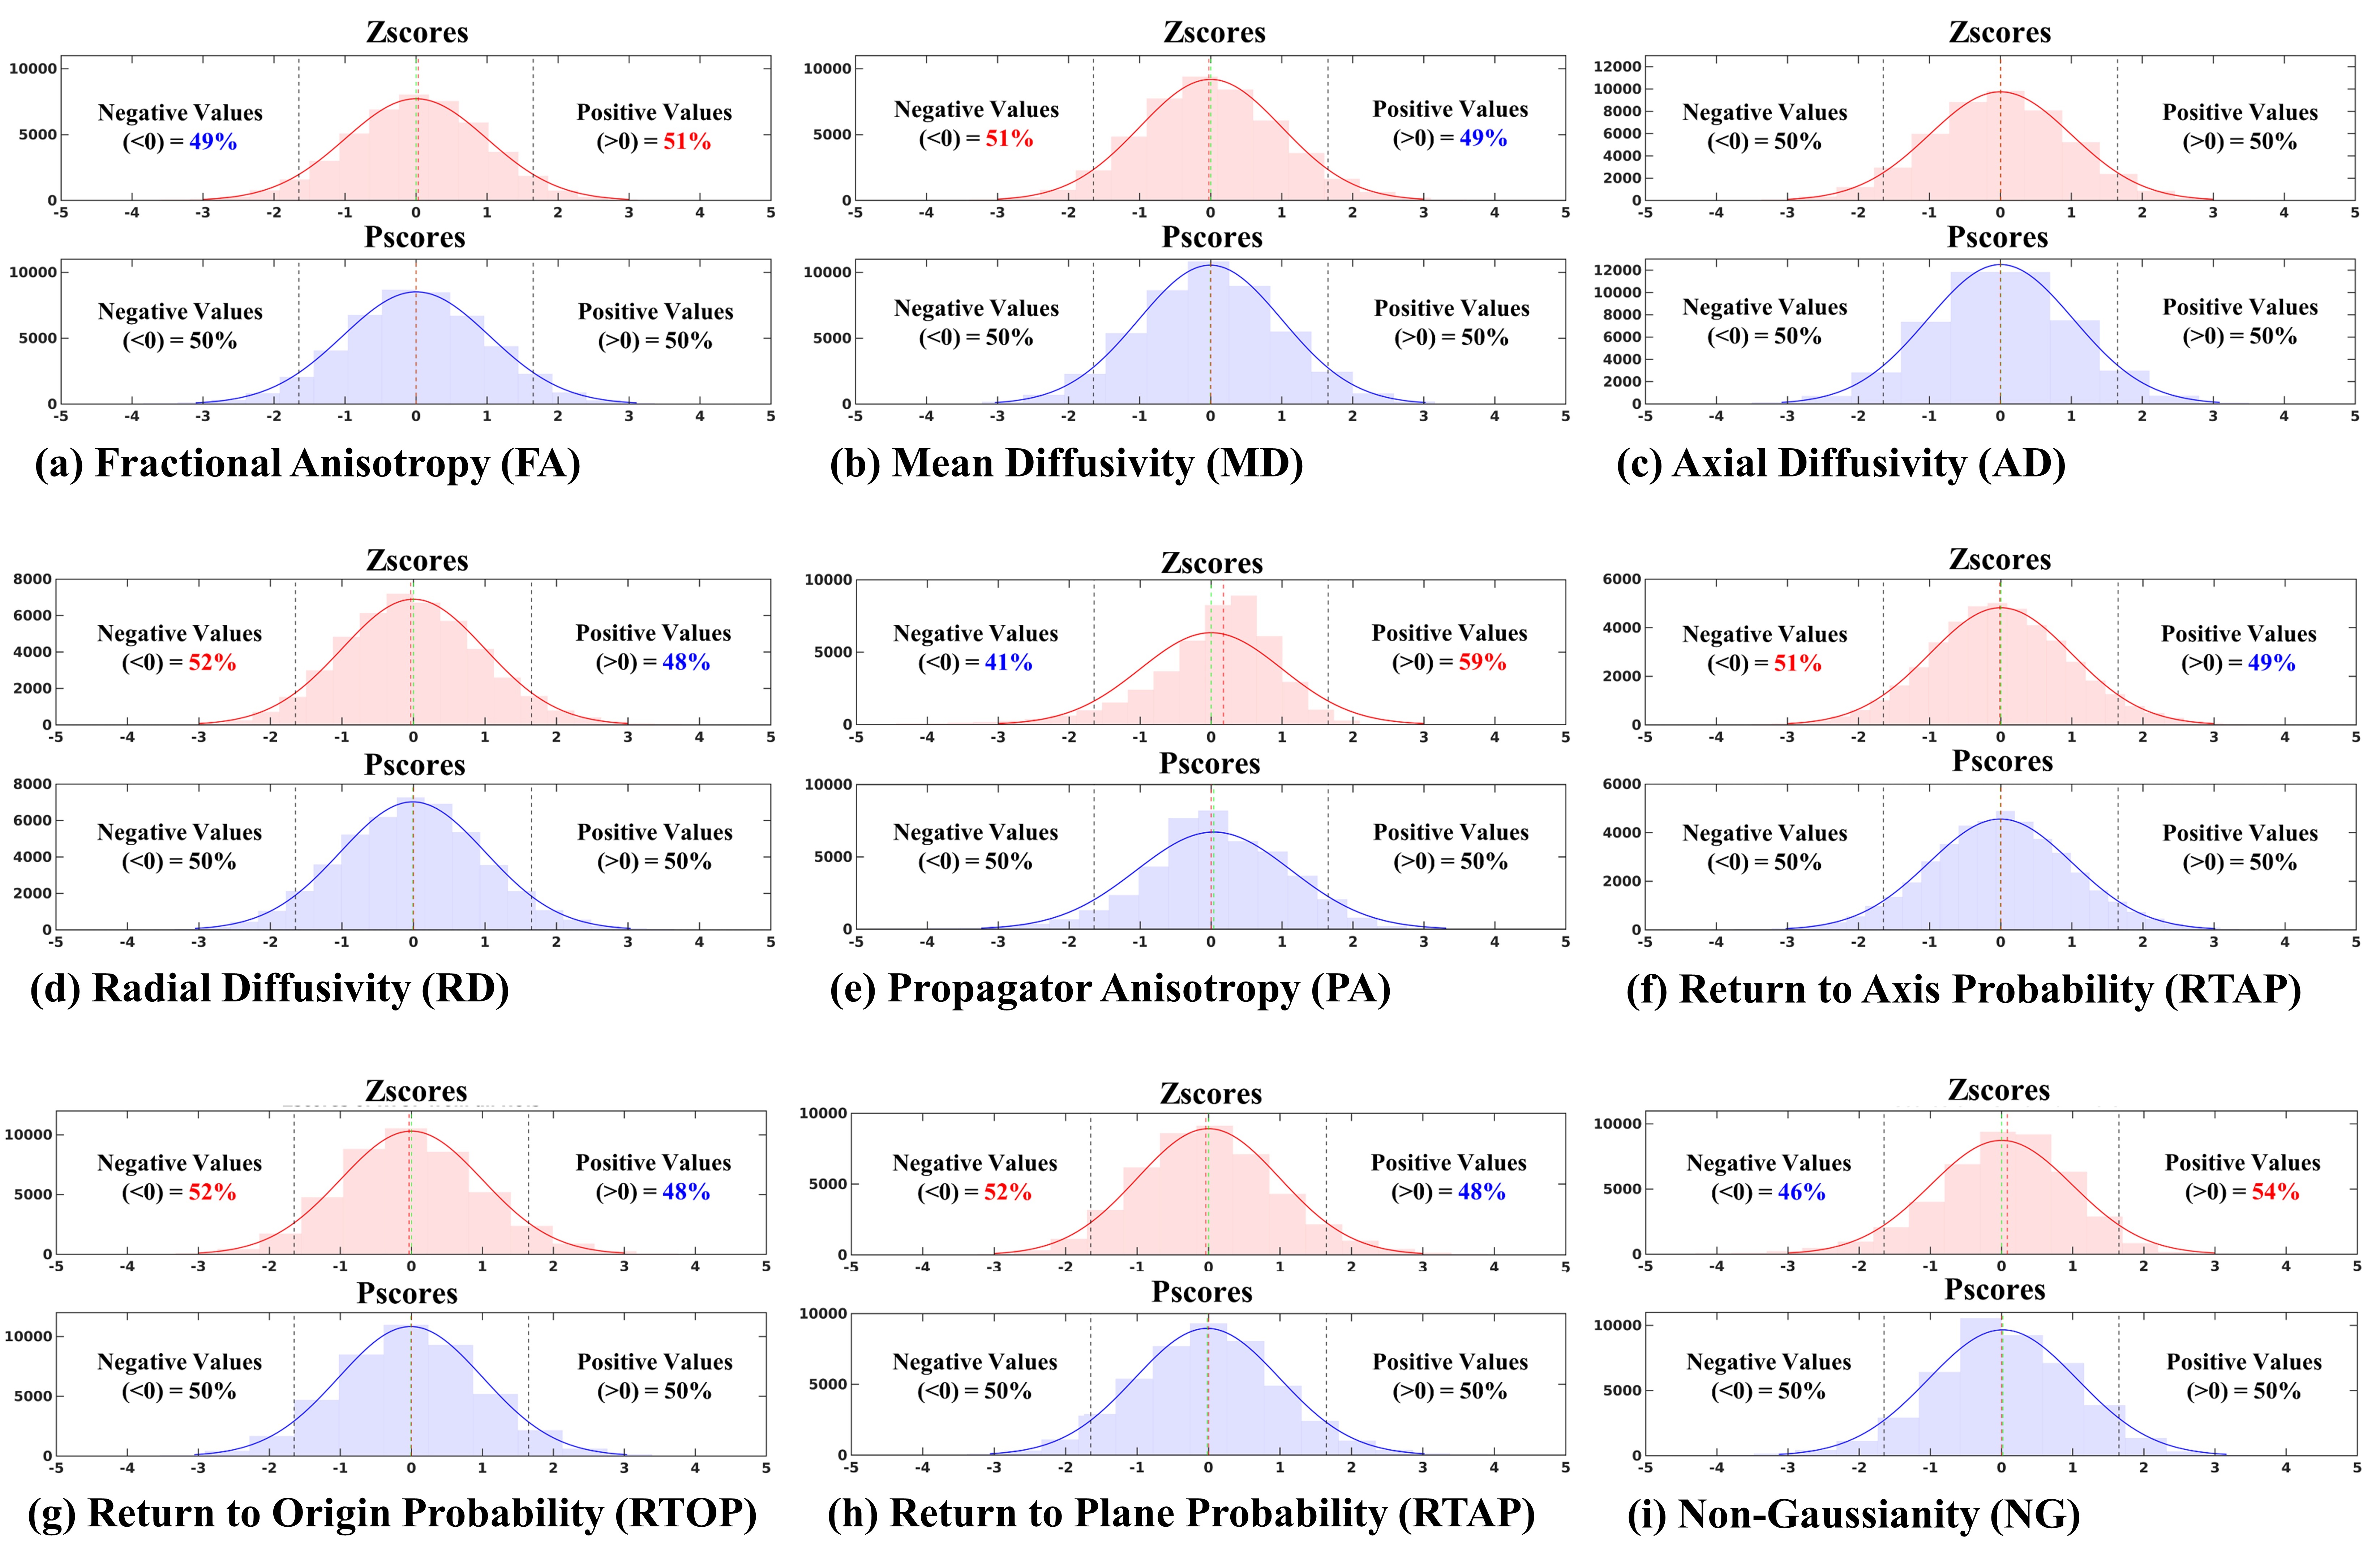
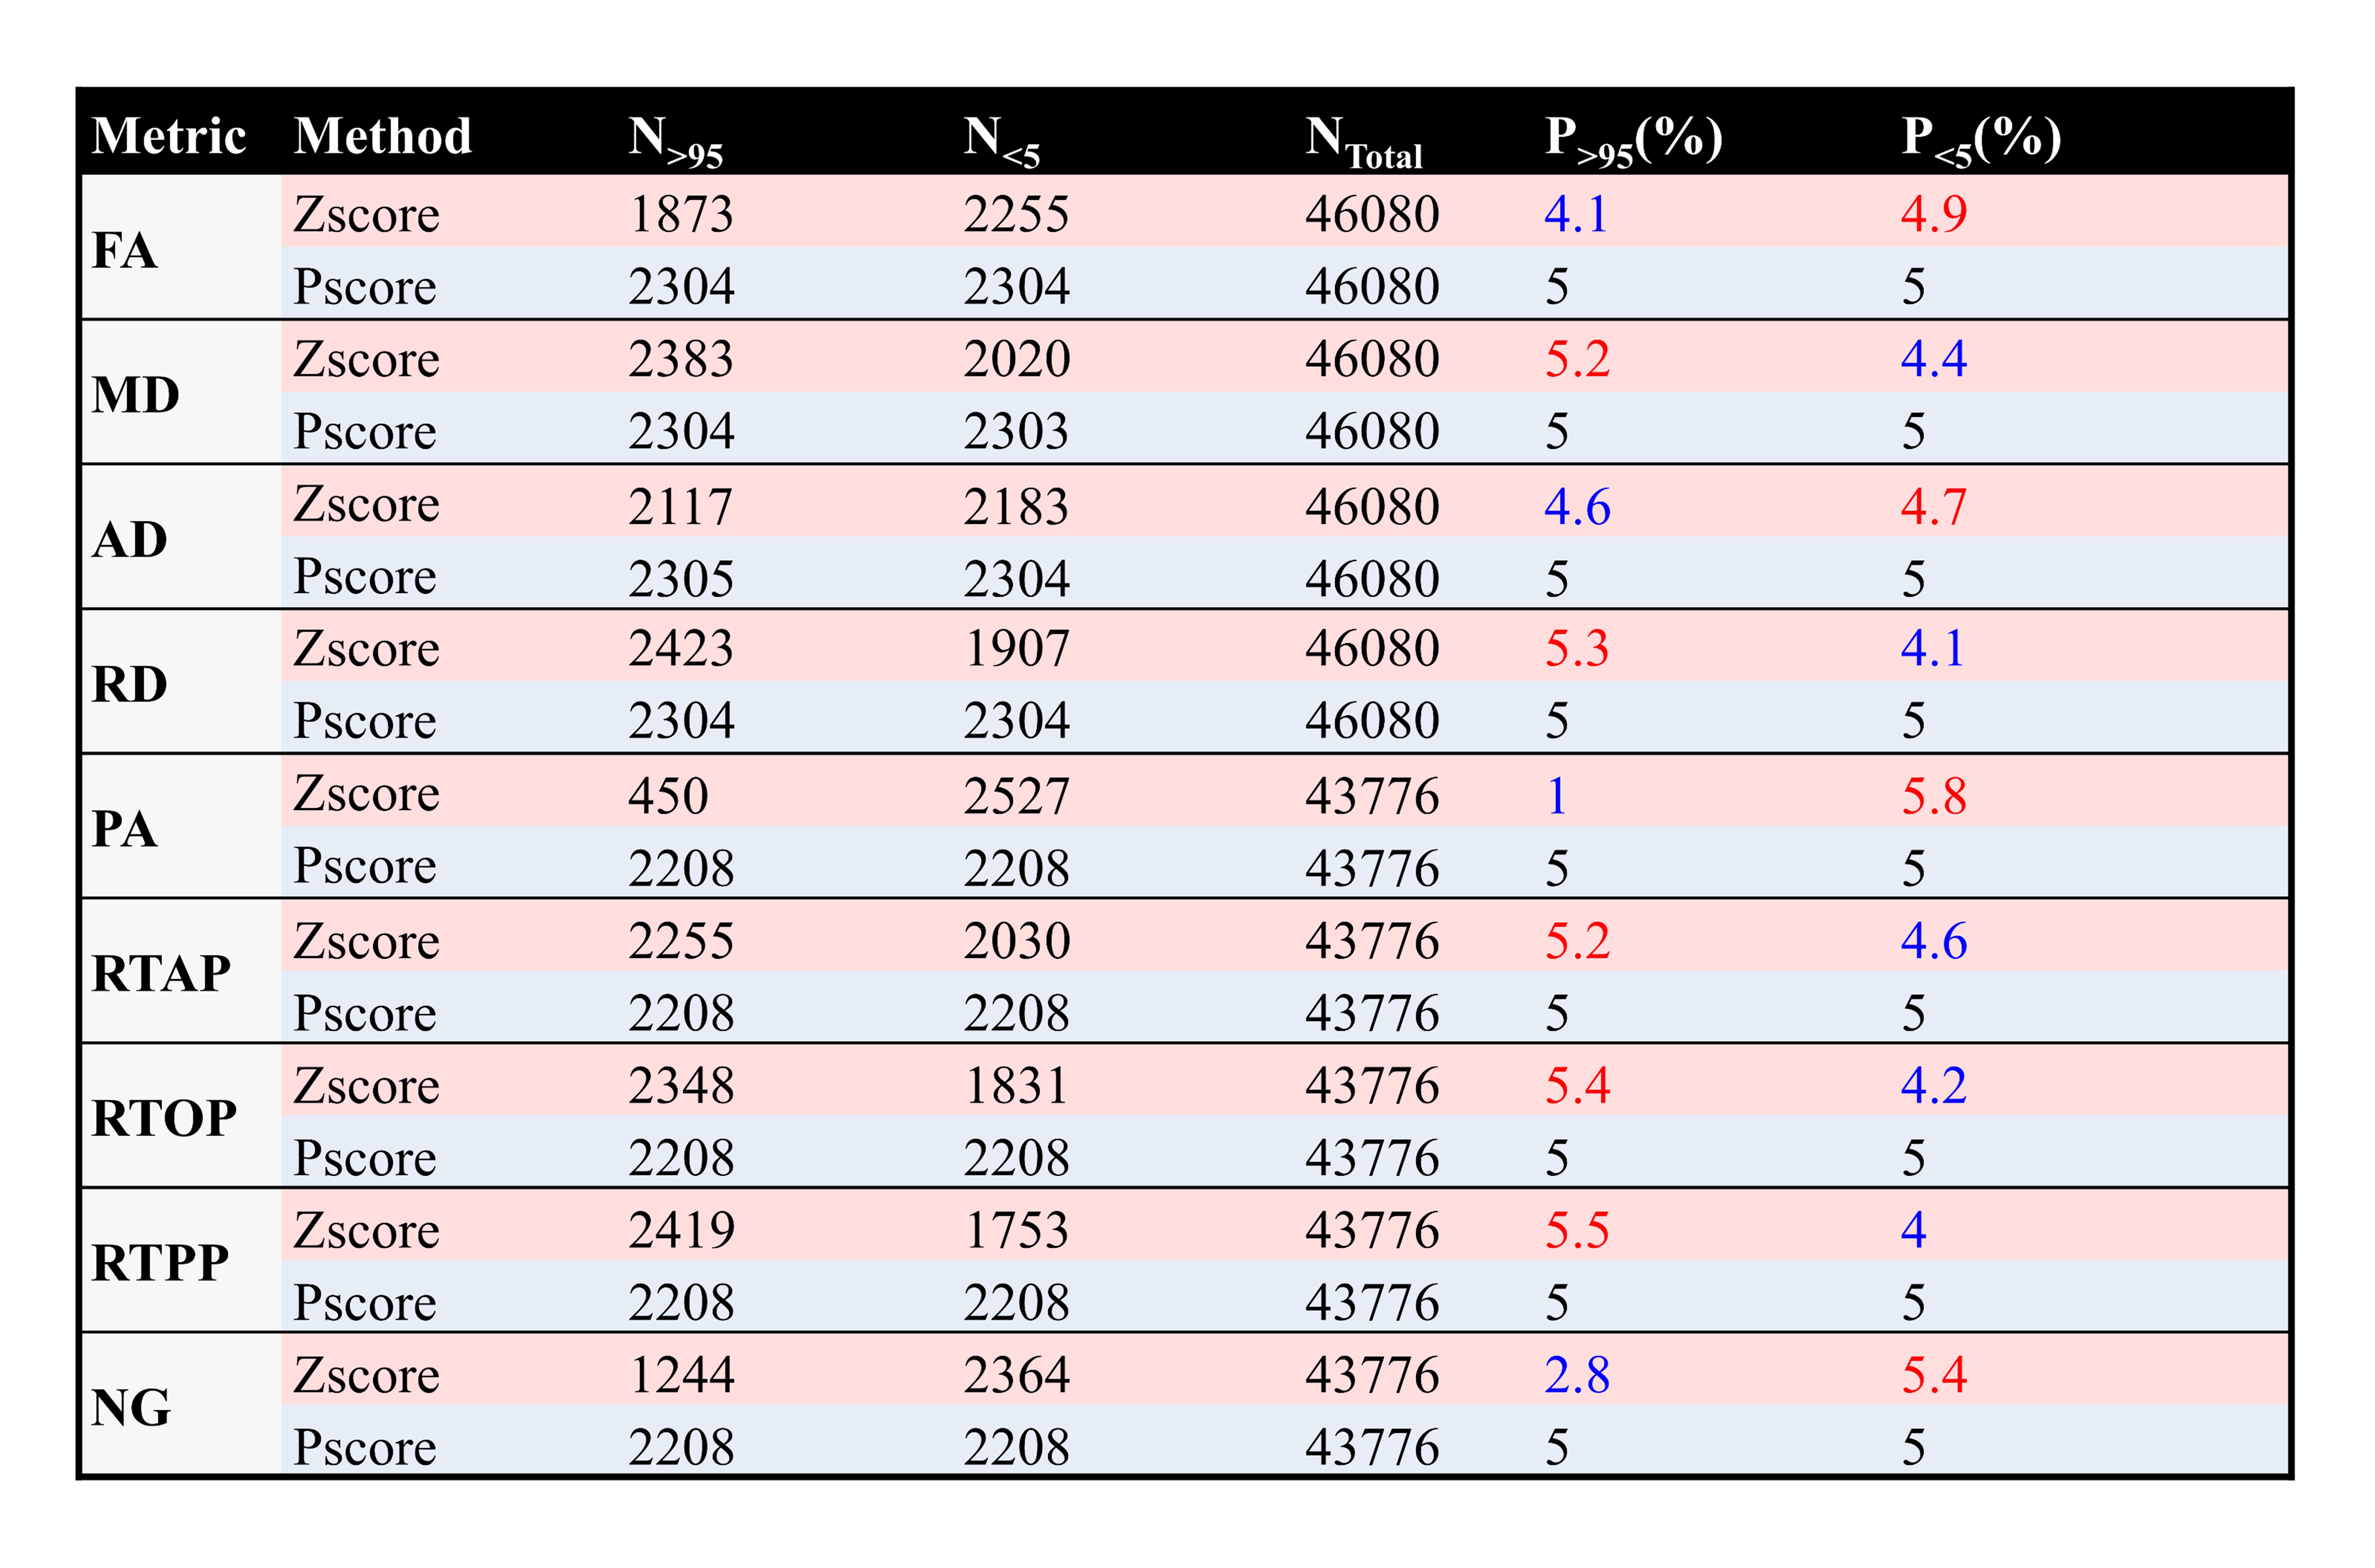
Figure2 shows how the Pscore approach compares against other normalization methods within a representative ROI: left Superior Longitudinal Fasciculus. Pscores (Figure2.(d)) of fractional anisotropy (FA) attain a closer fit to a normal distribution compared to the other methods (Figure2.(b) and (c)). The mean, mode and median of the Pscore distribution nicely align at the 0-line, unlike the 'Log' transform and 'Zscore' distributions. When assessed over all white matter ROIs from the entire sample (Figure 3), Zscores of propagator anisotropy (PA) (Figure 3(e)) demonstrated the highest skew (59% positive vs. 41% negative Zscores) among the metrics shown. Such imbalances in positive and negative Zscores were observed at various levels for all dMRI metrics. Contrarily, the Pscore distributions maintain a balanced 50% positive and negative scores around the 0-line for all dMRI metrics. The skews observed in Zscore distributions introduced extreme value bias in the tails of these distributions. These biases were quantified in Table1, which shows that Zscores from both DT and MAP metrics have an unbalanced percentage of extreme values (P>95(%) and P<5(%) ≠ 5%). On the other hand, Pscores from the same metrics maintain 5% extreme values in both tails. Therefore, when comparing individuals to a skewed normative distribution, Pscores provide a more robust and accurate estimation. This can have useful applications in neuroimaging, where normative models use Zscores to assess individual deviations.4, 13 Furthermore, our pilot work6 showed Pscores robustly account for such biases even in smaller samples (n = 48). Therefore, Pscores can also prove very useful when assessing individual deviations using neuroimaging datasets with more practical sample sizes e.g., 50-100 subjects.CONCLUSION
We used a large sample of high resolution dMRI data from the HCP7 to test the ‘Pscore’ approach and reproduce our previous findings.6 We propose the use of this novel metric: ‘Pscore’, to accurately assess individual deviations with respect to a normative distribution, especially, when the normative data have skewed distributions. Even though diffusion MRI was used to showcase the ‘Pscore’ approach, it is not data-selective, and should be reliably applicable to any data from clinical and research paradigms.Acknowledgements
Data were provided [in part] by the Human Connectome Project, WU-Minn Consortium (Principal Investigators: David Van Essen and Kamil Ugurbil; 1U54MH091657) funded by the 16 NIH Institutes and Centers that support the NIH Blueprint for Neuroscience Research; and by the McDonnell Center for Systems Neuroscience at Washington University.References
1. Shirk SD, Mitchell MB, Shaughnessy LW, Sherman JC, Locascio JJ, Weintraub S, Atri A. A web-based normative calculator for the uniform data set (UDS) neuropsychological test battery. Alzheimers Res Ther. 2011;3(6):32. Epub 20111111. doi: 10.1186/alzrt94. PubMed PMID: 22078663; PMCID: PMC3308021.
2. Kjelkenes R, Wolfers T, Alnæs D, Norbom LB, Voldsbekk I, Holm M, Dahl A, Berthet P, Tamnes CK, Marquand AF, Westlye LT. Deviations from normative brain white and gray matter structure are associated with psychopathology in youth. Dev Cogn Neurosci. 2022;58:101173. Epub 20221101. doi: 10.1016/j.dcn.2022.101173. PubMed PMID: 36332329; PMCID: PMC9637865.
3. Lv J, Di Biase M, Cash RFH, Cocchi L, Cropley VL, Klauser P, Tian Y, Bayer J, Schmaal L, Cetin-Karayumak S, Rathi Y, Pasternak O, Bousman C, Pantelis C, Calamante F, Zalesky A. Individual deviations from normative models of brain structure in a large cross-sectional schizophrenia cohort. Molecular Psychiatry. 2021;26(7):3512-23. doi: 10.1038/s41380-020-00882-5.
4. Fraza CJ, Dinga R, Beckmann CF, Marquand AF. Warped Bayesian linear regression for normative modelling of big data. NeuroImage. 2021;245:118715. Epub 20211117. doi: 10.1016/j.neuroimage.2021.118715. PubMed PMID: 34798518; PMCID: PMC7613680.
5. Sherwood B, Zhou AX, Weintraub S, Wang L. Using quantile regression to create baseline norms for neuropsychological tests. Alzheimers Dement (Amst). 2016;2:12-8. Epub 20151219. doi: 10.1016/j.dadm.2015.11.005. PubMed PMID: 27239531; PMCID: PMC4879644.
6. Hafiz R, Nayak A, Irfanoglu MO, Chan L, Pierpaoli C. Using ‘P-scores’: a novel percentile-based normalization method to accurately assess individual deviation in heavily skewed neuroimaging data. 2023 ISMRM & ISMRT Annual Meeting & Exhibition, Toronto, Canada, Program Abstract Number #3781, ISSN# 1545-4428 | Published date: 19 May, 2023.
7. Van Essen DC, Smith SM, Barch DM, Behrens TEJ, Yacoub E, Ugurbil K. The WU-Minn Human Connectome Project: An overview. NeuroImage. 2013;80:62-79. doi: https://doi.org/10.1016/j.neuroimage.2013.05.041.
8. Irfanoglu MO, Nayak A, Taylor P, Pierpaoli C. TORTOISE V4: ReImagining the NIH Diffusion MRI Processing Pipeline. 2023 ISMRM & ISMRT Annual Meeting & Exhibition, Toronto, Canada, Program Abstract Number #0080.
9. Basser PJ, Mattiello J, LeBihan D. MR diffusion tensor spectroscopy and imaging. Biophys J. 1994;66(1):259-67. doi: 10.1016/s0006-3495(94)80775-1. PubMed PMID: 8130344; PMCID: PMC1275686.
10. Pierpaoli C, Jezzard P, Basser PJ, Barnett A, Di Chiro G. Diffusion tensor MR imaging of the human brain. Radiology. 1996;201(3):637-48. doi: 10.1148/radiology.201.3.8939209. PubMed PMID: 8939209.
11. Özarslan E, Koay CG, Shepherd TM, Komlosh ME, İrfanoğlu MO, Pierpaoli C, Basser PJ. Mean apparent propagator (MAP) MRI: a novel diffusion imaging method for mapping tissue microstructure. NeuroImage. 2013;78:16-32. Epub 20130413. doi: 10.1016/j.neuroimage.2013.04.016. PubMed PMID: 23587694; PMCID: PMC4059870.
12. Irfanoglu MO, Beyh A, Catani M, Dell'Acqua F, Pierpaoli C. ReImagining the Young Adult Human Connectome Project (HCP) Diffusion MRI Dataset. Proc. Intl. Soc. Mag. Reson. Med. 30 2022.
13. Marquand AF, Rezek I, Buitelaar J, Beckmann CF. Understanding Heterogeneity in Clinical Cohorts Using Normative Models: Beyond Case-Control Studies. Biol Psychiatry. 2016;80(7):552-61. Epub 20160106. doi: 10.1016/j.biopsych.2015.12.023. PubMed PMID: 26927419; PMCID: PMC5023321.
Figures