2128
Spatial-temporal segmentation of cine cardiac MRI time-series1Wuhan National Laboratory for Optoelectronics, Huazhong University of Science and Technology, Wuhan, China, 2State Key Laboratory of Magnetic Resonance and Atomic and Molecular Physics, National Center for Magnetic Resonance in Wuhan, Innovation Academy for Precision Measurement Science and Technology, Chinese Academy of Sciences, Wuhan, China
Synopsis
Keywords: Segmentation, Segmentation
Motivation: Cine cardiac MRI provides a way to quantify additional cardiac indices beyond ejection fraction, including ejection and filling rates, myocardial wall motion, and strain; segmentation of all temporal phases is required.
Goal(s): To develop an approach to segmenting images in all cardiac phases in cine MRI.
Approach: A U-net and a recurrent-neural-network were integrated to exploit the spatial-temporal information in cine time-series. 100 and 50 subjects labeled at the end-systole and end-diastole phases were used for network training and testing, respectively.
Results: The use of spatial-temporal information substantially improved the segmentation accuracy and the algorithm cardiac indices were strongly correlated with manual measurements.
Impact: The proposed method made effective use of the spatial-temporal information in a cine time-series and yielded highly accurate and precise segmentation and cardiac functional measurements, suggesting the utility of our approach for clinical cardiac patient care.
Introduction
Cine MRI is used for quantification of the volumes, myocardial mass, and ejection fraction of the heart by analyzing the end-systole (ES) and end-diastole (ED) phases. Cine MRI also enables the evaluation of ejection and filling rates, myocardial wall motion, and strain by segmenting and analyzing all the temporal phases in a cardiac cycle1–3. Deep learning can be used to segment cardiac structures from cine time-series, but conventionally fully supervised approaches require manual annotation of all phases for training, which is difficult to obtain. Accordingly, the objective of this study is to exploit the spatial and temporal information for optimal cine time-series segmentation using existing manual labels at ES and ED phases.Methods
Dataset: We investigated the Automatic Cardiac Diagnosis Challenge dataset which consists of 150 subjects4. 100 subjects were used for training and the remaining 50 cases were used for testing, both of which were composed of equal numbers of subjects in five categories of: heart failure with myocardial infarction, dilated cardiomyopathy, hypertrophic cardiomyopathy, abnormal right ventricle, and healthy volunteers. Full-stack 2D short-axis cine images were acquired from the base to the apex at 1.5T or 3.0T in a breath-hold using an SSFP sequence (in-plane voxel size=1.34-1.68 mm2, slice thickness=5-10 mm, number of slices=6–18, 28–40 phases covering a partial or complete cardiac cycle). The 3D+time cine images were manually segmented for the left ventricular cavity (LVC), myocardium (Myo), and right ventricular cavity (RVC) at the ED and ES phases.Recurrent neural network for cine time-series segmentation: Figure 1 shows the architecture of the proposed segmentation algorithm. For each subject, the first 20 phases I1...I20 were entered into a standard 2D U-net to extract spatial information for each phase. For each depth level d, the resulting features Fd,1...Fd,20 were processed by a long short-term memory (LSTM) or gated recurrent unit (GRU) module to extract the temporal embedding Md between the labeled and unlabeled phases. Cross entropy between the model prediction and manual annotations at the ED/ES phase was used to train the network: optimizer=Adam, learning rate =1e-4, batch size = 20, number of epochs= 200. In addition, a 2D U-net was trained on the labeled cine images only in the training dataset to segment the same time-series test dataset.
Evaluation methods: Algorithm segmentation was compared with manual labels using Dice-similarity-coefficient (DSC), average symmetric surface distance (ASSD), and Hausdorff distance (HD). Left ventricular ejection fraction (LVEF), myocardium mass (LVMM, density=1.05 g/mL), and right ventricular ejection fraction (RVEF) were calculated from algorithm and manual segmentation. Relationships between these measurements were determined using Pearson correlation coefficients (r) and Bland-Altman analyses. Algorithm segmentation accuracy and cardiac functional indices were evaluated only for the ED and ES phases.
Results
Figure 2(A) shows representative segmentation of basal to apical cine images at various cardiac phases. As shown in Table 1 and 2, LSTM and GRU outperformed the U-net by a large margin for segmenting the ED and ES phases. Compared with LSTM, GRU yielded a similar or higher DSC and substantially lower ASSD and HD for LVC, Myo, and RVC. Figure 2(B) shows the volume of LVC, Myo, and RVC provided by our approach and the U-net for a representative cardiac cycle. Figure 3 shows that there are strong correlations and agreement between algorithm and manual analyses of LVEF (r=0.9852, p<0.0001; bias=0.654%), LVMM (r=0.9846, p<0.0001; bias=1.311 g), and RVEF (r=0.8572, p<0.0001; bias=-2.252%) derived from the ED and ES phases.Discussion
The higher segmentation accuracy yielded by the LSTM and GRU methods vs U-net may stem from the inclusion of the spatial and temporal information within and between cine images at different cardiac phases. In contrast, the U-net was trained with cine images at ED and ES only without considering the temporal characteristics embedded in the time-series. GRU outperformed LSTM and this may be attributed to the vanishing or exploding gradients associated with LSTM and the simpler but more effective gates in GRU. The achieved algorithm segmentation accuracy and cardiac functional indices suggest the utility of our approach for segmenting cine images at various cardiac phases.Conclusion
Our approach made effective use of the spatial and temporal information hidden in cardiac cine time-series and provided automated and rapid cardiac segmentation and functional measurements with high accuracy and precision. All of this is consistent with the need for improving the utility of cine MRI for clinical cardiac disease management.Acknowledgements
Thanks to Calder D. Sheagren and Jaykumar H. Patel for their editorial guidance.References
1. Grothues, F. et al. Comparison of Interstudy Reproducibility of Cardiovascular Magnetic Resonance With Two-Dimensional Echocardiography in Normal Subjects and in Patients With Heart Failure or Left Ventricular Hypertrophy.2. Keenan, N. G. & Pennell, D. J. CMR of Ventricular Function. Echocardiography 24, 185–193 (2007).
3. Lu, Y.-L., Connelly, K. A., Dick, A. J., Wright, G. A. & Radau, P. E. Automatic functional analysis of left ventricle in cardiac cine MRI. Quantitative Imaging in Medicine and Surgery 3, (2013).
4. Bernard, O. et al. Deep Learning Techniques for Automatic MRI Cardiac Multi-Structures Segmentation and Diagnosis: Is the Problem Solved? IEEE Transactions on Medical Imaging 37, 2514–2525 (2018).
Figures
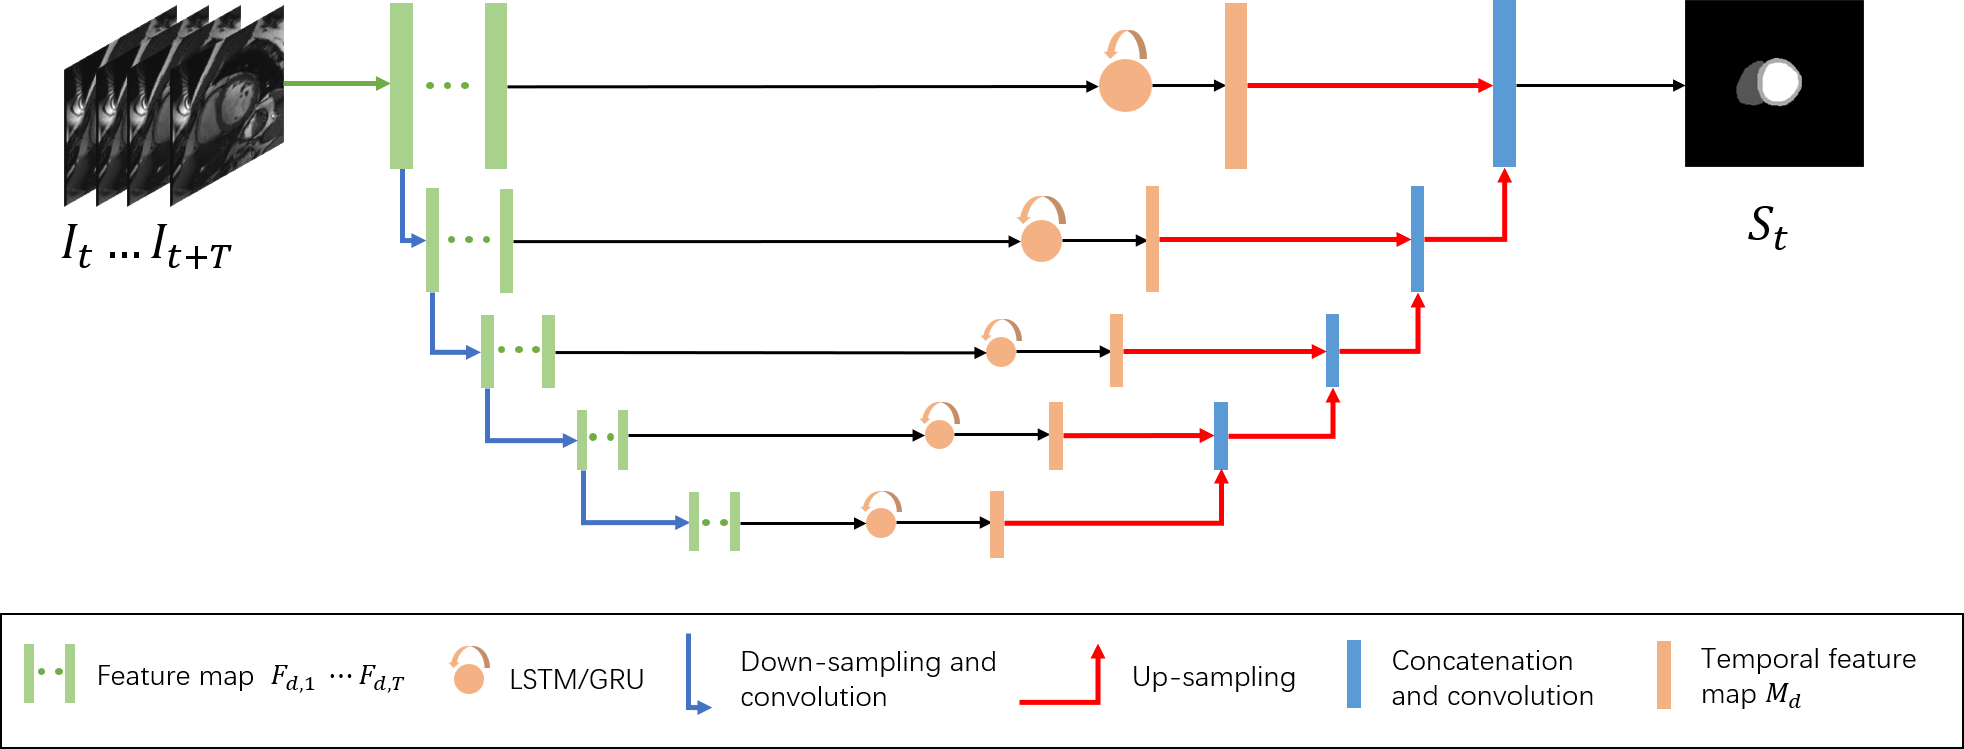
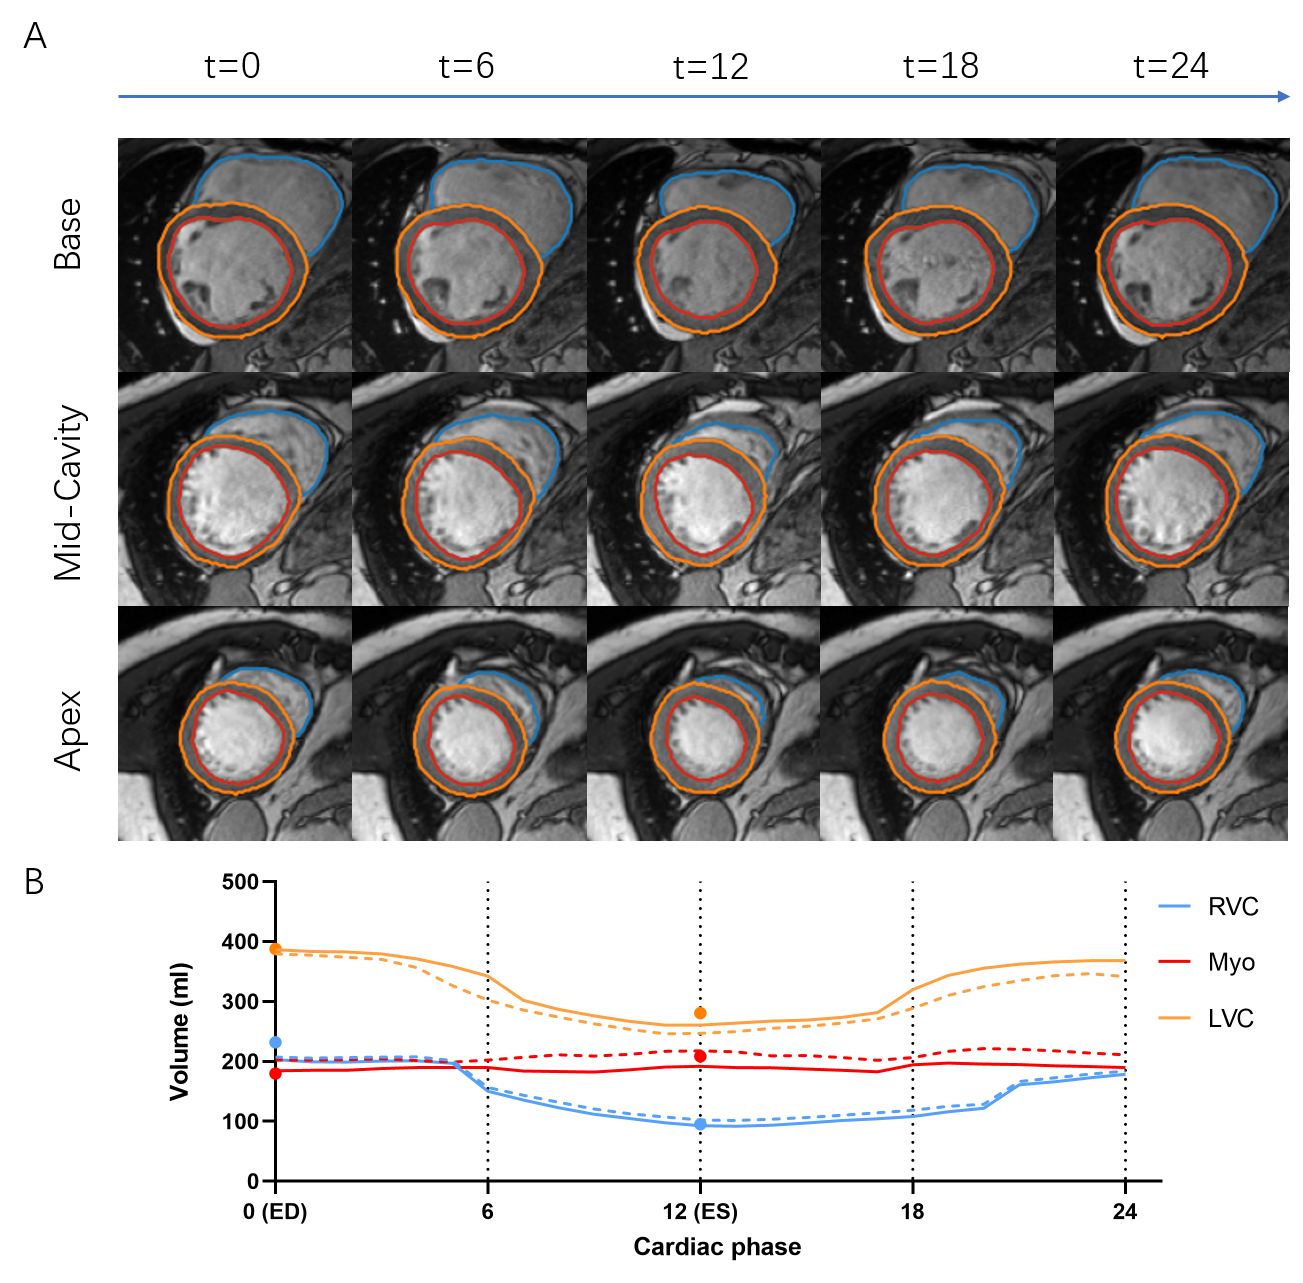
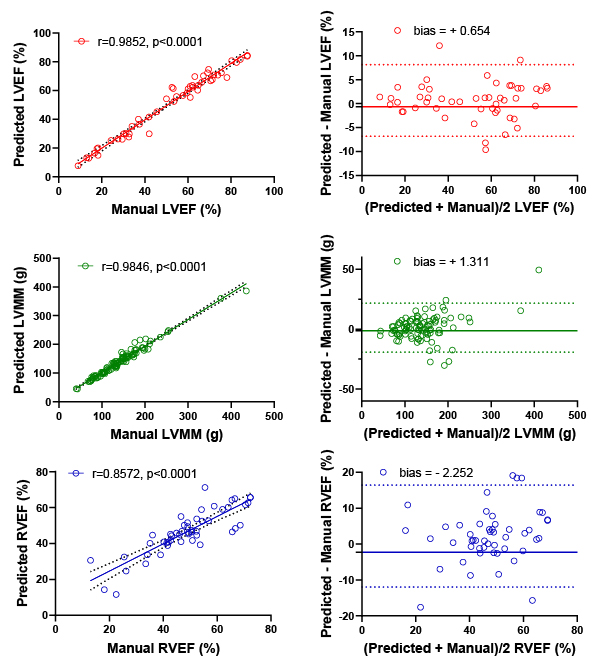
Figure 3. Relationships and agreement between LVEF, LVMM, and RVEF provided by our approach and manual segmentation at the ED and ES phases for 50 test subjects. Linear regression and Bland-Altman analyses of algorithm vs manual measurements are shown on the left and right plots, respectively.
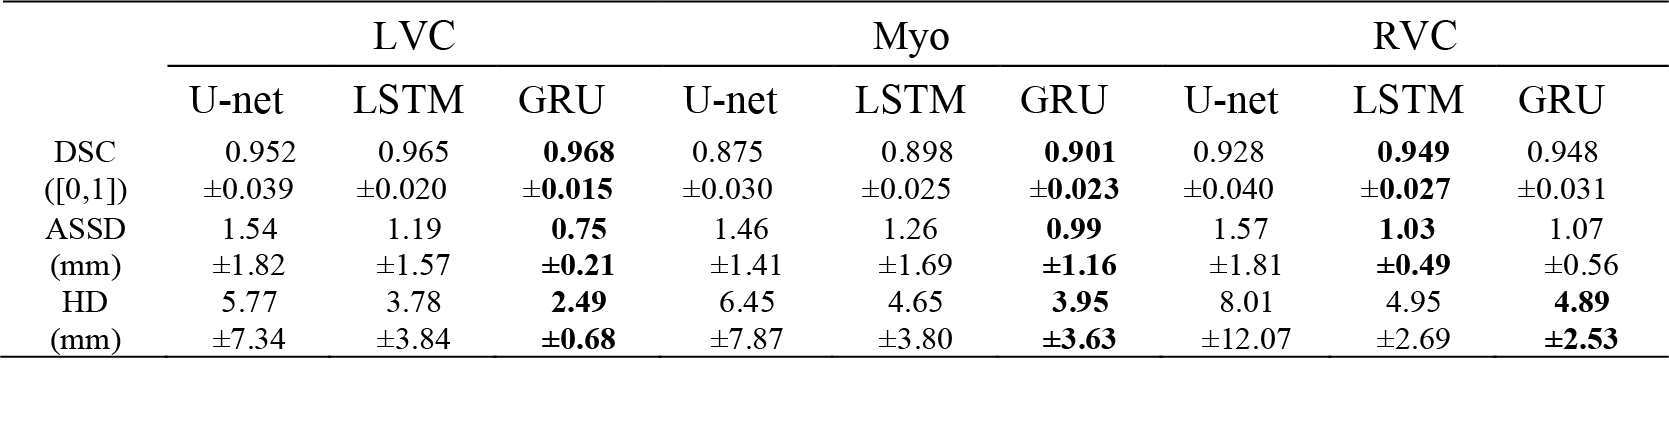
Table 1. LVC, Myo, and RVC segmentation accuracy provided by U-net, LSRM, and GRU (mean±SD) for 50 test subjects at ED. Bold indicates higher accuracy.
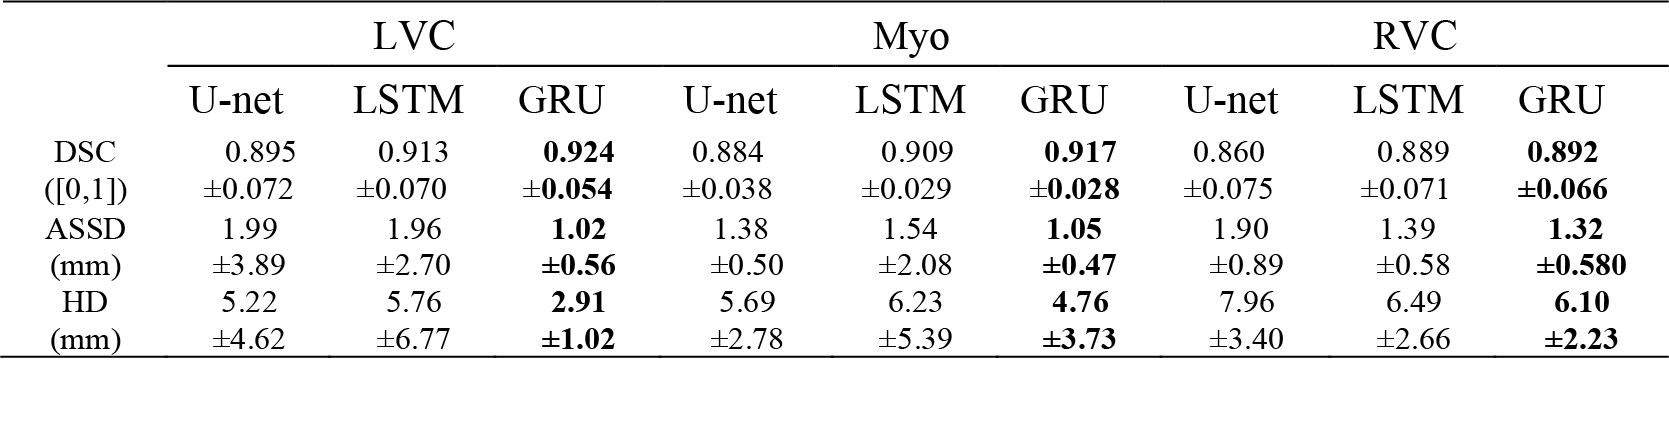
Table 2. LVC, Myo, and RVC segmentation accuracy provided by U-net, LSTM, and GRU (mean±SD) for 50 test subjects at ES. Bold indicates higher accuracy.