2127
Point-Guided 3D U-SAM: MRI abdominal Segmentation Model using 3D Interactive U-Net and Segment Anything Model1Graduate School of Science and Technology, University of Tsukuba, Tsukuba, Japan, 2Department of Radiology, University of Wisconsin-Madison, Madison, WI, United States, 3Department of Radiology, Hamamatsu University School of Medicine, Hamamatsu, Japan
Synopsis
Keywords: Segmentation, Segmentation, Deep Learning, Digestive
Motivation: In abdominal MRI segmentation tasks, the need for high-quality support information for Segment Anything Model (SAM)-driven segmentation in limited data scenarios has motivated the search for an architecture with high performance and minimal support information requirements.
Goal(s): Our objective is to design a user-friendly architecture for segmentation, focusing on using only support information within the region of interest. We aim to verify its high-performance capabilities.
Approach: We developed Point-Guided 3D U-SAM, combining SAM and 3D U-Net with point-based support input. We compared its segmentation performance with existing methods.
Results: The model excelled in abdominal MRI segmentation across various contrast levels, ensuring high performance.
Impact: Point-Guided 3D U-SAM, which combines Segment Anything Model (SAM) and 3D U-Net with point-based inputs, would advance semi-automated organ segmentation, particularly where contrast is poor, such as MRCP, and in abdominal imaging, significantly reducing manual effort in clinical segmentation.
Introduction
In abdominal MR examinations, laborious segmentation tasks such as magnetic resonance cholangiopancreatography must be performed manually1 and automatic segmentation is highly desirable. Previous studies have proposed supervised deep learning-based abdominal segmentation models2,3 trained on data with the same contrast. However, the contrast of actual clinical abdominal MRI images varies from patient to patient, making it difficult to prepare a large datasets with consistent contrast.Meanwhile, interactive segmentation, where the user provides additional information to guide segmentation performs well with a small amount of training data4. Recently, a promptable interactive segmentation model, the segmentation anything model (SAM), has been reported to have high zero-shot segmentation performance on unfamiliar images without additional training5. However, accurate support information is necessary to improve the performance of SAM, and preparing precise information for each image requires a great deal of effort.
Therefore, we propose a Point-Guided 3D U-SAM that performs well on images of various contrasts and is easy to create support information. The prompt form only requires points information within the region to be segmented, making it user-friendly. To improve the accuracy of the prompt information, we introduced a Point-Guided 3D U-Net. The proposed model is easy to use because points information is automatically generated during training.
Method
DatasetTransverse T2-weighted images (T2WI) were selected from CPTAC-PDA6, a public abdomen dataset. The other conditions (imaging scanner, field strength, sequence parameter, etc.) differed from case to case, thus resulting in a variety of image contrasts. Ground truth (GT) segmentation areas of the stomach and duodenum were generated by a trained operator and modified by a board-certified radiologist.
Networks
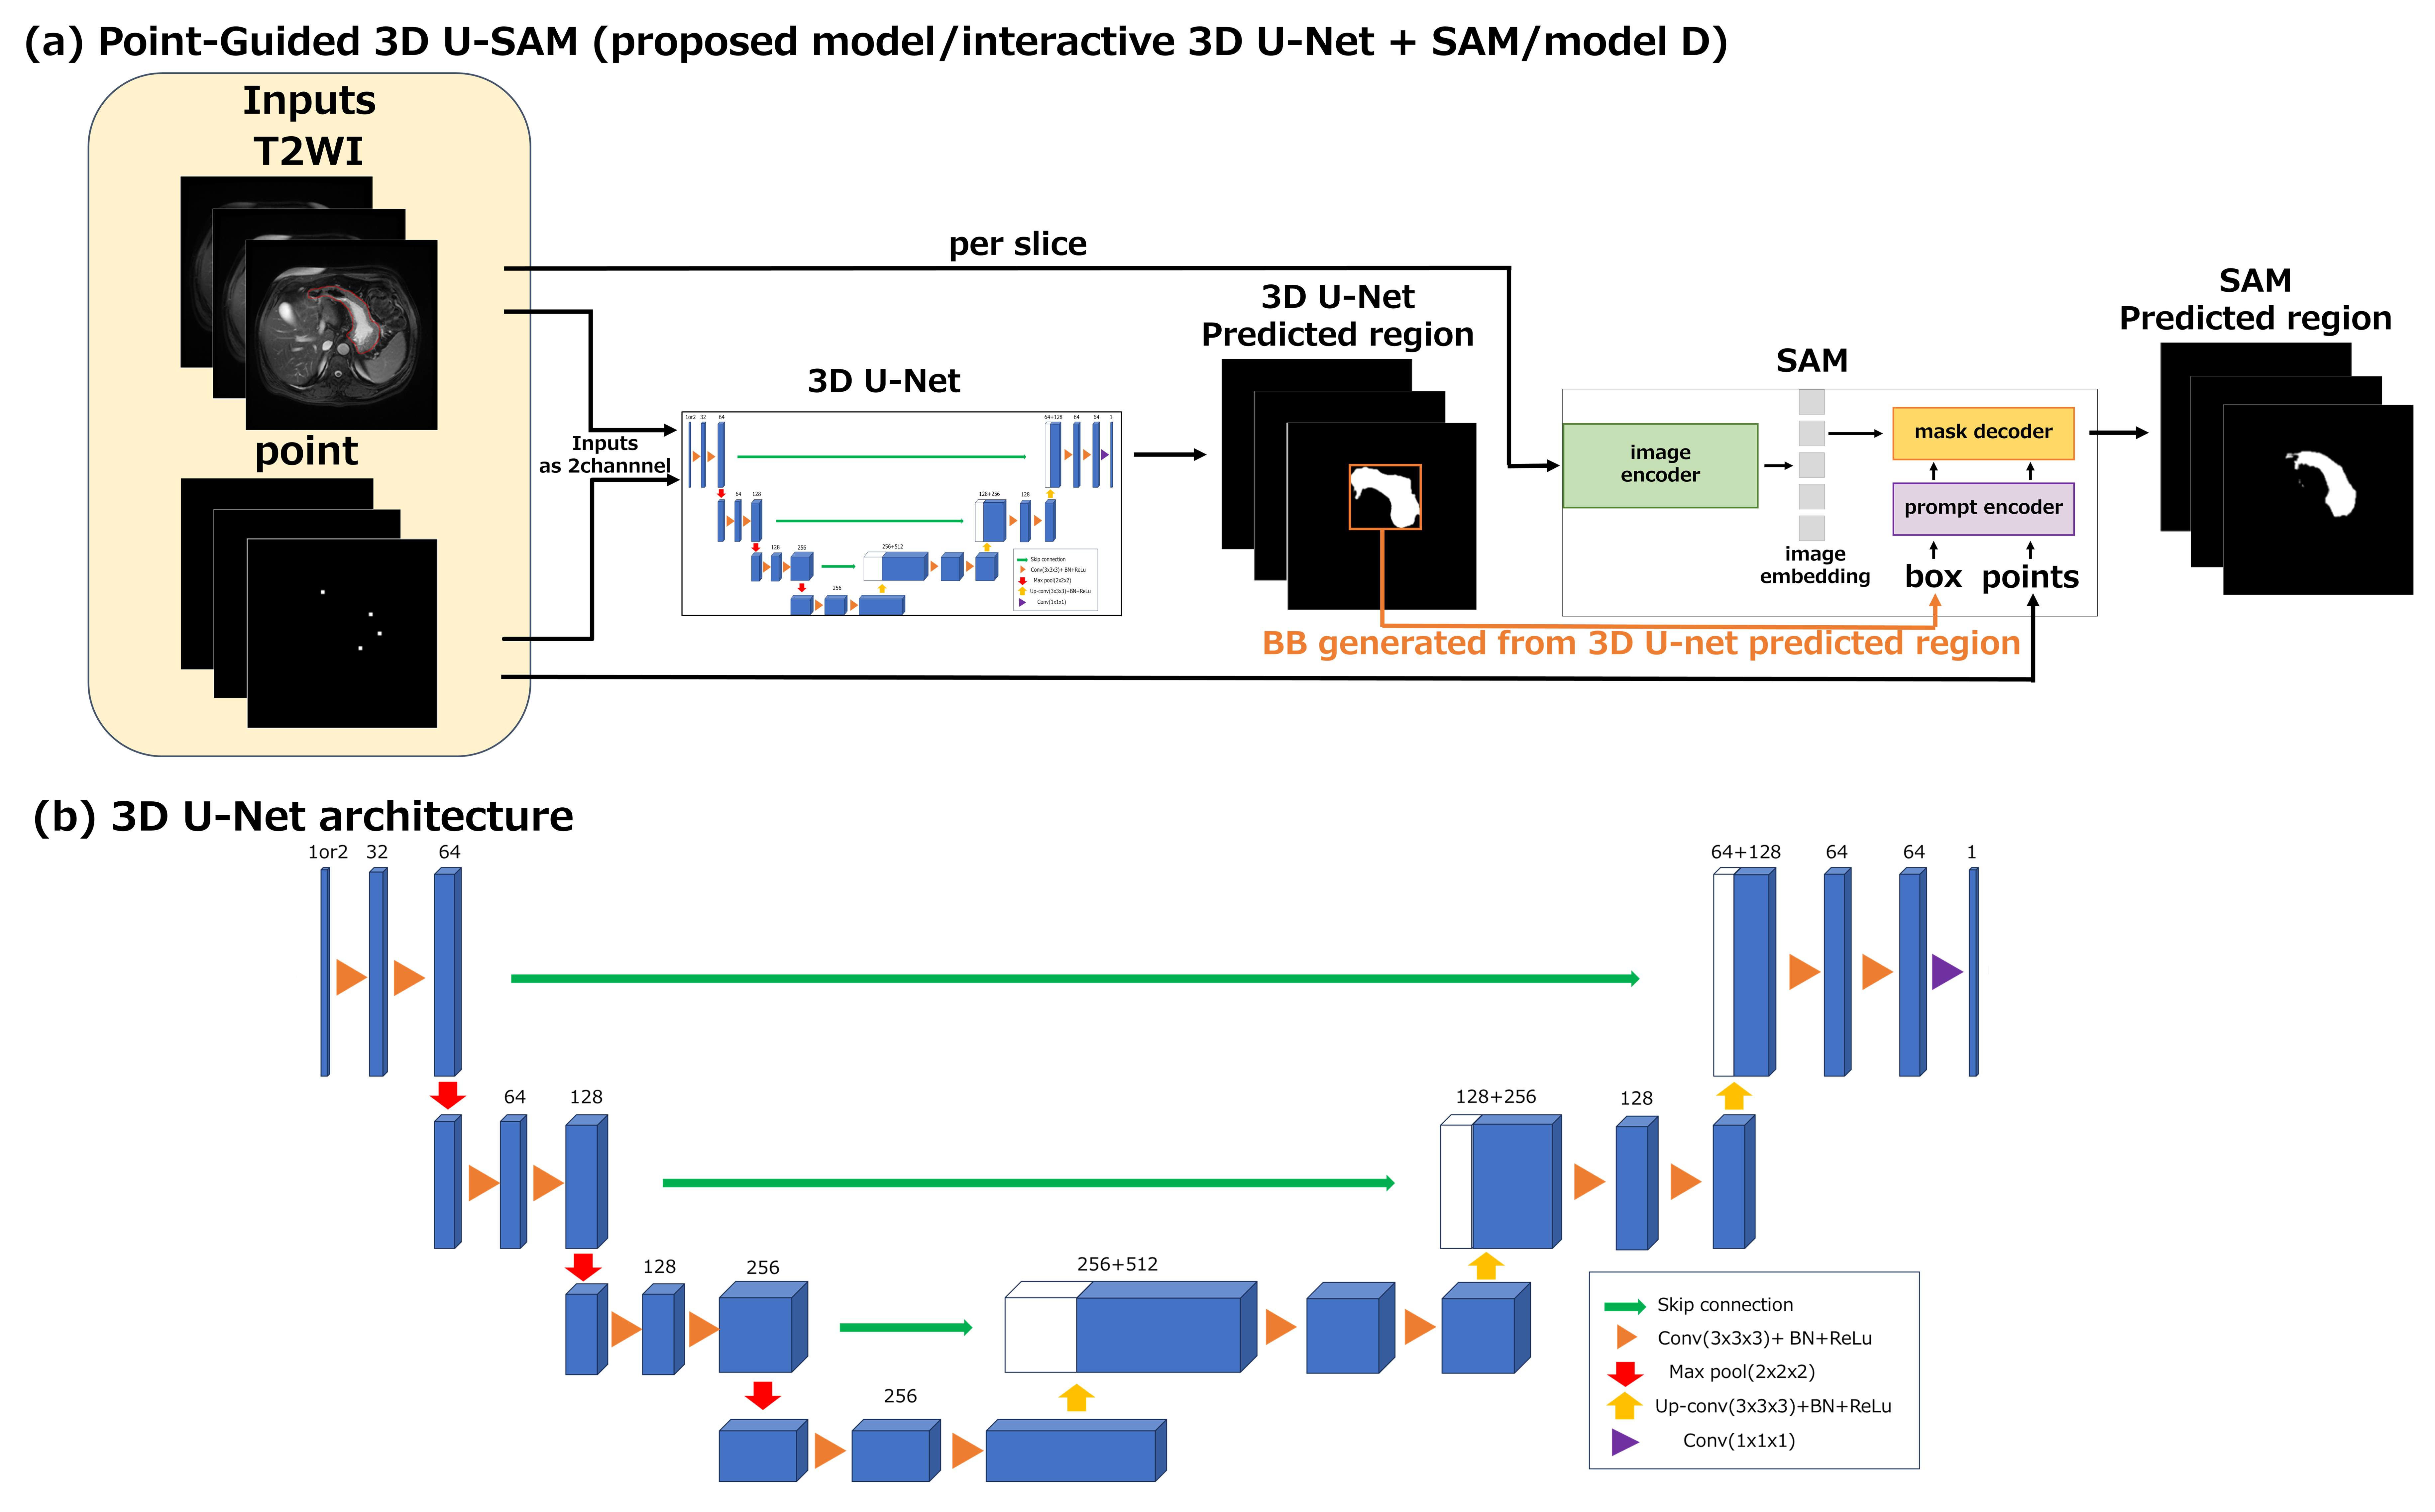
The proposed architecture consisted of an interactive 3D U-Net7 and a SAM (Fig. 1(a)). In the interactive 3D U-Net (Fig. 1(b)), points were input as support information in addition to the T2WI to be segmented. In the SAM, points and a bounding box (BB) were input as prompts in addition to the T2WI. The BB was defined as the region surrounding the label output from the interactive 3D U-Net.
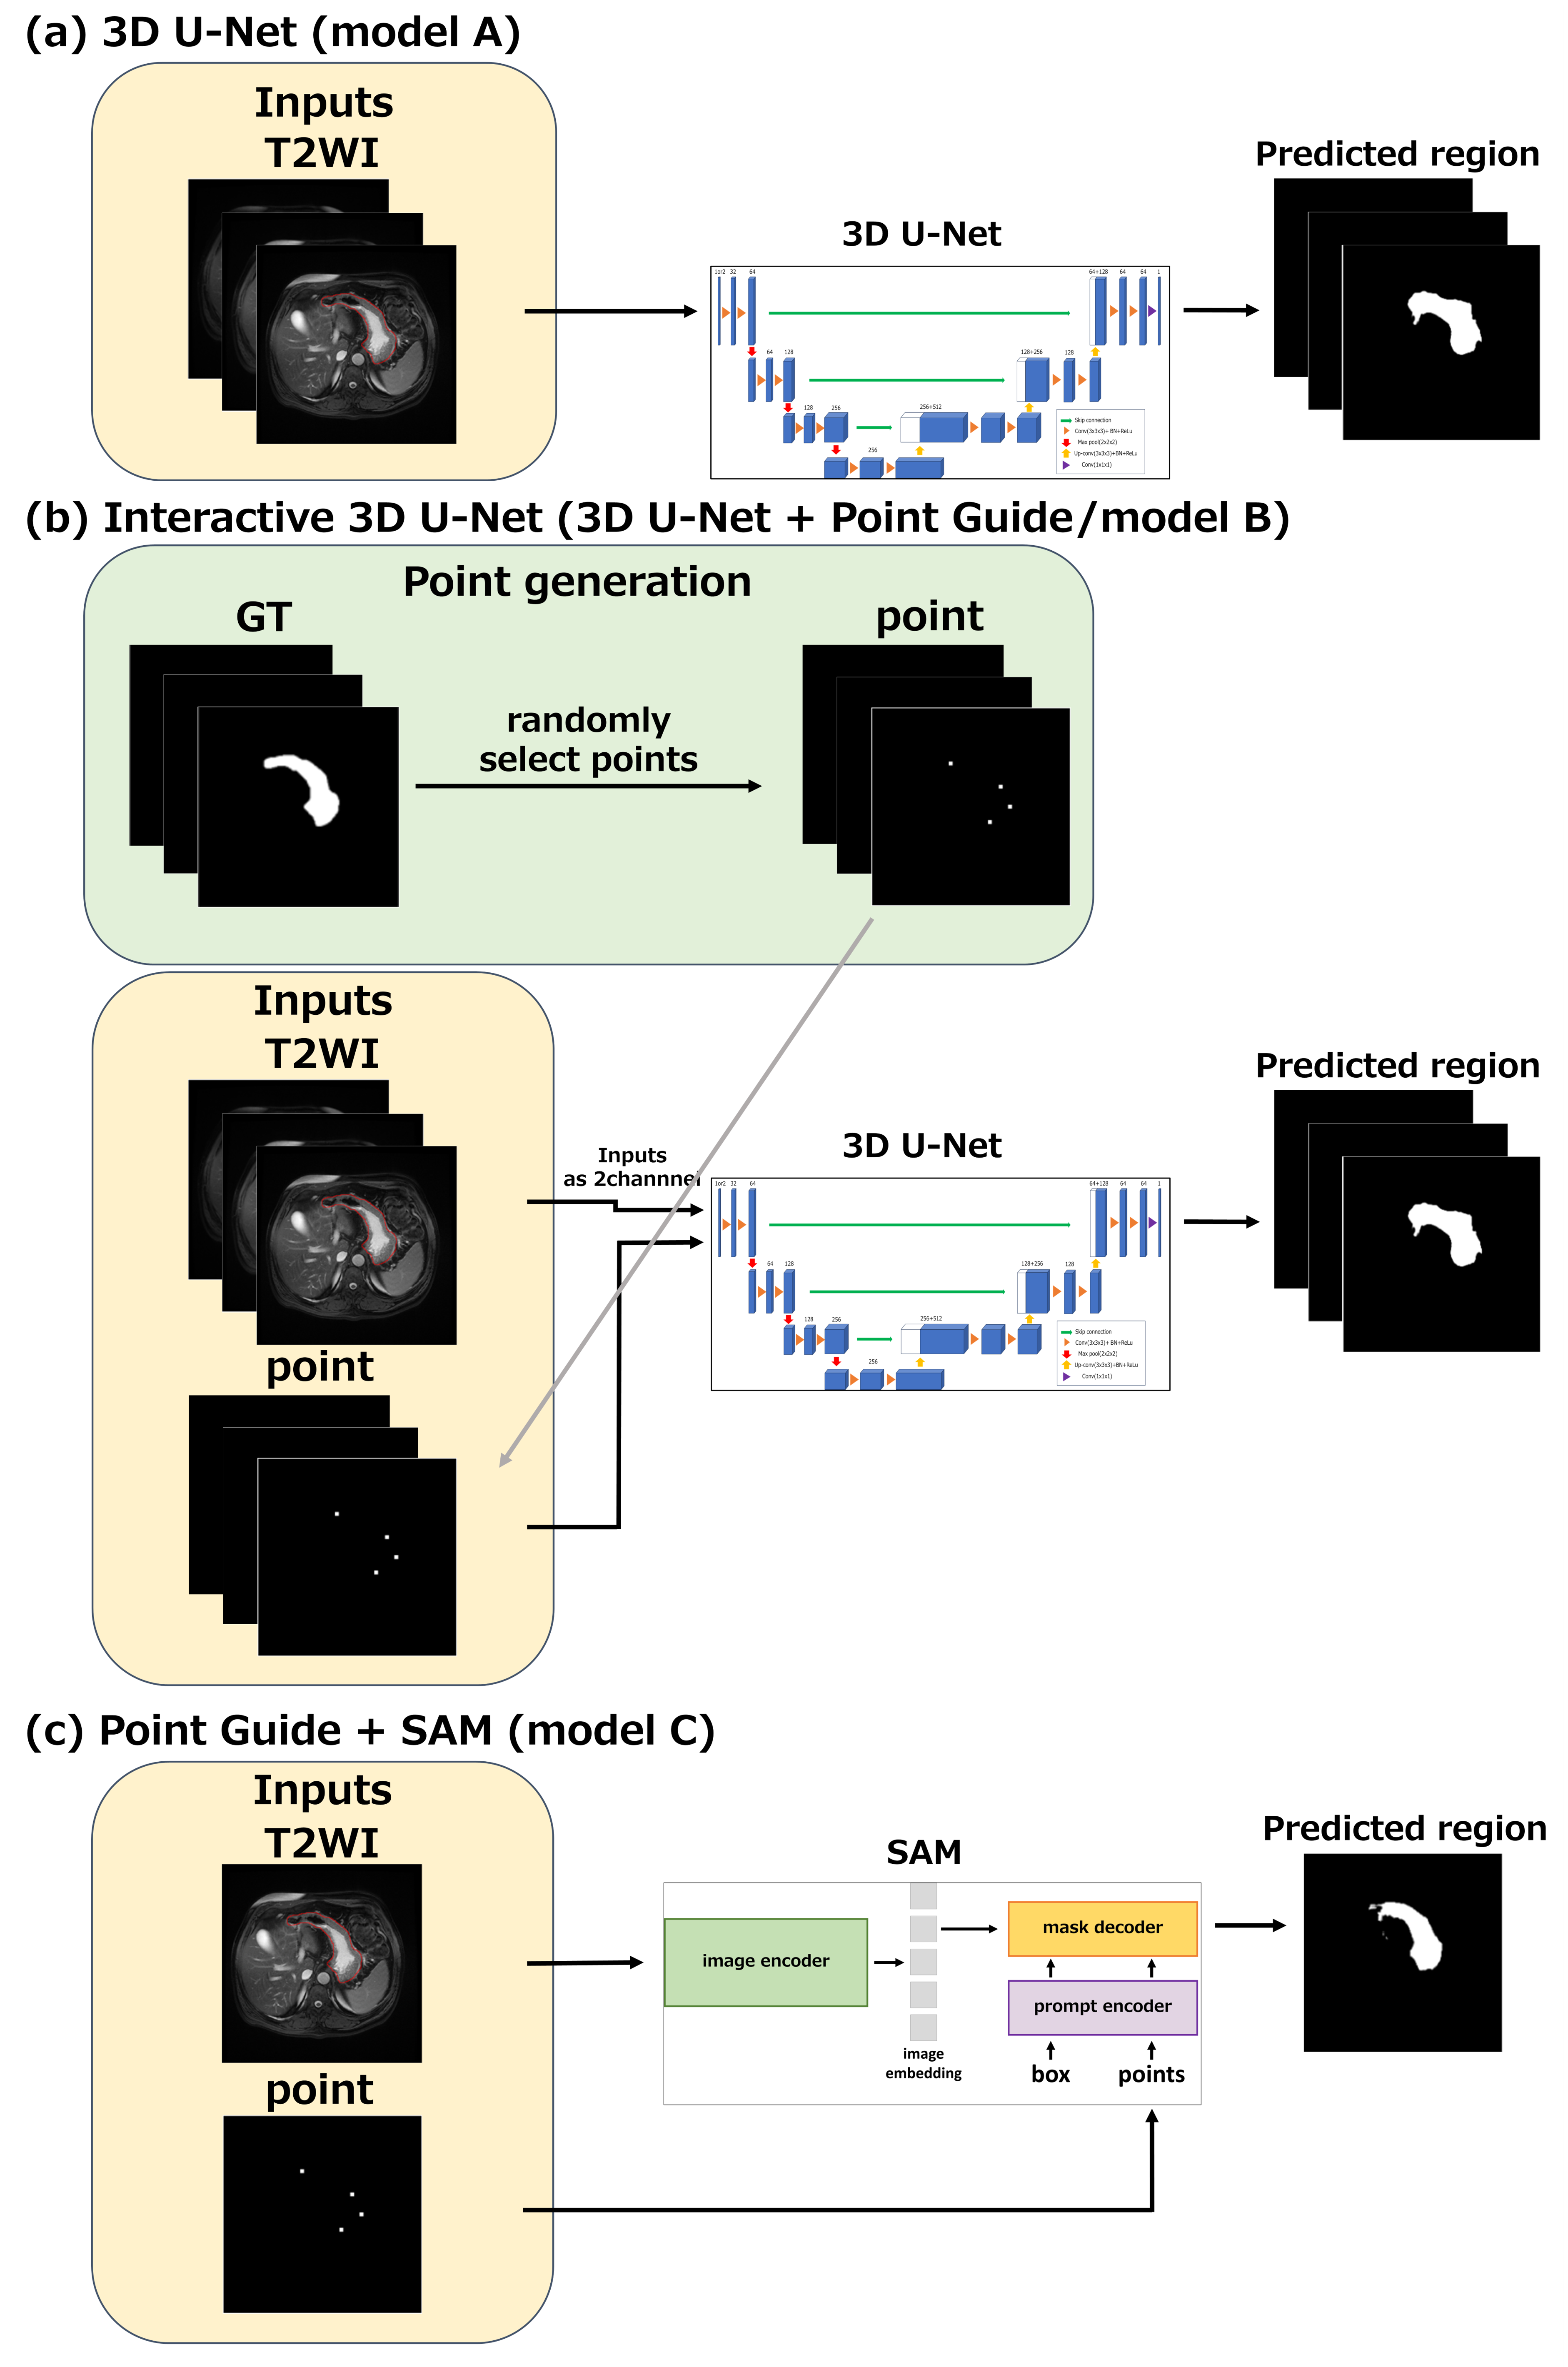
We compared four models as follows:
(A) 3D U-Net
(B) Interactive 3D U-Net (3D U-Net + Point Guide)
(C) Point Guide + SAM
(D) Point-Guided 3D U-SAM (proposed method/(B) + SAM)
Model A was a baseline 3D U-Net (Fig. 2(a)). Model B was the first part of the proposed model (Fig. 2(b)). Model C was the second part of the proposed model and was used for testing only (Fig. 2(c)). Model D was the proposed model, and the trained model B was used as its first part.
For all models, the matrix size of the input images was resized to 256x256x32. The dataset consisted of 14 cases, 12 for training, 1 for validation, and 1 for testing. The hyperparameters are listed in Table 1. Cross-validation was performed, and 13 cases were evaluated.
For models with point guides (B, C, D), support points were randomly selected from GT at each iteration during training and validation (Fig. 2(b)). In testing, support points were fixed. The number of support points ranged from 1 to 8 in training, 4 in validation, and 4 in testing. T2WI and points were combined in the channel direction and used as interactive 3D U-Net input.
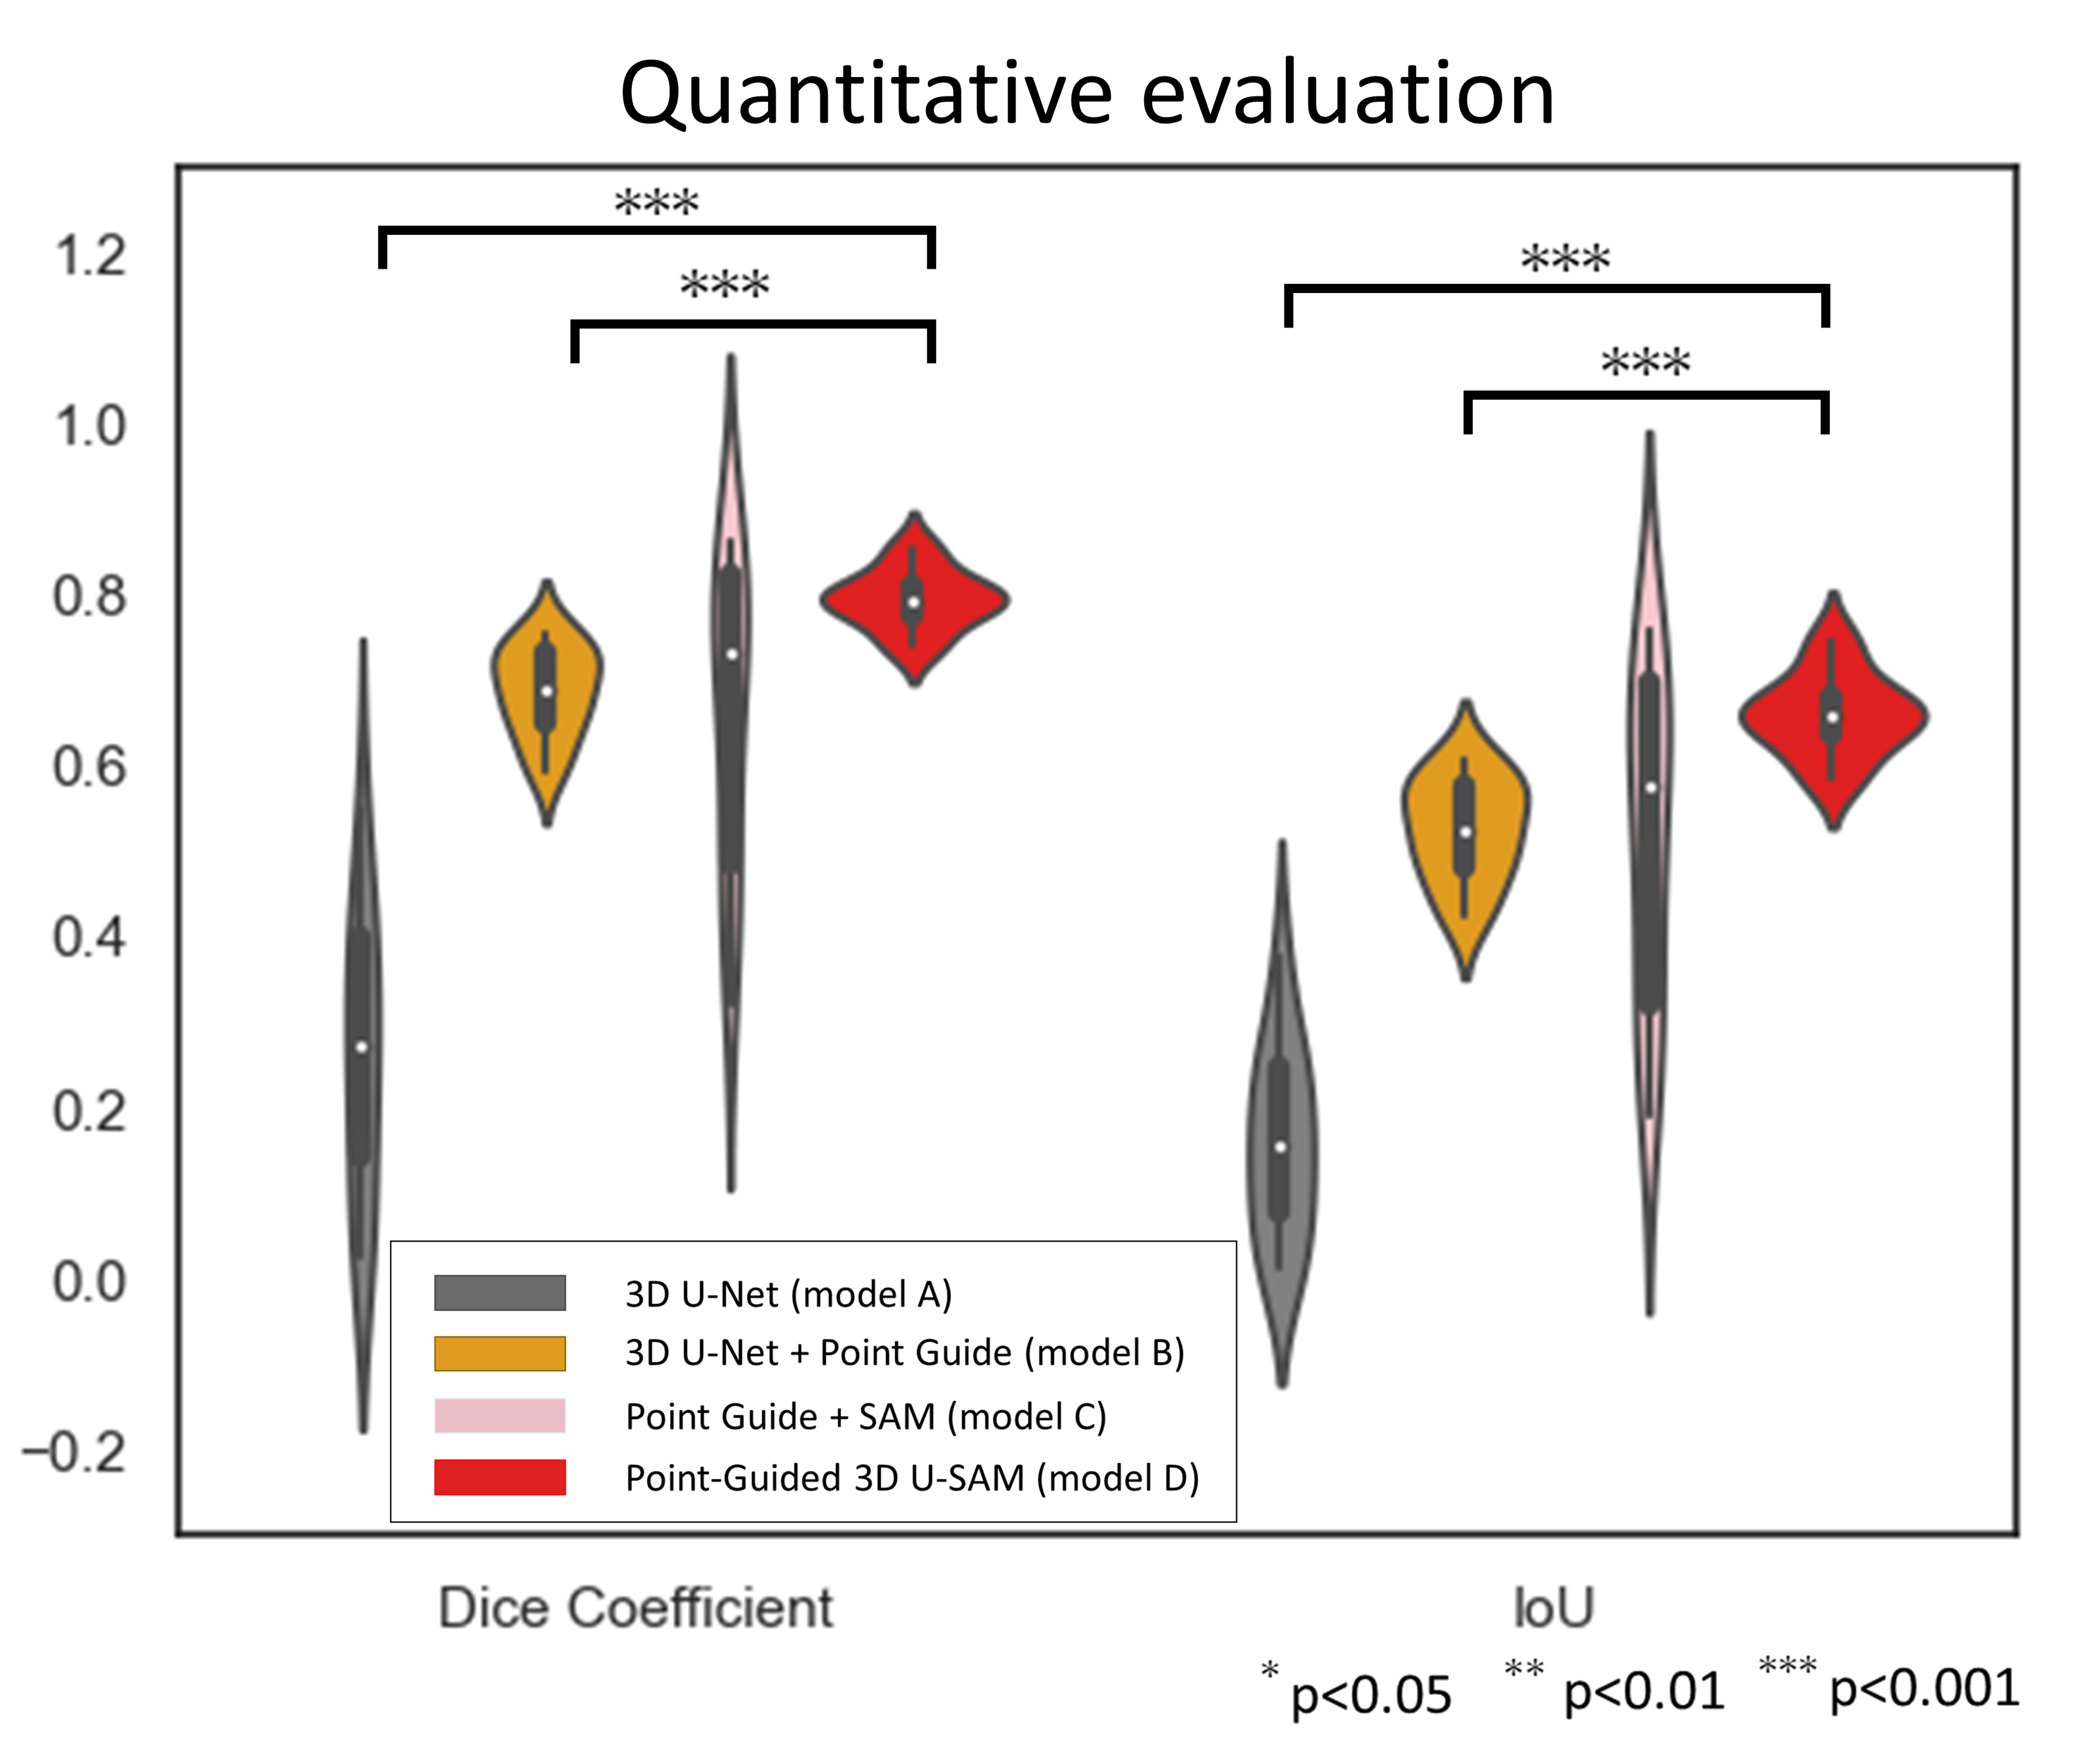
Quantitative evaluation was performed with the Dice coefficient and IoU. Before evaluation, network outputs were binarized using a threshold of 0.5. Differences in scores between models were compared using the Wilcoxon signed-rank test.
Results
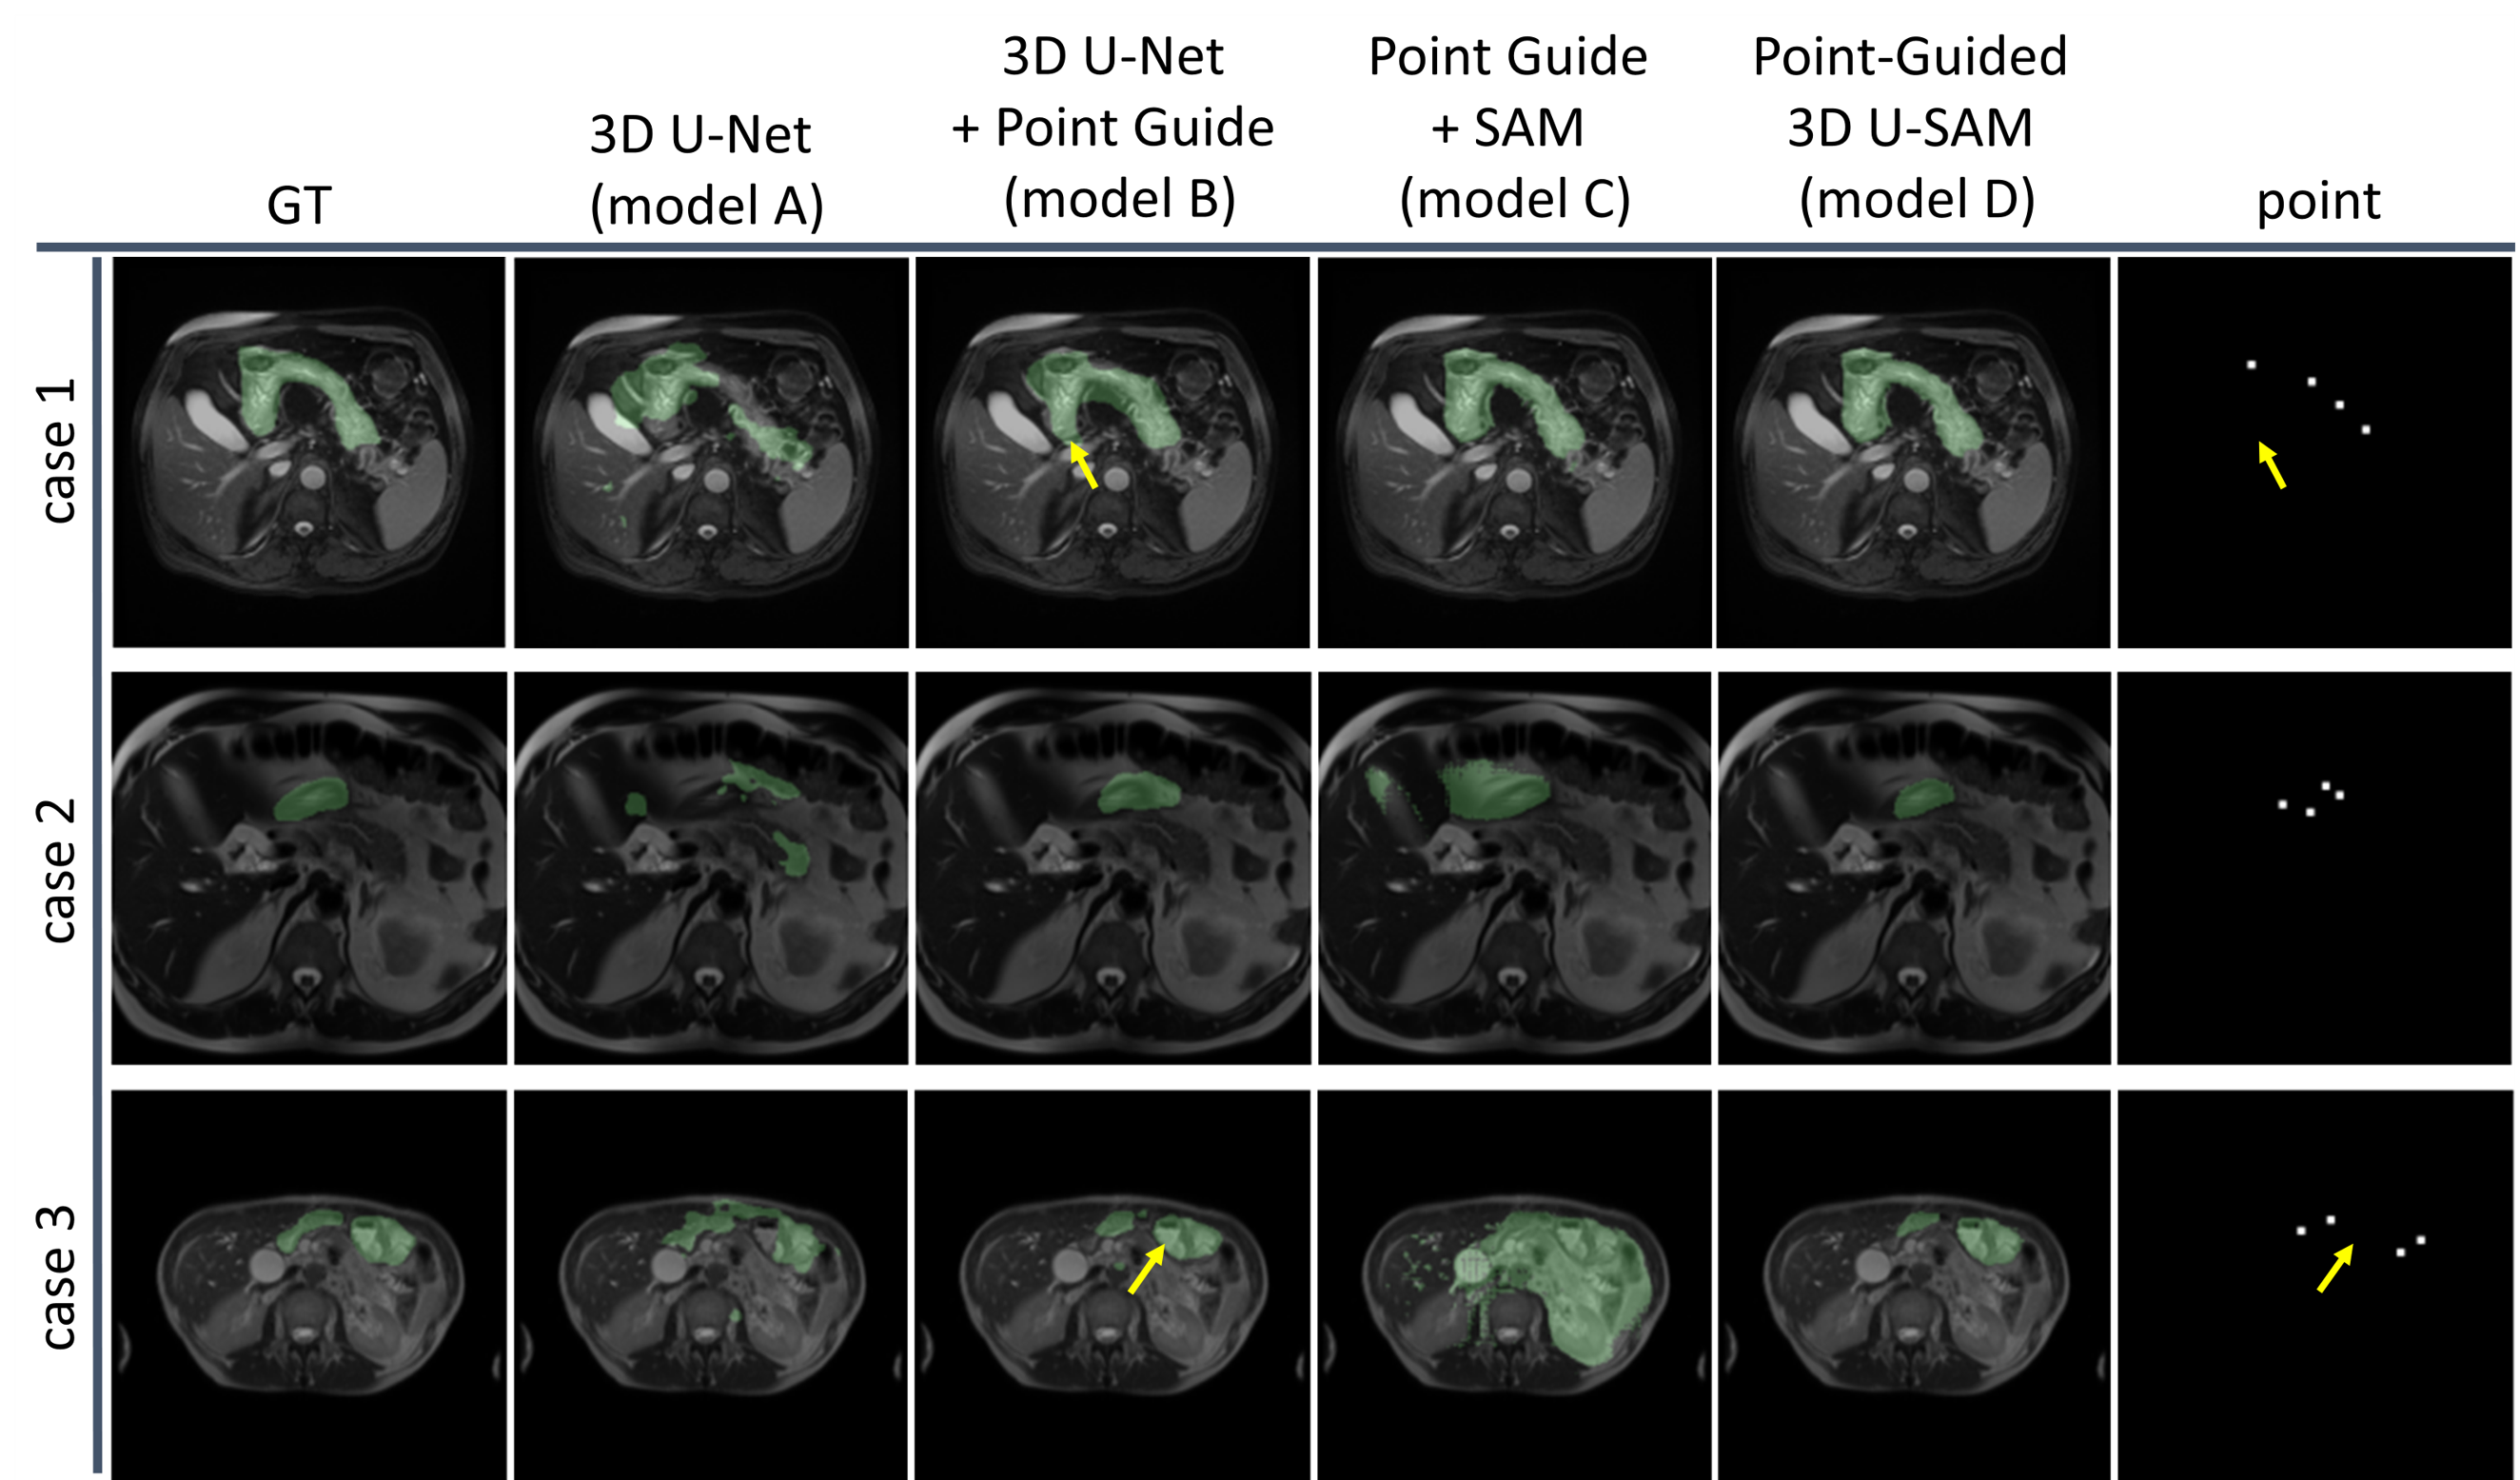
The segmentation area of the proposed model D was closest to that of the GT for cases 1-3 (Fig. 3). Model D showed the highest evaluation scores (Fig. 4). Model B performed significantly better than Model A, segmenting regions away from the guide points with smaller variance in scores. Model C showed comparable scores to Model D in some cases, but the segmented regions differed significantly from the GT in some cases, and the segmentation accuracy varied widely.Discusion
The result that Model B significantly outperformed Model A indicates that the point guide is effective for the abdominal segmentation task. In model D, in addition to the effect of this Point-Guide U-Net, the high segmentation ability of the SAM itself would contribute to the high segmentation performance. The limitations of this study primarily surround the relatively small size of the datasets used and the absence of clinical evaluations.Conclusion
We proposed Point-Guided 3D U-SAM as a segmentation model for abdominal MRI with variable contrast and showed superior performance to U-Net or SAM. The U-Net could be replaced with other networks depending on the task.Acknowledgements
No acknowledgement found.References
1. Kamisawa, T. et al. Diagnosis and clinical implications of pancreatobiliary reflux. World J. Gastroenterol. WJG 14, 6622–6626 (2008).
2. Chen, Y. et al. Fully Automated Multi-Organ Segmentation in Abdominal Magnetic Resonance Imaging with Deep Neural Networks. Med. Phys. 47, 4971–4982 (2020).
3. Furtado, P. Improving Deep Segmentation of Abdominal Organs MRI by Post-Processing. BioMedInformatics 1, 88–105 (2021).
4. Kontogianni, T., Gygli, M., Uijlings, J. & Ferrari, V. Continuous Adaptation for Interactive Object Segmentation by Learning from Corrections. Preprint at https://doi.org/10.48550/arXiv.1911.12709 (2020).
5. Kirillov, A. et al. Segment Anything. Preprint at http://arxiv.org/abs/2304.02643 (2023).
6. National Cancer Institute Clinical Proteomic Tumor Analysis Consortium (CPTAC). The Clinical Proteomic Tumor Analysis Consortium Pancreatic Ductal Adenocarcinoma Collection (CPTAC-PDA). (2018) doi:10.7937/K9/TCIA.2018.SC20FO18.
7. Çiçek, Ö., Abdulkadir, A., Lienkamp, S. S., Brox, T. & Ronneberger, O. 3D U-Net: Learning Dense Volumetric Segmentation from Sparse Annotation. Preprint at http://arxiv.org/abs/1606.06650 (2016).
Figures