2126
Visualization of Thalamic Subnuclei using DiMANI (Diffusion MRI for Anatomical Nuclei Imaging)1CMRR / Radiology, University of Minnesota, Minneapolis, MN, United States, 2Graduate Program in Neuroscience, University of Minnesota, Minneapolis, MN, United States, 3Neurosurgery, University of Minnesota, Minnesota, MN, United States, 4Neurology, University of Minnesota, Minneapolis, MN, United States
Synopsis
Keywords: MR-Guided Interventions, Diffusion/other diffusion imaging techniques
Motivation: Lack of direct visualization methods for thalamic subnuclei has resulted in variable patient outcomes and repeat surgeries in deep brain stimulation (DBS).
Goal(s): To generate images with sufficient intra-thalamic contrast to visualize subnuclei for surgical intervention.
Approach: We introduce DiMANI, an image obtained from combining diffusion-weighted volumes. We compared DiMANI to atlases as well as intra- and post-operative clinical DBS data.
Results: DiMANI showed strong correspondence to anatomical organization from atlases, was highly reproducible, and was observable at both 3T and 7T. Clinical data from six DBS patients corroborated DiMANI’s ability to identify the motor and sensory thalamus locations.
Impact: Visualization of thalamic subnuclei is now achievable using DiMANI, enabling direct targeting for DBS and MR-guided focused ultrasound procedures. This will provide immediate impact by enhancing clinical workflow efficiency, improving patient outcomes and advancing brain networks conception.
Introduction
Visualizing the individual subnuclei of the thalamus using conventional MRI techniques is challenging. This difficulty has posed obstacles in targeting specific subnuclei for clinical interventions, such as deep brain stimulation (DBS) and MR-guided focused ultrasound (MRgFUS), leading to variable patient outcomes1,2 and repeat surgeries3. Several imaging methods have been developed for direct visualization, including susceptibility weighted imaging4,5, quantitative magnetic susceptibility mapping6,7, and white-matter nulled T1 imaging, such as FGATIR8, 3D-EDGE9, and WMn-MPRAGE10. While these methods provide enhanced visualizations, they have drawbacks that make them difficult to use routinely in the clinic. Here, we present DiMANI, a novel method for directly visualizing thalamic subnuclei using diffusion MRI (dMRI).Methods
One healthy control and six essential tremor patients were recruited and scanned on a 7T Siemens MRI scanner. Additionally, 3T and 7T data of a single Human Connectome Project (HCP) control subject were used. After standard preprocessing, including FSL’s eddy and topup to correct for eddy currents and distortions, the DiMANI contrast was computed by taking the mean, voxelwise, of diffusion-weighted volumes (e.g., b =1500s/mm2). We compared the resulting contrast with the THOMAS10 and Morel atlases11 after bringing these templates to native space using non-linear registrations for the Morel atlas or distributed code, for THOMAS (https://github.com/thalamicseg/thomas_new). We evaluated the reproducibility of DiMANI by computing dice coefficients on manual segmentations performed on a unique dataset comprising eight scans of a single participant collected over a 3-year period. We also quantitatively assessed manual segmentations of thalamic subnuclei for inter-rater reliability (3 raters and 5 patients). Then, we qualitatively correlated DiMANI imaging data with intra-operative electrophysiology (for subnucleus identification), post-operative computed tomography (for DBS lead location), and clinical evaluations (final DBS stimulation settings). Lastly, we demonstrated that DiMANI can provide similar features at 3T and 7T MRI.Results
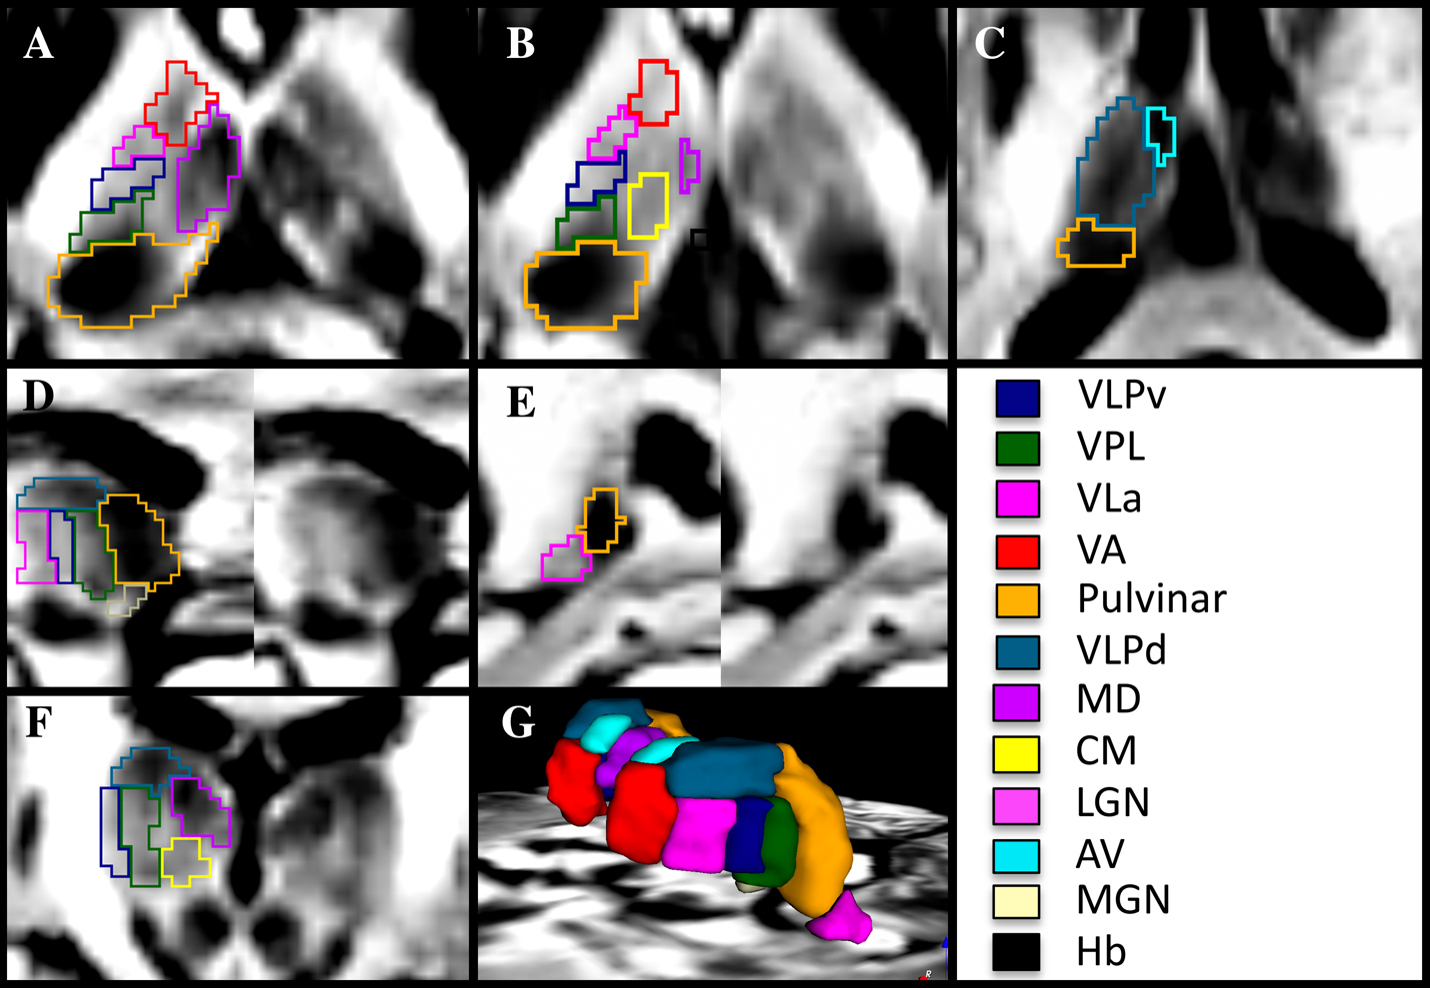
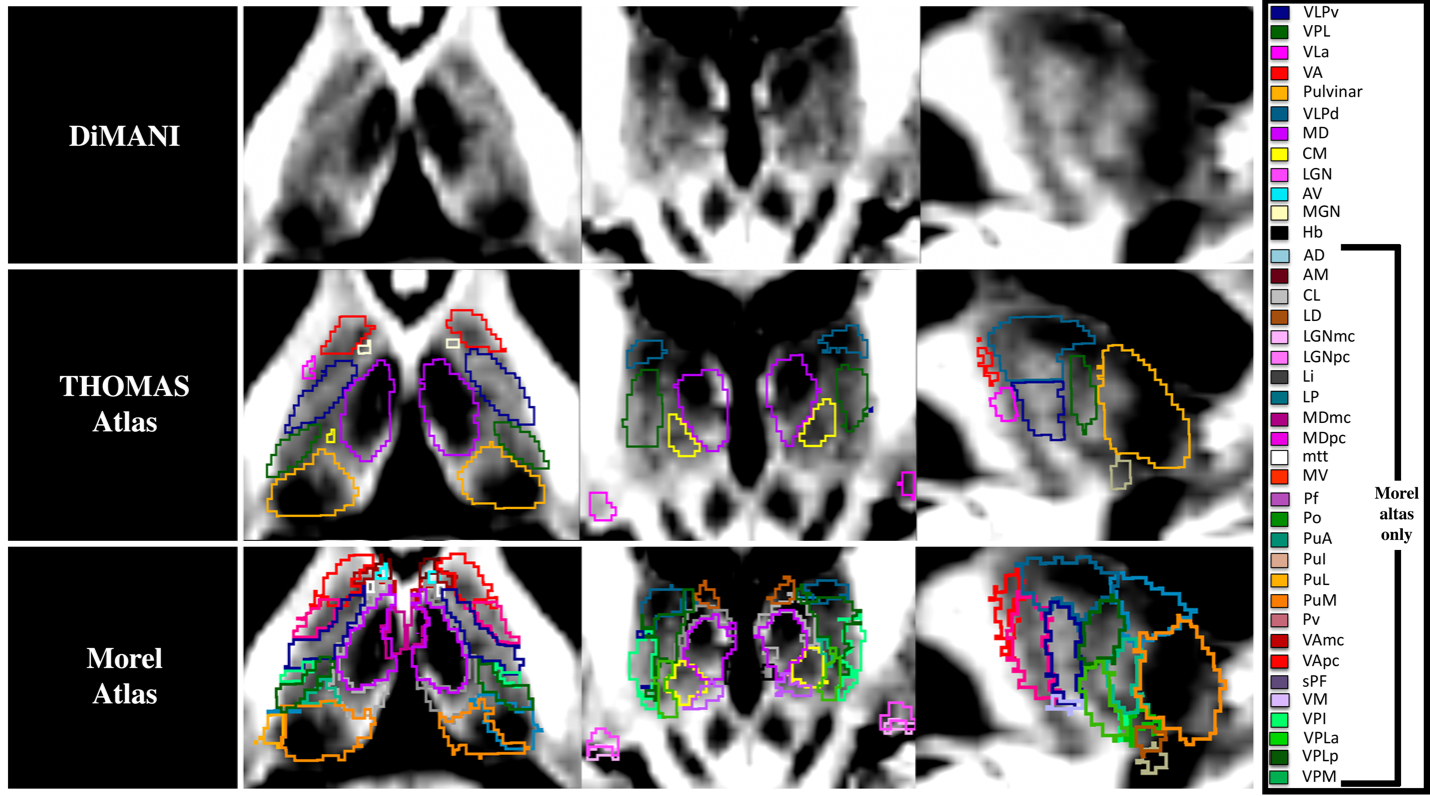
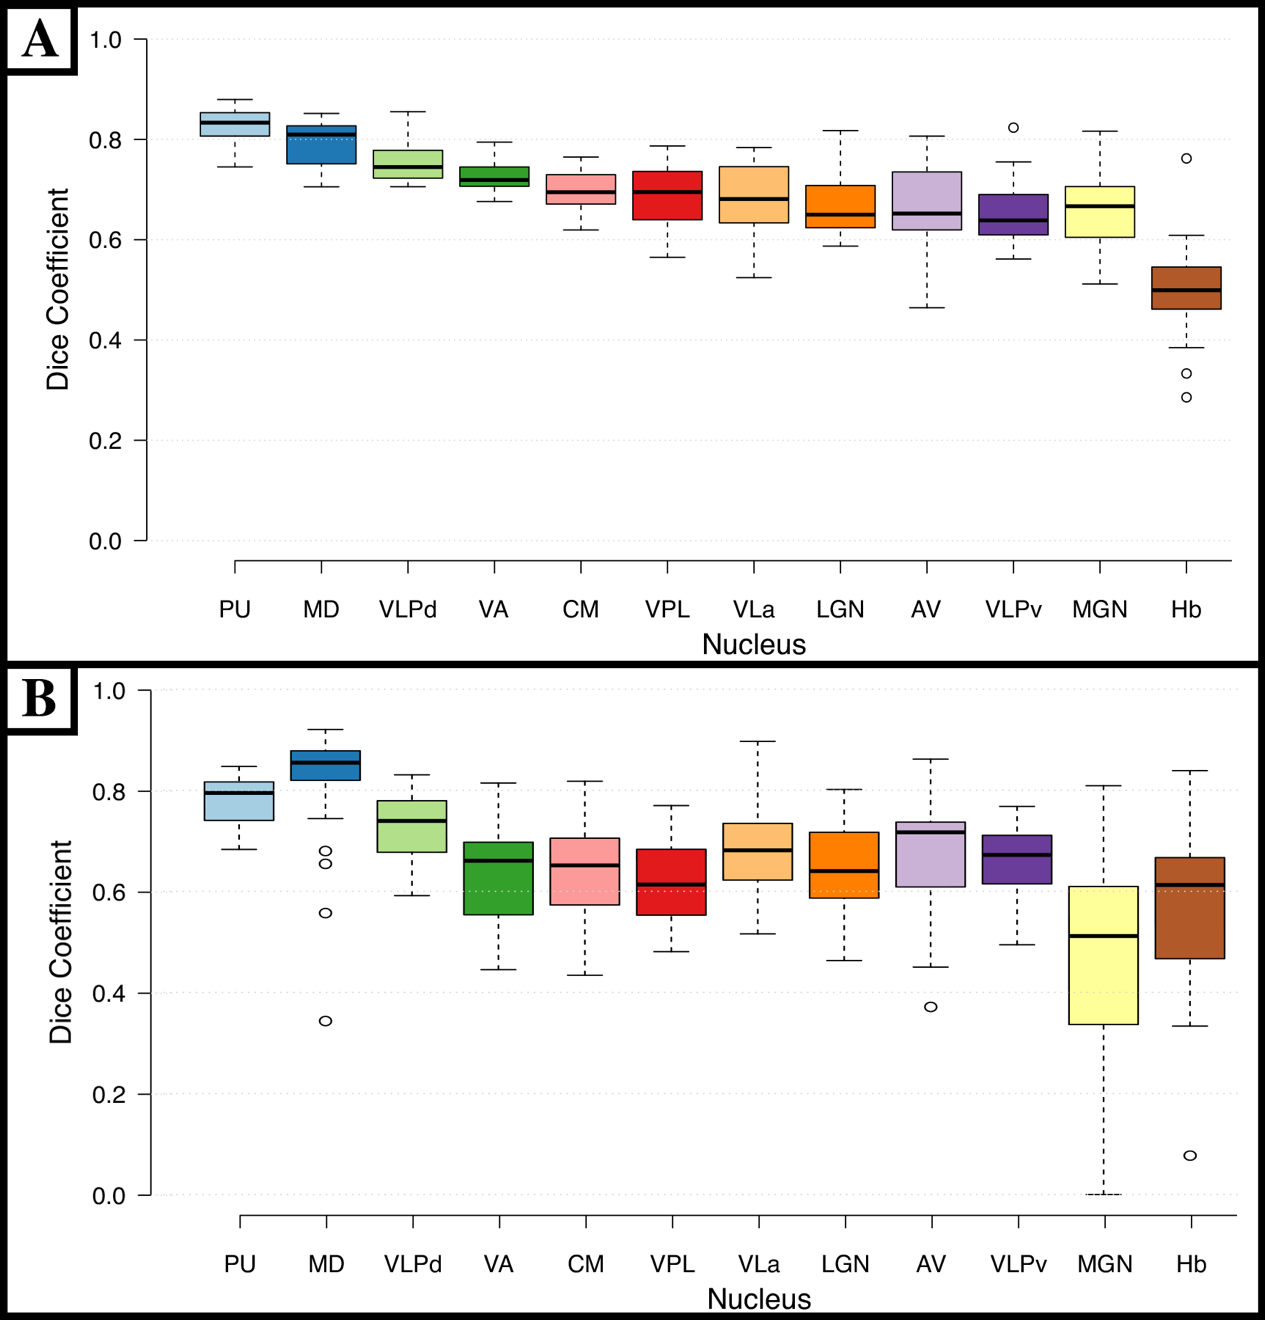
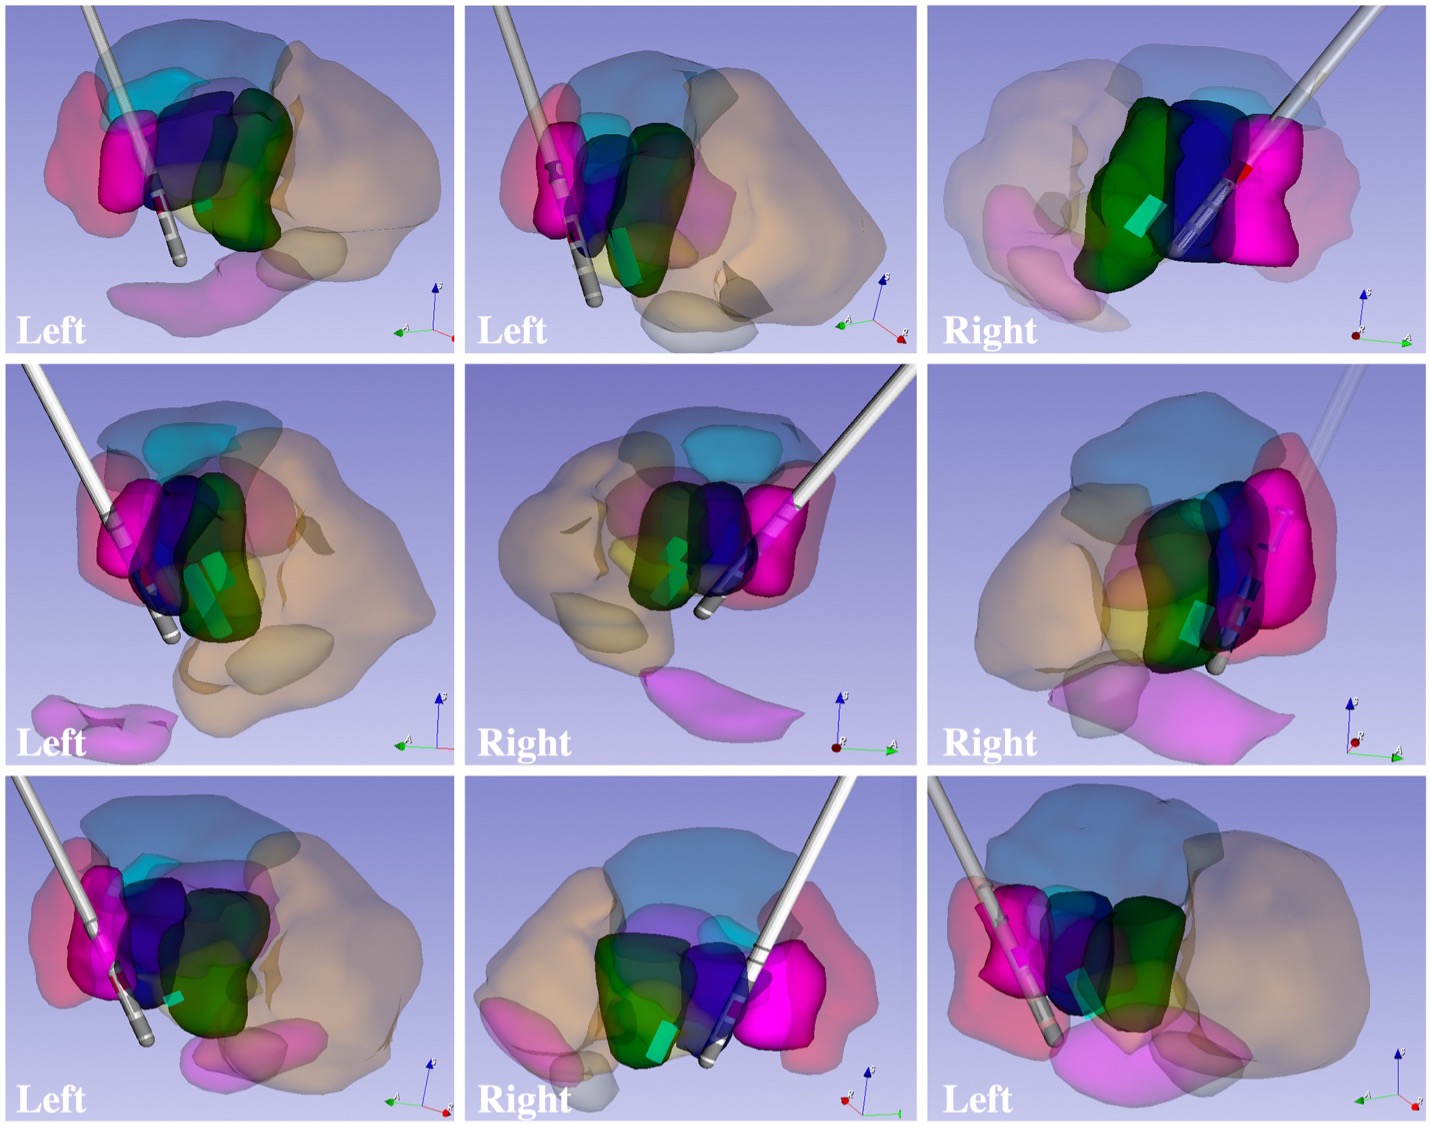
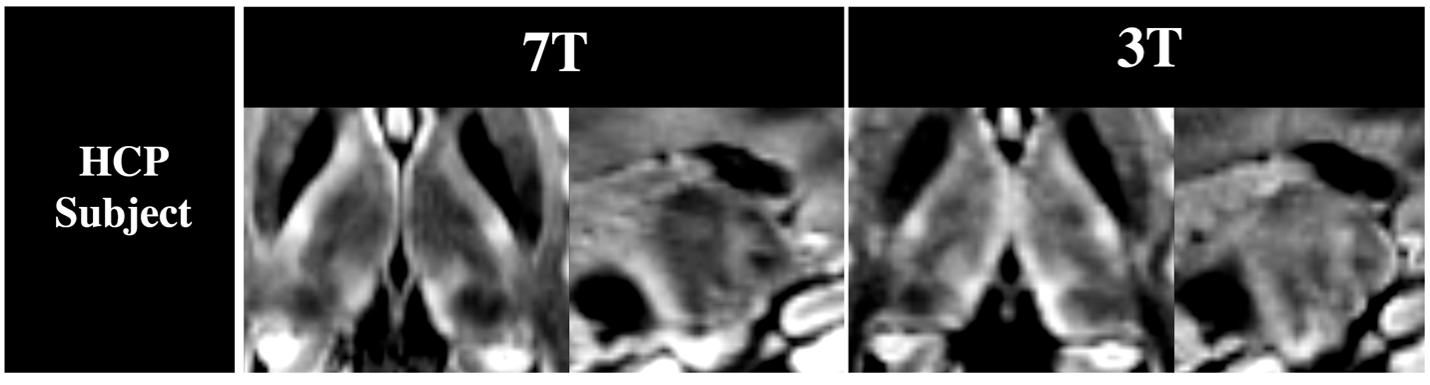
DiMANI provides enhanced contrast and enables direct visualization of thalamic subnuclei, including their borders (see Figure1 for manual segmentations). Figure 2 shows that the DiMANI contrast corresponds to the overall organization of the THOMAS and Morel atlases (results are overlayed on the DiMANI image). Of note, the DiMANI contrast also enables visualization of some subnuclei present in the Morel atlas but not in the THOMAS atlas. Figure 3A shows the Dice coefficients (DCs) for the manual segmentation, performed on eight scans from the same subject, of the twelve visible subnuclei following the THOMAS atlas as a guide. This resulted in fourteen DCs per subnuclei (seven left and right). The averaged DCs were all between 0.62 and 0.85 except for the small Hb nucleus (DC = 0.50). Figure 3B shows the results for the inter-rater reliability. Each of the twelve subnuclei were segmented independently by three raters yielding 120 manual segmentations per rater. This resulted in comparable DCs to those obtained from the test-retest analysis (average DCs ranging from 0.46 to 0.81). DiMANI contrast allows the segmentation and creation of 3D patient-specific models that depict the location of individual thalamic subnuclei. We used neurophysiological data to test the validity of the DiMANI-based models by correlating the locations of the DBS electrodes and the stimulating contacts with the target subnuclei. Figure 4 shows that all nine active DBS contacts were at or near the ventral lateral posterior (VLPv) – ventral lateral anterior (VLa) border, which is consistent with expected lead locations. Additionally, 11 of 12 micro-electrode recording tracks, showed that regions of activity interpreted as neuronal firing of cells belonging to the ventral posterior lateral (VPL) overlapped fully with the manual segmentations of the VPL. The twelfth was found just anterior to VPL within VLPv. Figure 5 shows that many of the thalamic subnuclei are visible with the DiMANI contrast at two field strengths, using different acquisition parameters. Both HCP datasets, coming from the same subject, show repeatable features akin to those seen with our data.Discussion and Conclusion
Here, we introduce the DiMANI method, an image contrast based on dMRI. DiMANI enables direct visualization of a large number of thalamic subnuclei that are not easily visible with other methods. DiMANI has potential for significant impact as it offers an immediate translation to clinical applications by providing direct visualization of thalamic subnuclei, which can assist in segmentations, targeting and optimizations of thalamic-based therapies, such as DBS and MRgFUS. While this proof-of-concept may suffer from common limitations of dMRI data (distortion, SNR, resolution), future work will utilize existing dMRI acquisition and post-processing methods that can remedy these issues to optimize DiMANI translational capabilities. This relatively simple method shows promise and could be useful to the research and clinical community alike.Acknowledgements
This study was funded by the following National Institution of Health Grants: R01 NS081118, R01 NS113746, S10 OD025256, P41EB027061 and P50 NS123109; Winston and Maxine Wallin Neuroscience discovery Fund award (awarded to RP).References
1. Flora ED, Perera CL, Cameron AL, Maddern GJ. Deep brain stimulation for essential tremor: a systematic review. Mov Disord. Aug 15 2010;25(11):1550-9. doi:10.1002/mds.231952.
2. Agrawal M, Garg K, Samala R, Rajan R, Naik V, Singh M. Outcome and Complications of MR Guided Focused Ultrasound for Essential Tremor: A Systematic Review and Meta-Analysis. Front Neurol. 2021;12:654711. doi:10.3389/fneur.2021.6547113.
3. Rolston JD, Englot DJ, Starr PA, Larson PS. An unexpectedly high rate of revisions and removals in deep brain stimulation surgery: Analysis of multiple databases. Parkinsonism Relat Disord. Dec 2016;33:72-77. doi:10.1016/j.parkreldis.2016.09.0144.
4. Abosch A, Yacoub E, Ugurbil K, Harel N. An assessment of current brain targets for deep brain stimulation surgery with susceptibility-weighted imaging at 7 tesla. Neurosurgery. Dec 2010;67(6):1745-56; discussion 1756. doi:10.1227/NEU.0b013e3181f741055.
5. Najdenovska E, Tuleasca C, Jorge J, et al. Comparison of MRI-based automated segmentation methods and functional neurosurgery targeting with direct visualization of the Ventro-intermediate thalamic nucleus at 7T. Sci Rep. Feb 04 2019;9(1):1119. doi:10.1038/s41598-018-37825-86.
6. Chiang GC, Hu J, Morris E, Wang Y, Gauthier SA. Quantitative Susceptibility Mapping of the Thalamus: Relationships with Thalamic Volume, Total Gray Matter Volume, and T2 Lesion Burden. AJNR Am J Neuroradiol. Mar 2018;39(3):467-472. doi:10.3174/ajnr.A55377.
7. Deistung A, Schäfer A, Schweser F, Biedermann U, Turner R, Reichenbach JR. Toward in vivo histology: a comparison of quantitative susceptibility mapping (QSM) with magnitude-, phase-, and R2*-imaging at ultra-high magnetic field strength. Neuroimage. Jan 15 2013;65:299-314. doi:10.1016/j.neuroimage.2012.09.0558.
8. Sudhyadhom A, Haq IU, Foote KD, Okun MS, Bova FJ. A high resolution and high contrast MRI for differentiation of subcortical structures for DBS targeting: the Fast Gray Matter Acquisition T1 Inversion Recovery (FGATIR). Neuroimage. Aug 2009;47 Suppl 2:T44-52. doi:10.1016/j.neuroimage.2009.04.0189.
9. Middlebrooks EH, Okromelidze L, Lin C, et al. Edge-enhancing gradient echo with multi-image co-registration and averaging (EDGE-MICRA) for targeting thalamic centromedian and parafascicular nuclei. Neuroradiol J. Dec 2021;34(6):667-675. doi:10.1177/1971400921102178110.
10. Su JH, Thomas FT, Kasoff WS, et al. Thalamus Optimized Multi Atlas Segmentation (THOMAS): fast, fully automated segmentation of thalamic nuclei from structural MRI. Neuroimage. Jul 01 2019;194:272-282. doi:10.1016/j.neuroimage.2019.03.02111.
11. Morel A, Magnin M, Jeanmonod D. Multiarchitectonic and stereotactic atlas of the human thalamus. J Comp Neurol. Nov 03 1997;387(4):588-630. doi:10.1002/(sici)1096-9861(19971103)387:4<588::aid-cne8>3.0.co;2-z
Figures