2121
Open-Source Automatic Whole and Subchondral Bone Segmentation using a Deep-Learning-Based Framework, DOSMA1Radiology, Stanford University, Stanford, CA, United States, 2Rigshospitalet, Copenhagen University Hospital, Copenhagen, Denmark, 3Stanford University, Stanford, CA, United States
Synopsis
Keywords: Segmentation, Segmentation, Bone, Knee MRI, Pipeline, AI
Motivation: [18F]NaF PET imaging is a promising technique to study the role of bone metabolism in joint diseases such as osteoarthritis. To ease the corresponding burden of segmentations and data analysis, we developed an automated pipeline.
Goal(s): We developed a new automated pipeline for knee bone segmentations. We validated the creation of subchondral bone masks for applications to [18F]NaF PET imaging by measuring changes in PET measures.
Approach: We developed an automated segmentation pipeline for bone segmentations and validated the results for PET imaging.
Results: DOSMA automated segmentations perform highly for bones and show applicability for quantitative musculoskeletal analysis.
Impact: Our automated bone segmentation and PET data analysis pipeline enables a streamlined way of automating PET-MRI processing, including registration, segmentation, quantitative mapping, and visualization of outcome measures.
Introduction
[18F]NaF PET imaging is a promising technique to study the role of bone metabolism in joint diseases such as osteoarthritis (OA). Combined with MRI, it allows the understanding of the complex tissue interactions that occur in OA and in response to loading. However, this also adds to the time-consuming data analysis and tissue segmentations already present in quantitative knee MRI. One approach to this challenge is the usage of DOSMA (Deep Open-Source Medical Image Analysis), an open-source Python-based deep-learning framework for musculoskeletal MRI analysis1. It automates MR processing from registration to segmentation of cartilage and meniscus.In this work, we developed and implemented a new DOSMA-based pipeline for segmentation of bones (femur, tibia, patella). We validated the creation of subchondral bone masks for applications to PET imaging by measuring changes in PET parameters.
Background & Methods
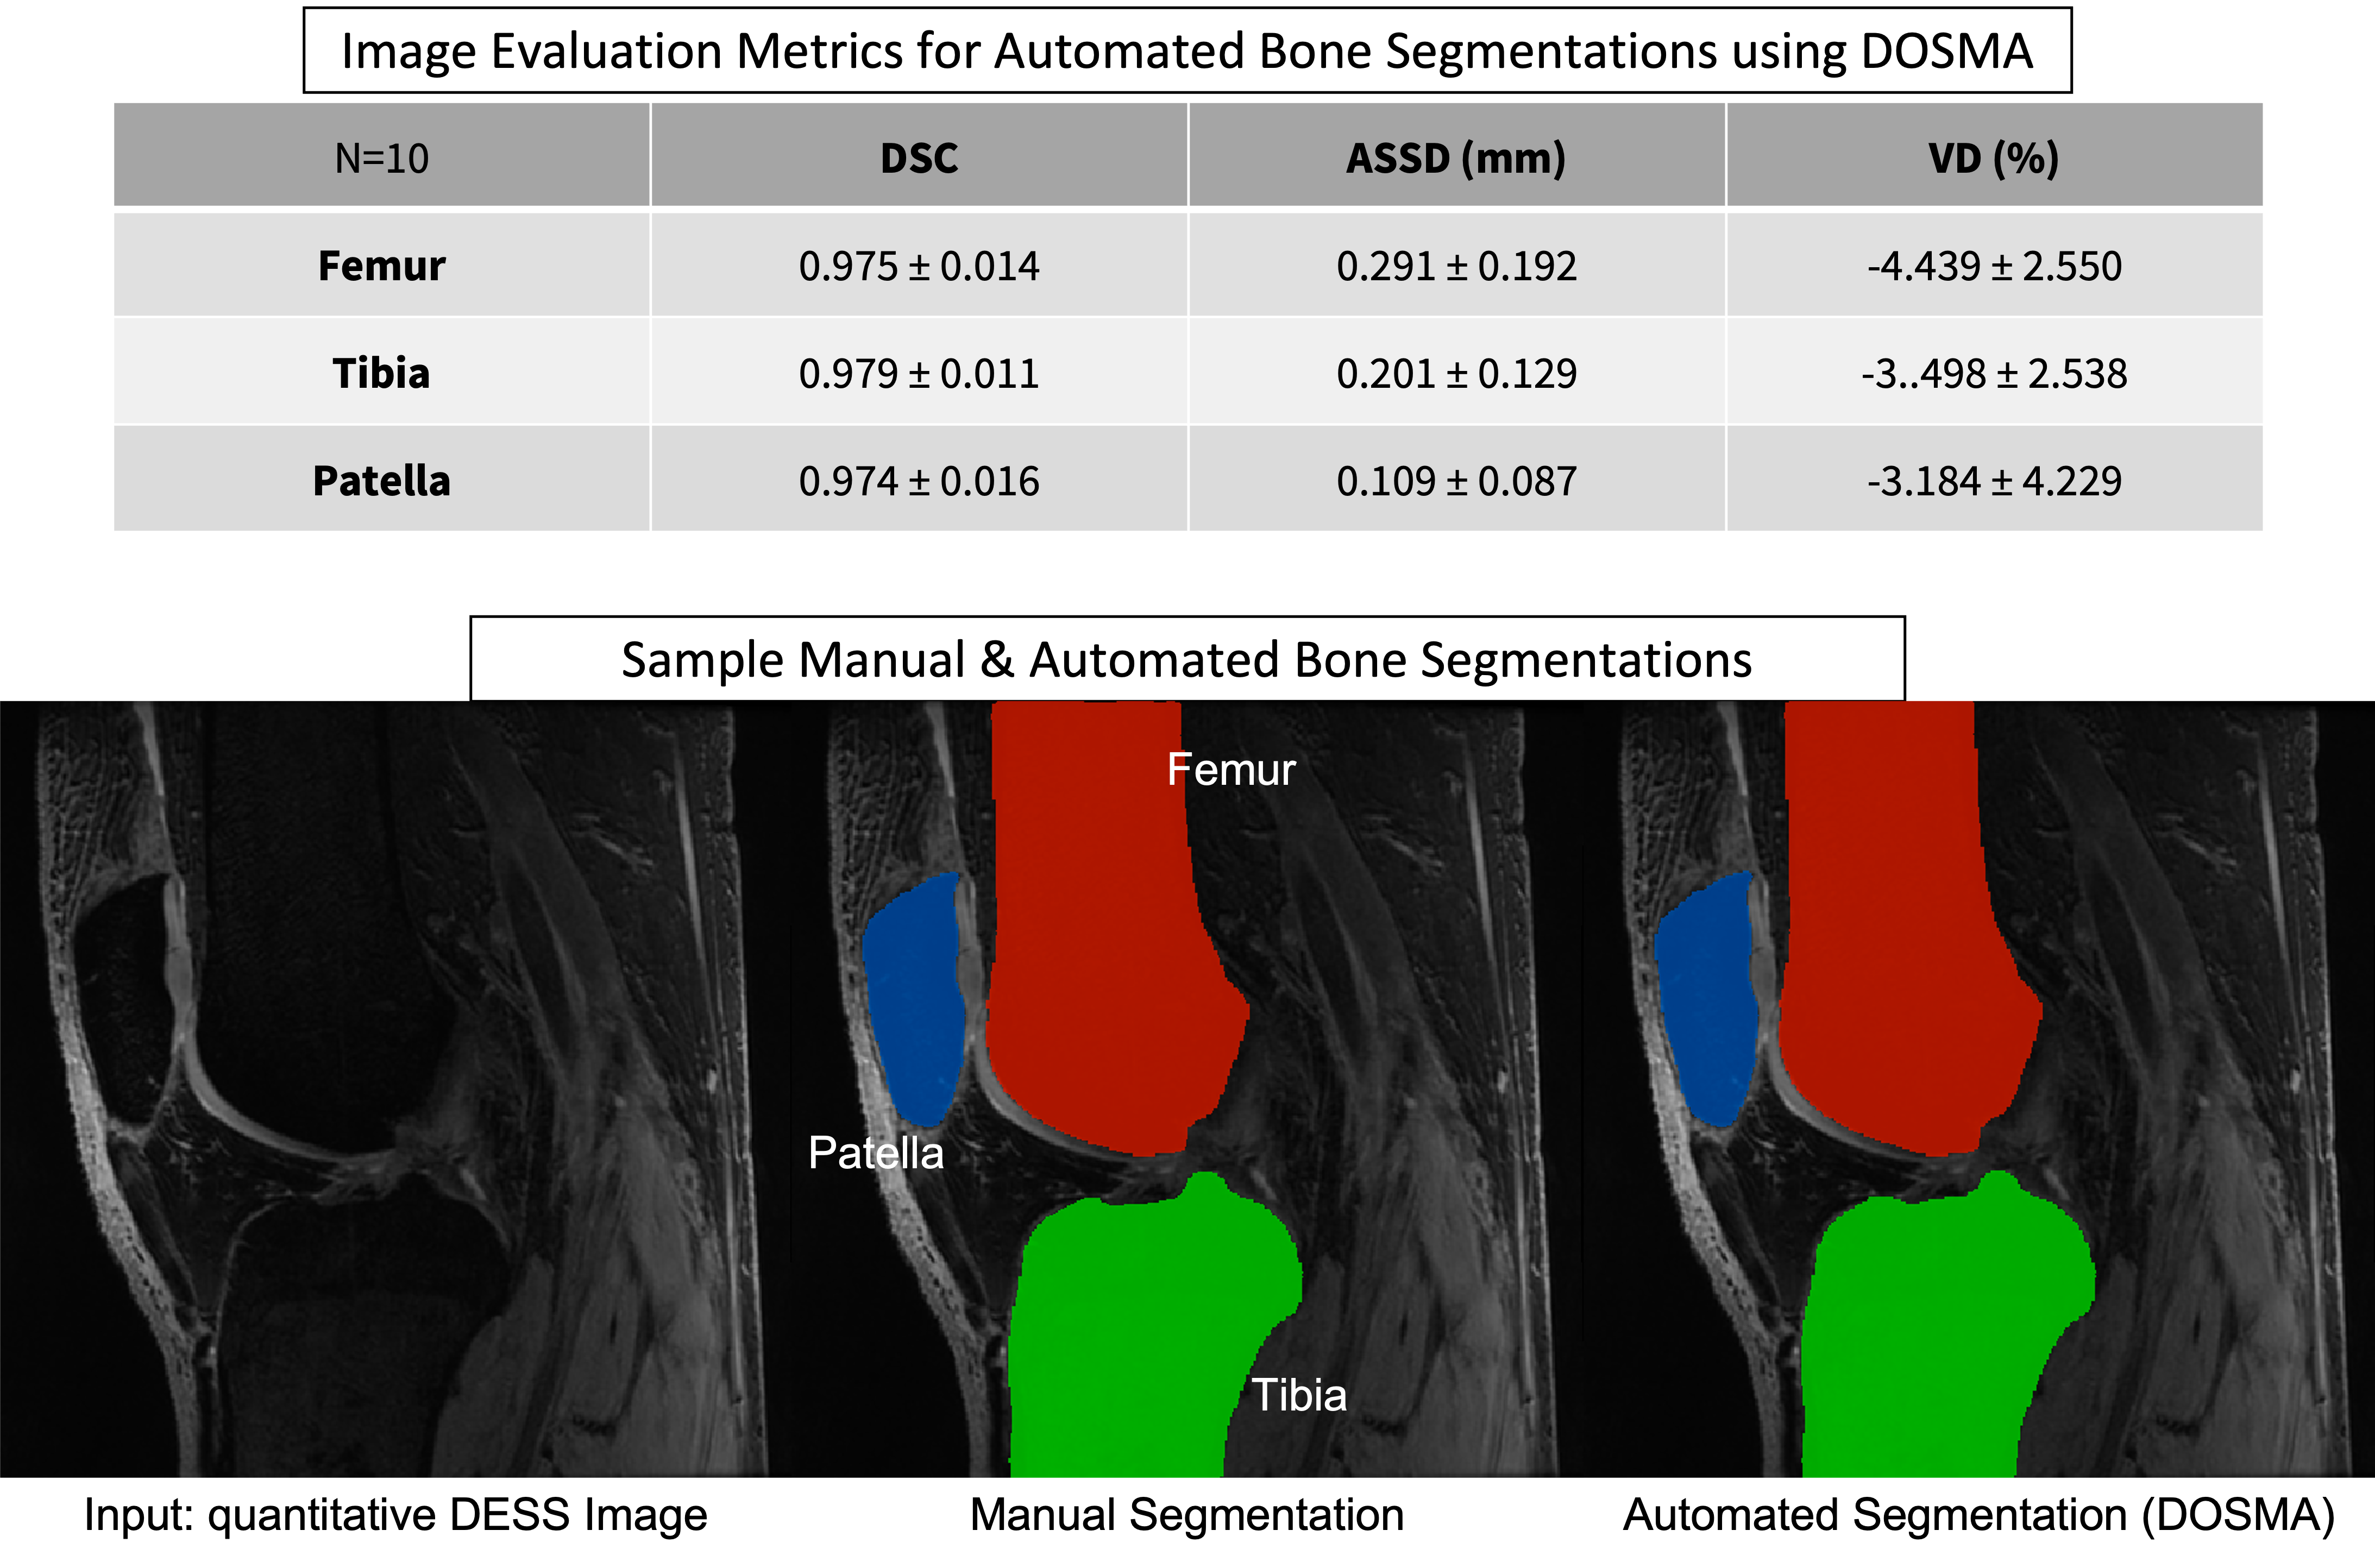
1. DOSMA pipeline for Bone SegmentationBuilding on the previous framework, which supports segmentation of knee cartilage and menisci, the new pipeline includes segmentation of all knee bones (femur, patella, tibia). The new segmentation model incorporates the same 2D convolutional neural network architecture as a previously-validated bone segmentation model2. Quantitative double-echo in steady-state (qDESS) knee scans were used as input for segmentation. To validate the automatic bone segmentations, we performed manual bone segmentations for ten healthy subjects. For the tibia and femur bones, both segmentations were bound to include the condyle regions for the purposes of evaluating the subchondral bone. To test the accuracy of DOSMA bone segmentations, we calculated three segmentation metrics3 for each bone: Dice similarity coefficient (DSC), average symmetric surface distance (ASSD), and volume difference (VD).
2. Application to PET imaging: Subchondral Bone Segmentation from DOSMA Bone
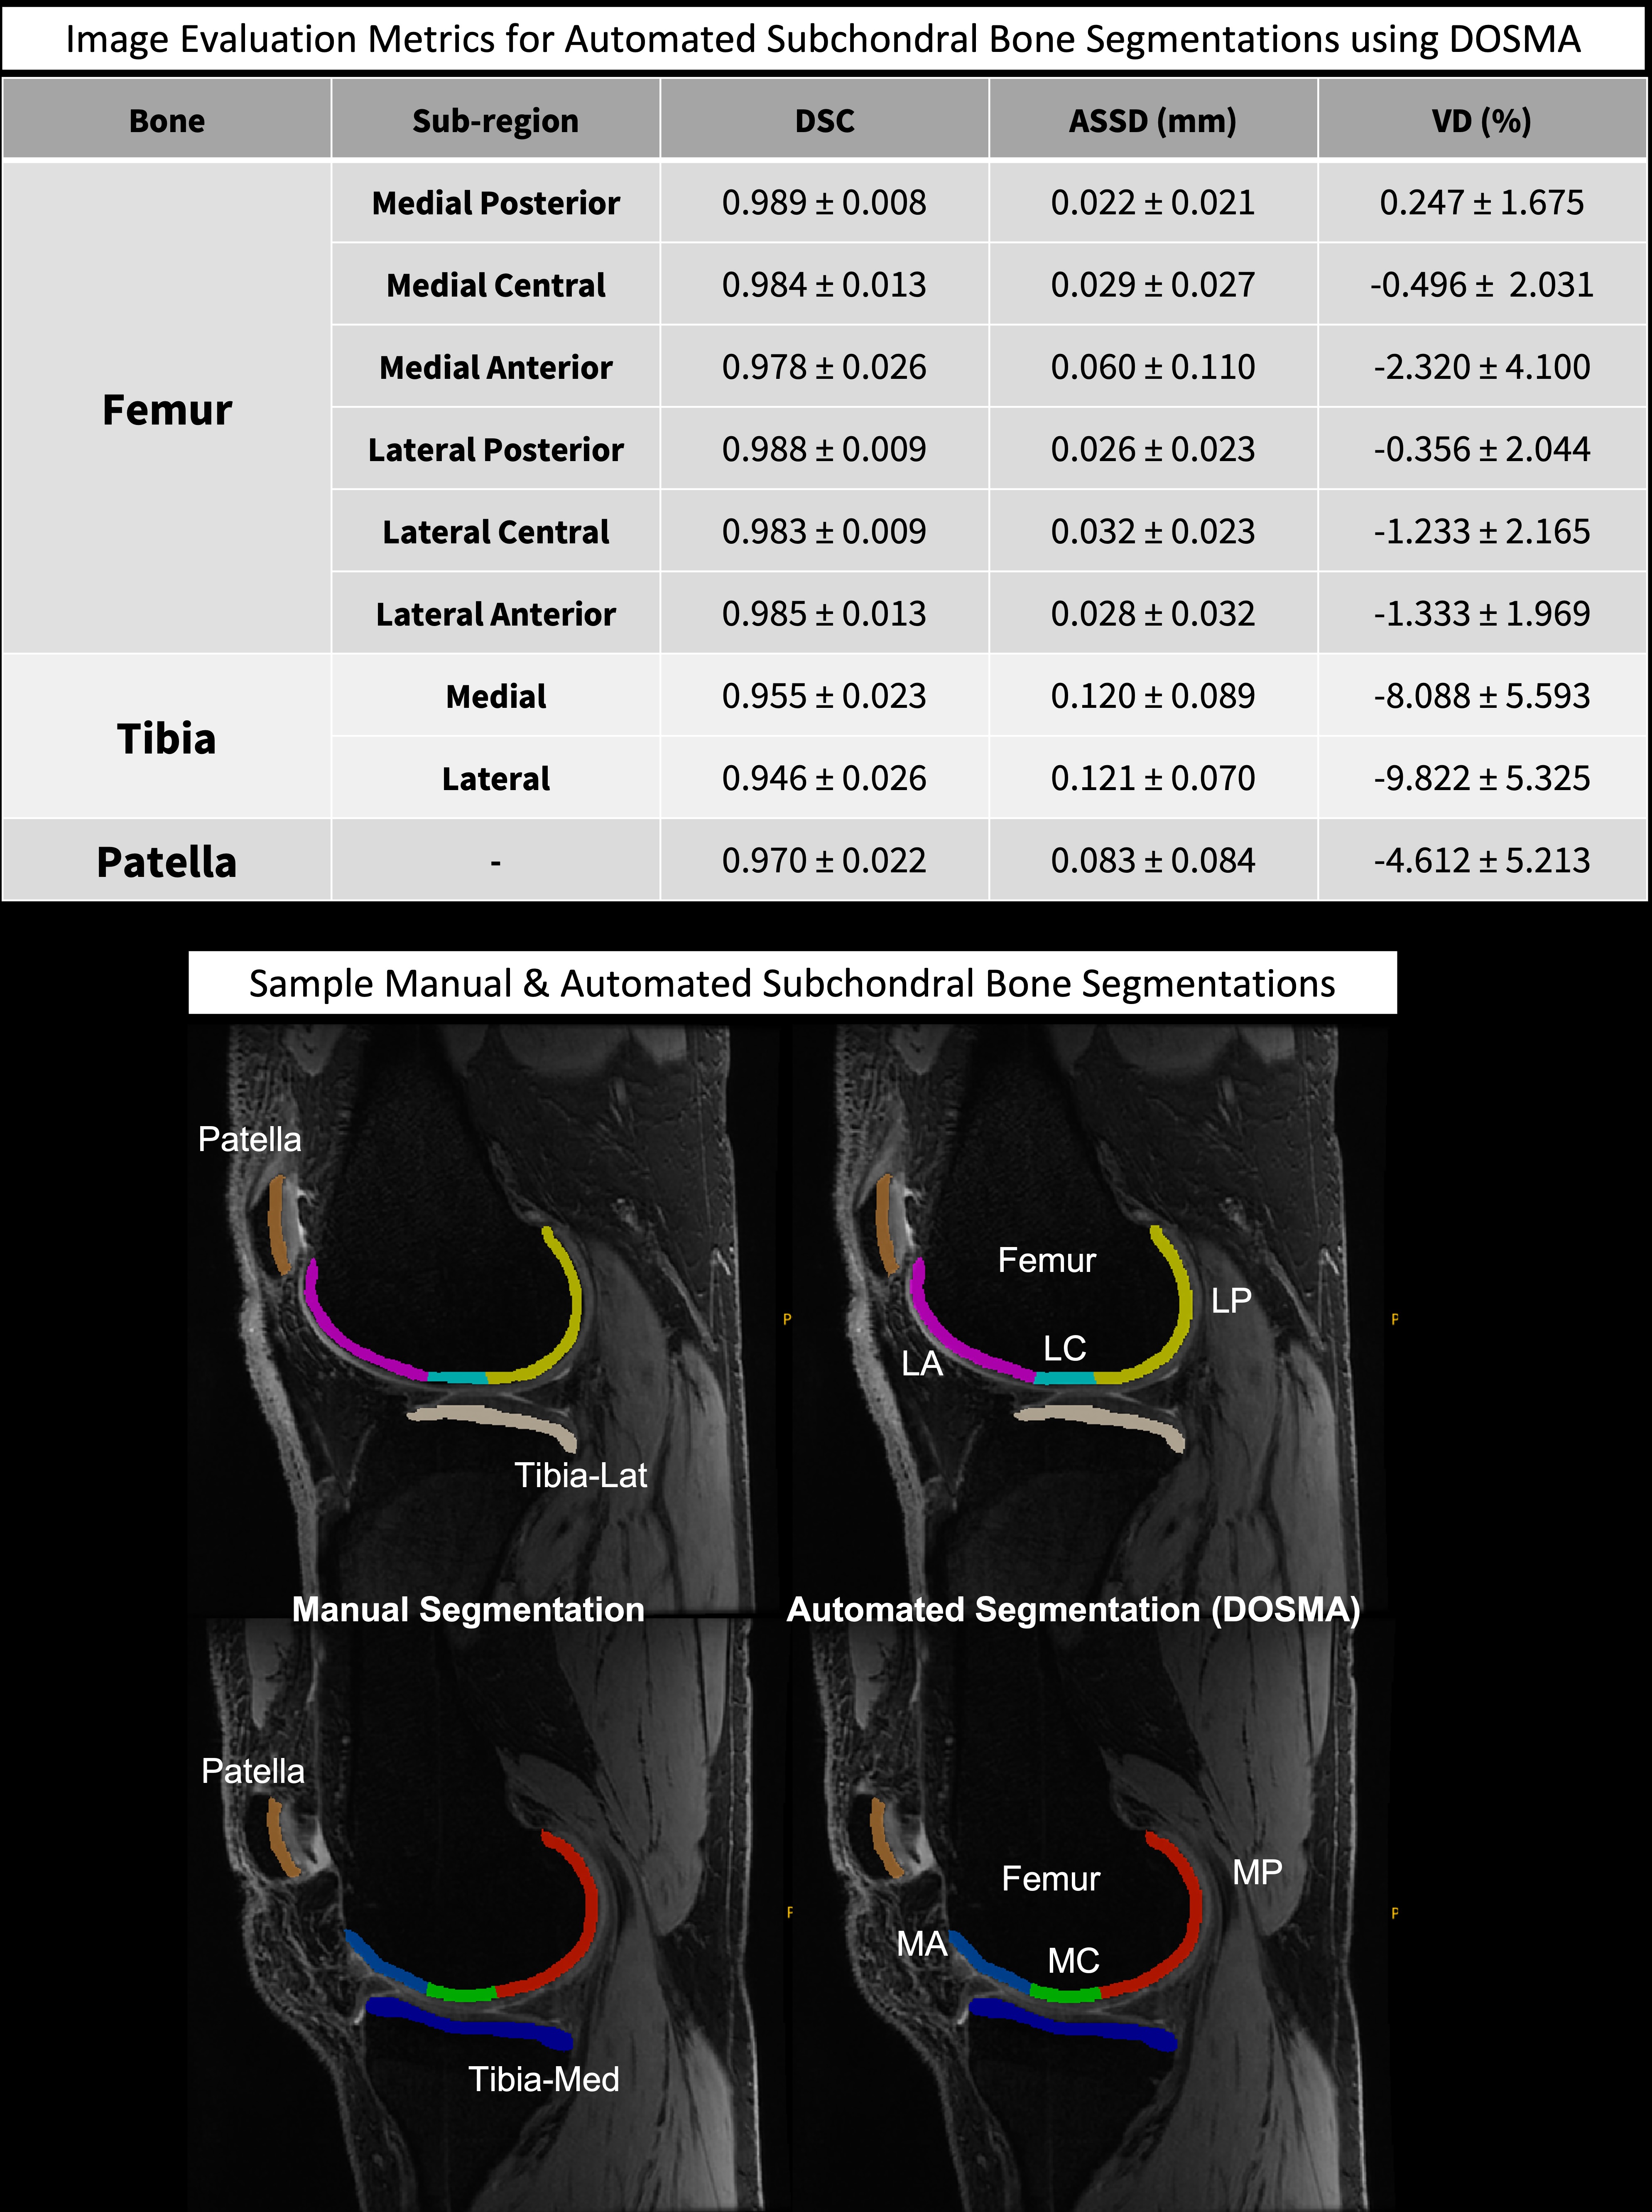
To create the subchondral bone masks, we used the bone and cartilage segmentations as input. We used an iterative approach to label all bone voxels within 3mm of cartilage as subchondral bone; 3mm was selected to account for low-resolution PET imaging (~4mm) and PET signal spillage. The generated masks were divided into established subregions used in the cartilage literature: patella, tibia (lateral and medial) and femur (lateral and medial anterior, posterior, and central), leading to nine subchondral bone regions. We compared the subchondral masks produced using automated and manual bonesegmentations and validated cartilage segmentations from DOSMA1. The same image segmentation metrics used to evaluate whole bone segmentations were used to assess subchondral bone masks.
3. Application to PET: Tracer Uptake using Subchondral Bone Masks
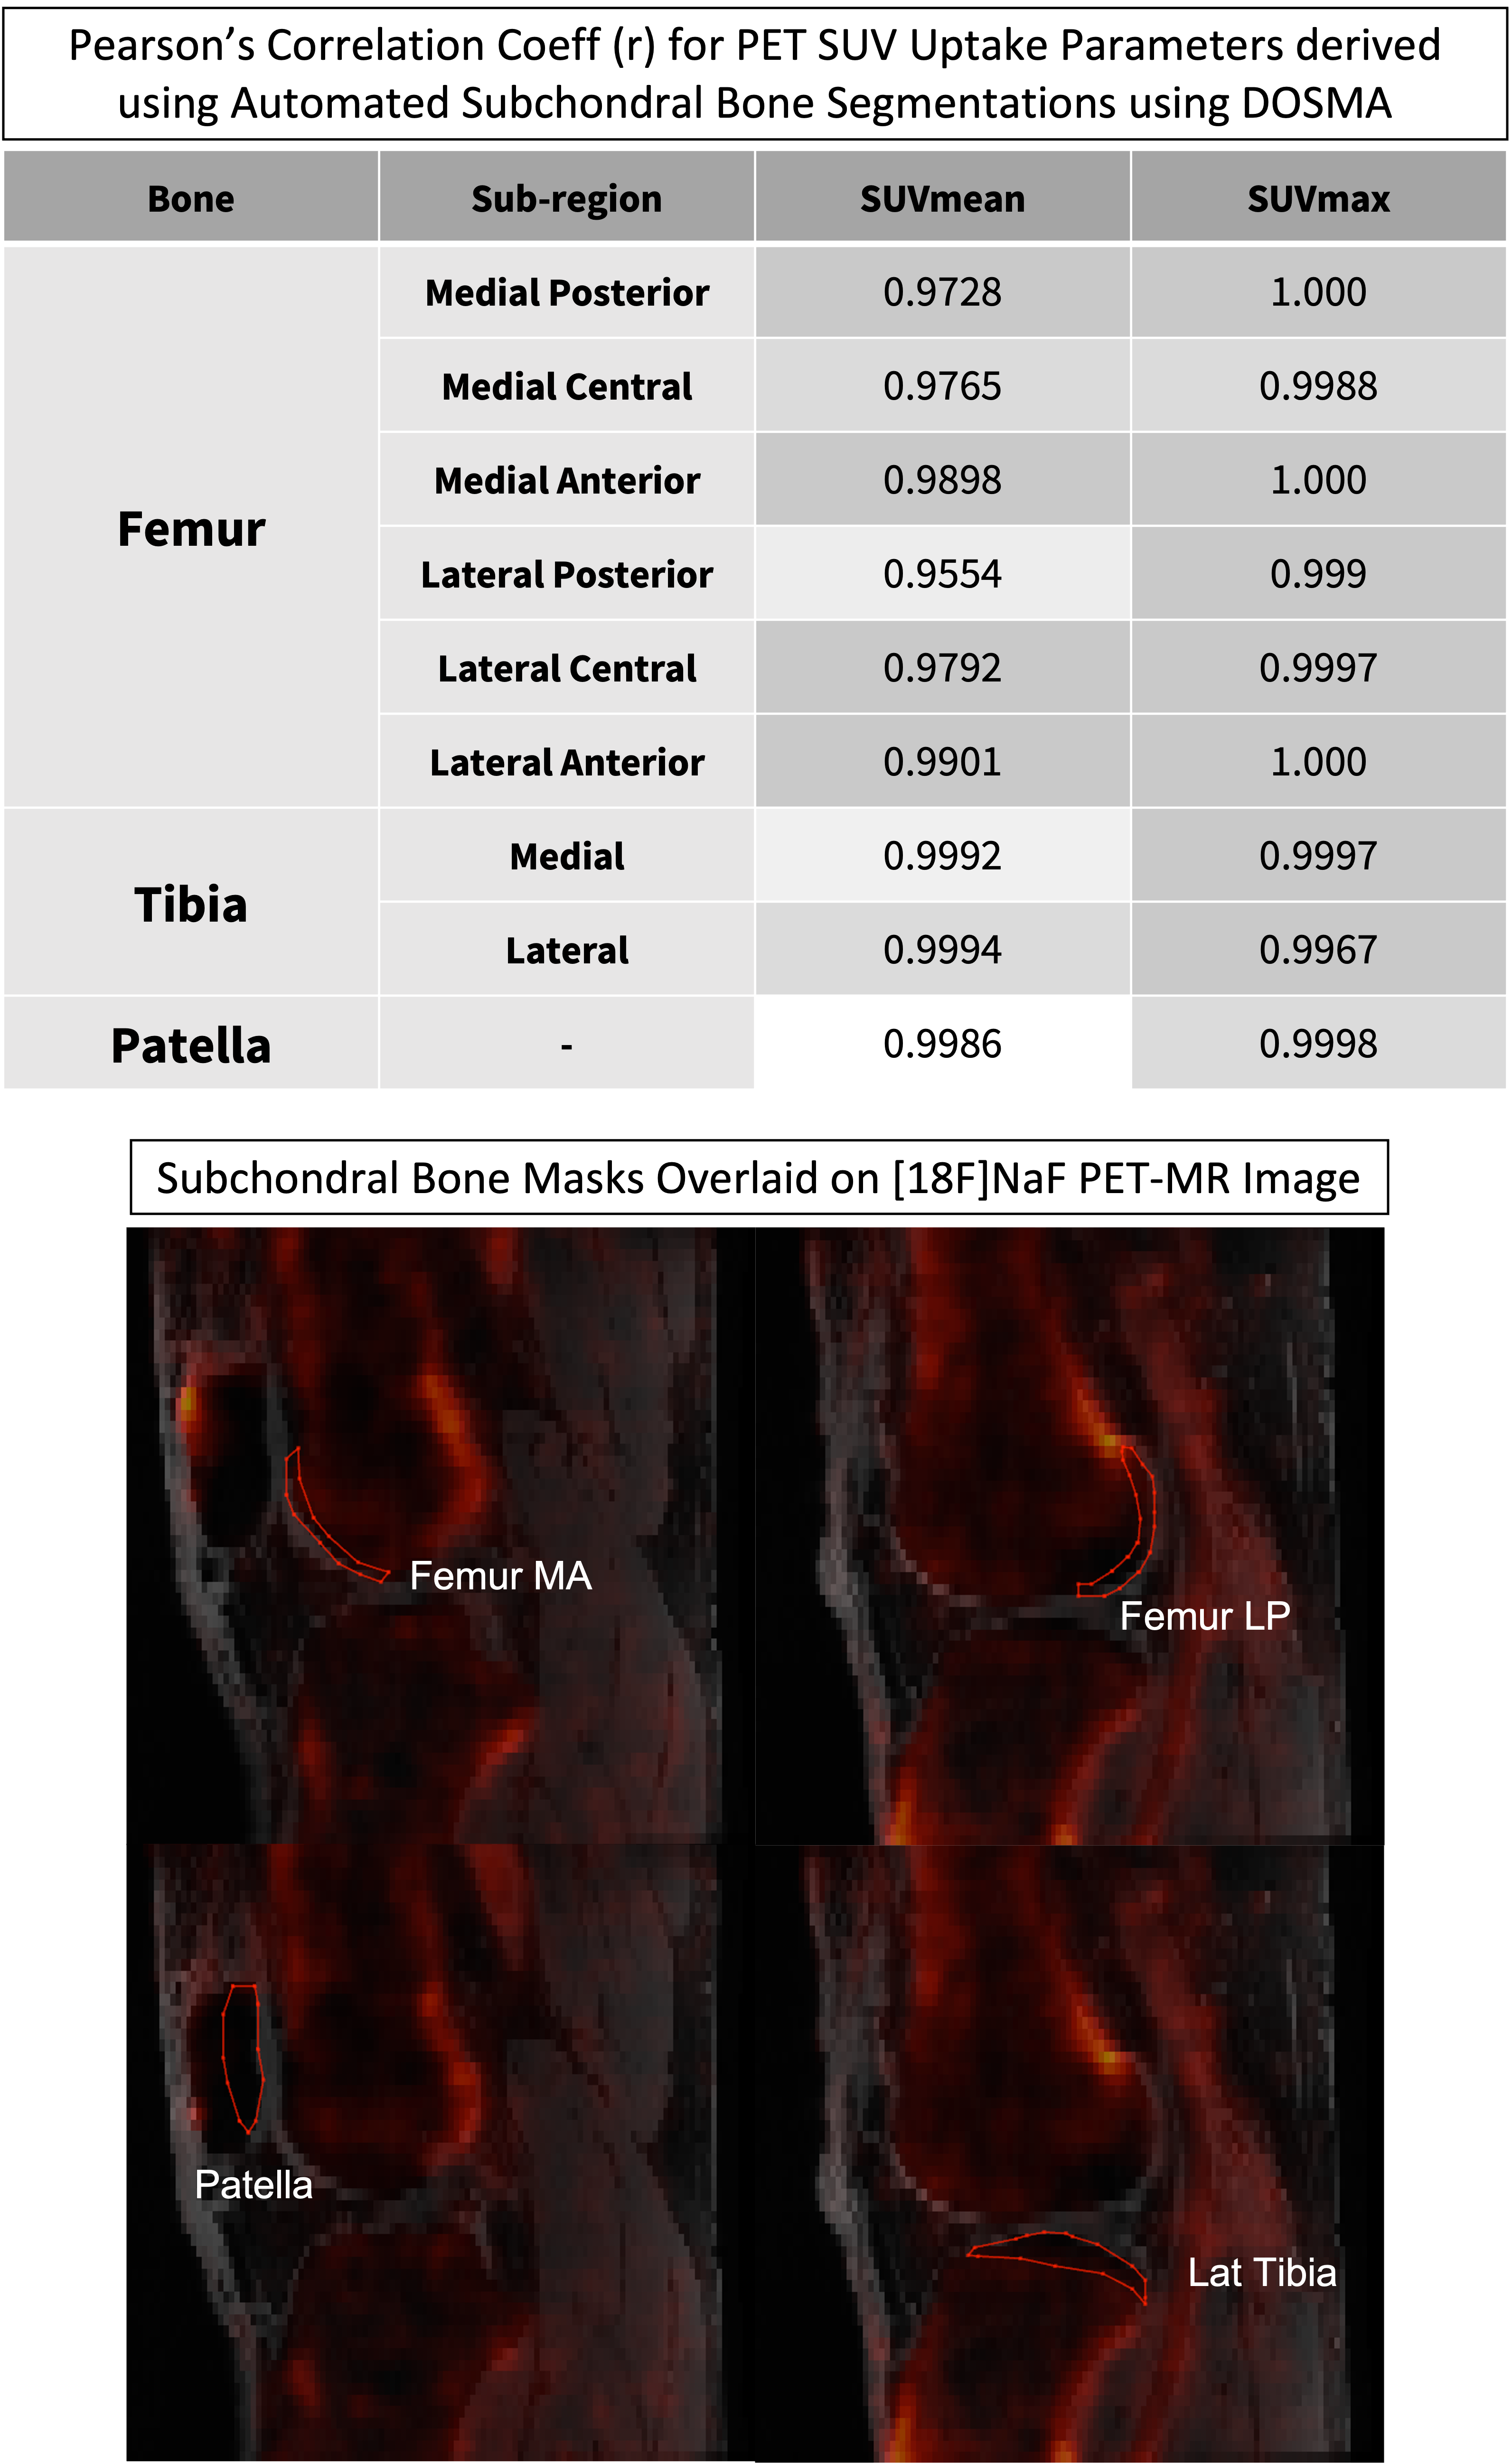
[18F]NaF PET standardized uptake values (SUV) (mean,maximum) were calculated using subchondral bone masks created from both automated and manual bone segmentations for all subregions. Pearson correlation coefficients were used to determine differences between the parameters derived from the two segmentations.
Results
1. DOSMA pipeline for Bone SegmentationFigure 1 shows the distribution of DSC values for the three bone segmentations (femur, patella, and tibia). DSC values were >0.97, showing excellent agreement between manual and DOSMA automated segmentations. Segmentation ASSD values were 0.109mm for the patella, 0.201mm for the tibia and 0.291mm for the femur. The VD values between the two segmentations were between -4.439% to -3.184%, showing a small consistent overestimation by the automated segmentation model.
2. Application to PET imaging: Subchondral Bone Segmentation from DOSMA Bone Segmentations
Example bone segmentations and distribution of DSC values for the nine subchondral subregions are included in Figure 2. Across all subregions, DSC values were >0.946, showing excellent agreement from manual and automated segmentations. Similarly, the ASSD values ranged from 0.022mm for the medial posterior femur to 0.121mm for the lateral tibia. Lastly, the VD values between the two segmentations were more varied, ranging from -9.82-0.247%, showing that some regions show more variance in volume as compared to others.
3. Application to PET: Tracer Uptake using Subchondral Bone Masks
Correlation coefficients were calculated for PET SUV_mean and SUV_max. There was a strong positive correlation between parameters calculated from the manual and automatic subchondral masks, with values ranging from 0.9554-0.9994 for SUV_mean and 0.9967-1.000 for SUV_max. Both parameters showed strong correlations for all subregions.
Discussion
We incorporated a new pipeline in DOSMA for bone segmentation. DOSMA's performance for automated bone segmentations is supported by the high DSC and low ASSD and VD values. Further, we created subchondral bone masks using DOSMA bone and cartilage segmentations, showing similar performance in terms of segmentation metrics. Lastly, we validated the applicability of subchondral bone masks by measuring PET SUV measures, with correlation coefficients ranging from 0.95-1.00. These results show the utility of automatic bone segmentation for quantitative analysis of musculoskeletal tissues.The link to DOSMA is https://github.com/ad12/DOSMA.
Acknowledgements
This work received research support from the Wu Tsai Human Performance Alliance, GE Healthcare, and NIH R01AR079431, R01AR077604, R01AR074492 and R21EB030180.References
[1] Desai A, Barbieri M, Mazzoli V, Rubin E, Black M, Watkins L, Gold G, Hargreaves B, Chaudhari A. DOSMA: A deep-learning, open-source framework for musculoskeletal MRI analysis (Version v0.0.9, prerelease). Zenodo. Feb 2019. https://doi.org/10.5281/zenodo.2559549
[2] Gatti, A.A., Maly, M.R. Automatic knee cartilage and bone segmentation using multi-stage convolutional neural networks: data from the osteoarthritis initiative. Magn Reson Mater Phy 34, 859–875 (2021). https://doi.org/10.1007/s10334-021-00934-z
[3] Taha, A.A., Hanbury, A. Metrics for evaluating 3D medical image segmentation: analysis, selection, and tool. BMC Med Imaging 15, 29 (2015). https://doi.org/10.1186/s12880-015-0068-x
[4] Watkins, L., MacKay, J., Haddock, B., Mazzoli, V., Uhlrich, S., Gold, G., & Kogan, F. (2021). Assessment of quantitative [18F]Sodium fluoride PET measures of knee subchondral bone perfusion and mineralization in osteoarthritic and healthy subjects. Osteoarthritis and cartilage, 29(6), 849–858. https://doi.org/10.1016/j.joca.2021.02.563
Figures