2115
Deep Learning-Based Quasi-Automatic Tool for Regional Quantitative 17-Segment Analysis of Myocardial Fibrosis1School of Physics and Engineering, ITMO University, Saint Petersburg, Russian Federation, 2ITMO University, Saint Petersburg, Russian Federation, 3Almazov National Medical Research Centre, Saint Petersburg, Russian Federation, 4Aix-Marseille Universite, Marseille, France
Synopsis
Keywords: Analysis/Processing, Segmentation, Quantitative analysis
Motivation: Despite the significance of regional myocardial analysis in clinical practice it's performed manually, which is a time-consuming task. Therefore, automation of myocardium regional analysis is a relevant task.
Goal(s): The goal of this work is to develop a tool for myocardium regional quantitative analysis automation
Approach: A trained neural network segment myocardium and fibrosis. The segmented myocardium undergoes additional segmentation into 17 segments using mathematical algorithm. The fibrosis volume in each segment is measured.
Results: U-Net achieved median DSC 0.75 for fibrosis and 0.85 myocardium. The fibrosis regional detection accuracy of our algorithm 0.71 according to F-score. Our algorithm speed is about 30s/patient.
Impact: Our tool allows to speed up and improve the accuracy of myocardium regional analysis.
Introduction
Volume and localization of myocardial fibrosis are objective prognostic criteria of a successful myocardial revascularization [1]. Cardiovascular magnetic resonance (CMR) with late gadolinium enhancement (LGE) is one most important imaging modalities allowing quantitative assessment of myocardial fibrosis. 17-segment model of myocardium [2] is widely used for regional analysis of left ventricular (LV) function, providing a schematic distribution of studied parameters (“bull’s eye” diagram) (for example, perfusion [3], presence or relative volume of fibrosis [4]). Recently, number of semi-automatic and fully automatic approaches have been proposed for segmentation of fibrosis in LGE images, including neural network-based tools [5]. However, to the best of our knowledge, none of these tools provide an automated quantitative assessment of myocardial fibrosis in terms of 17-segment model. Therefore, in this work, we propose a quasi-automatic tool for quantification and localization of myocardium fibrosis.Methods
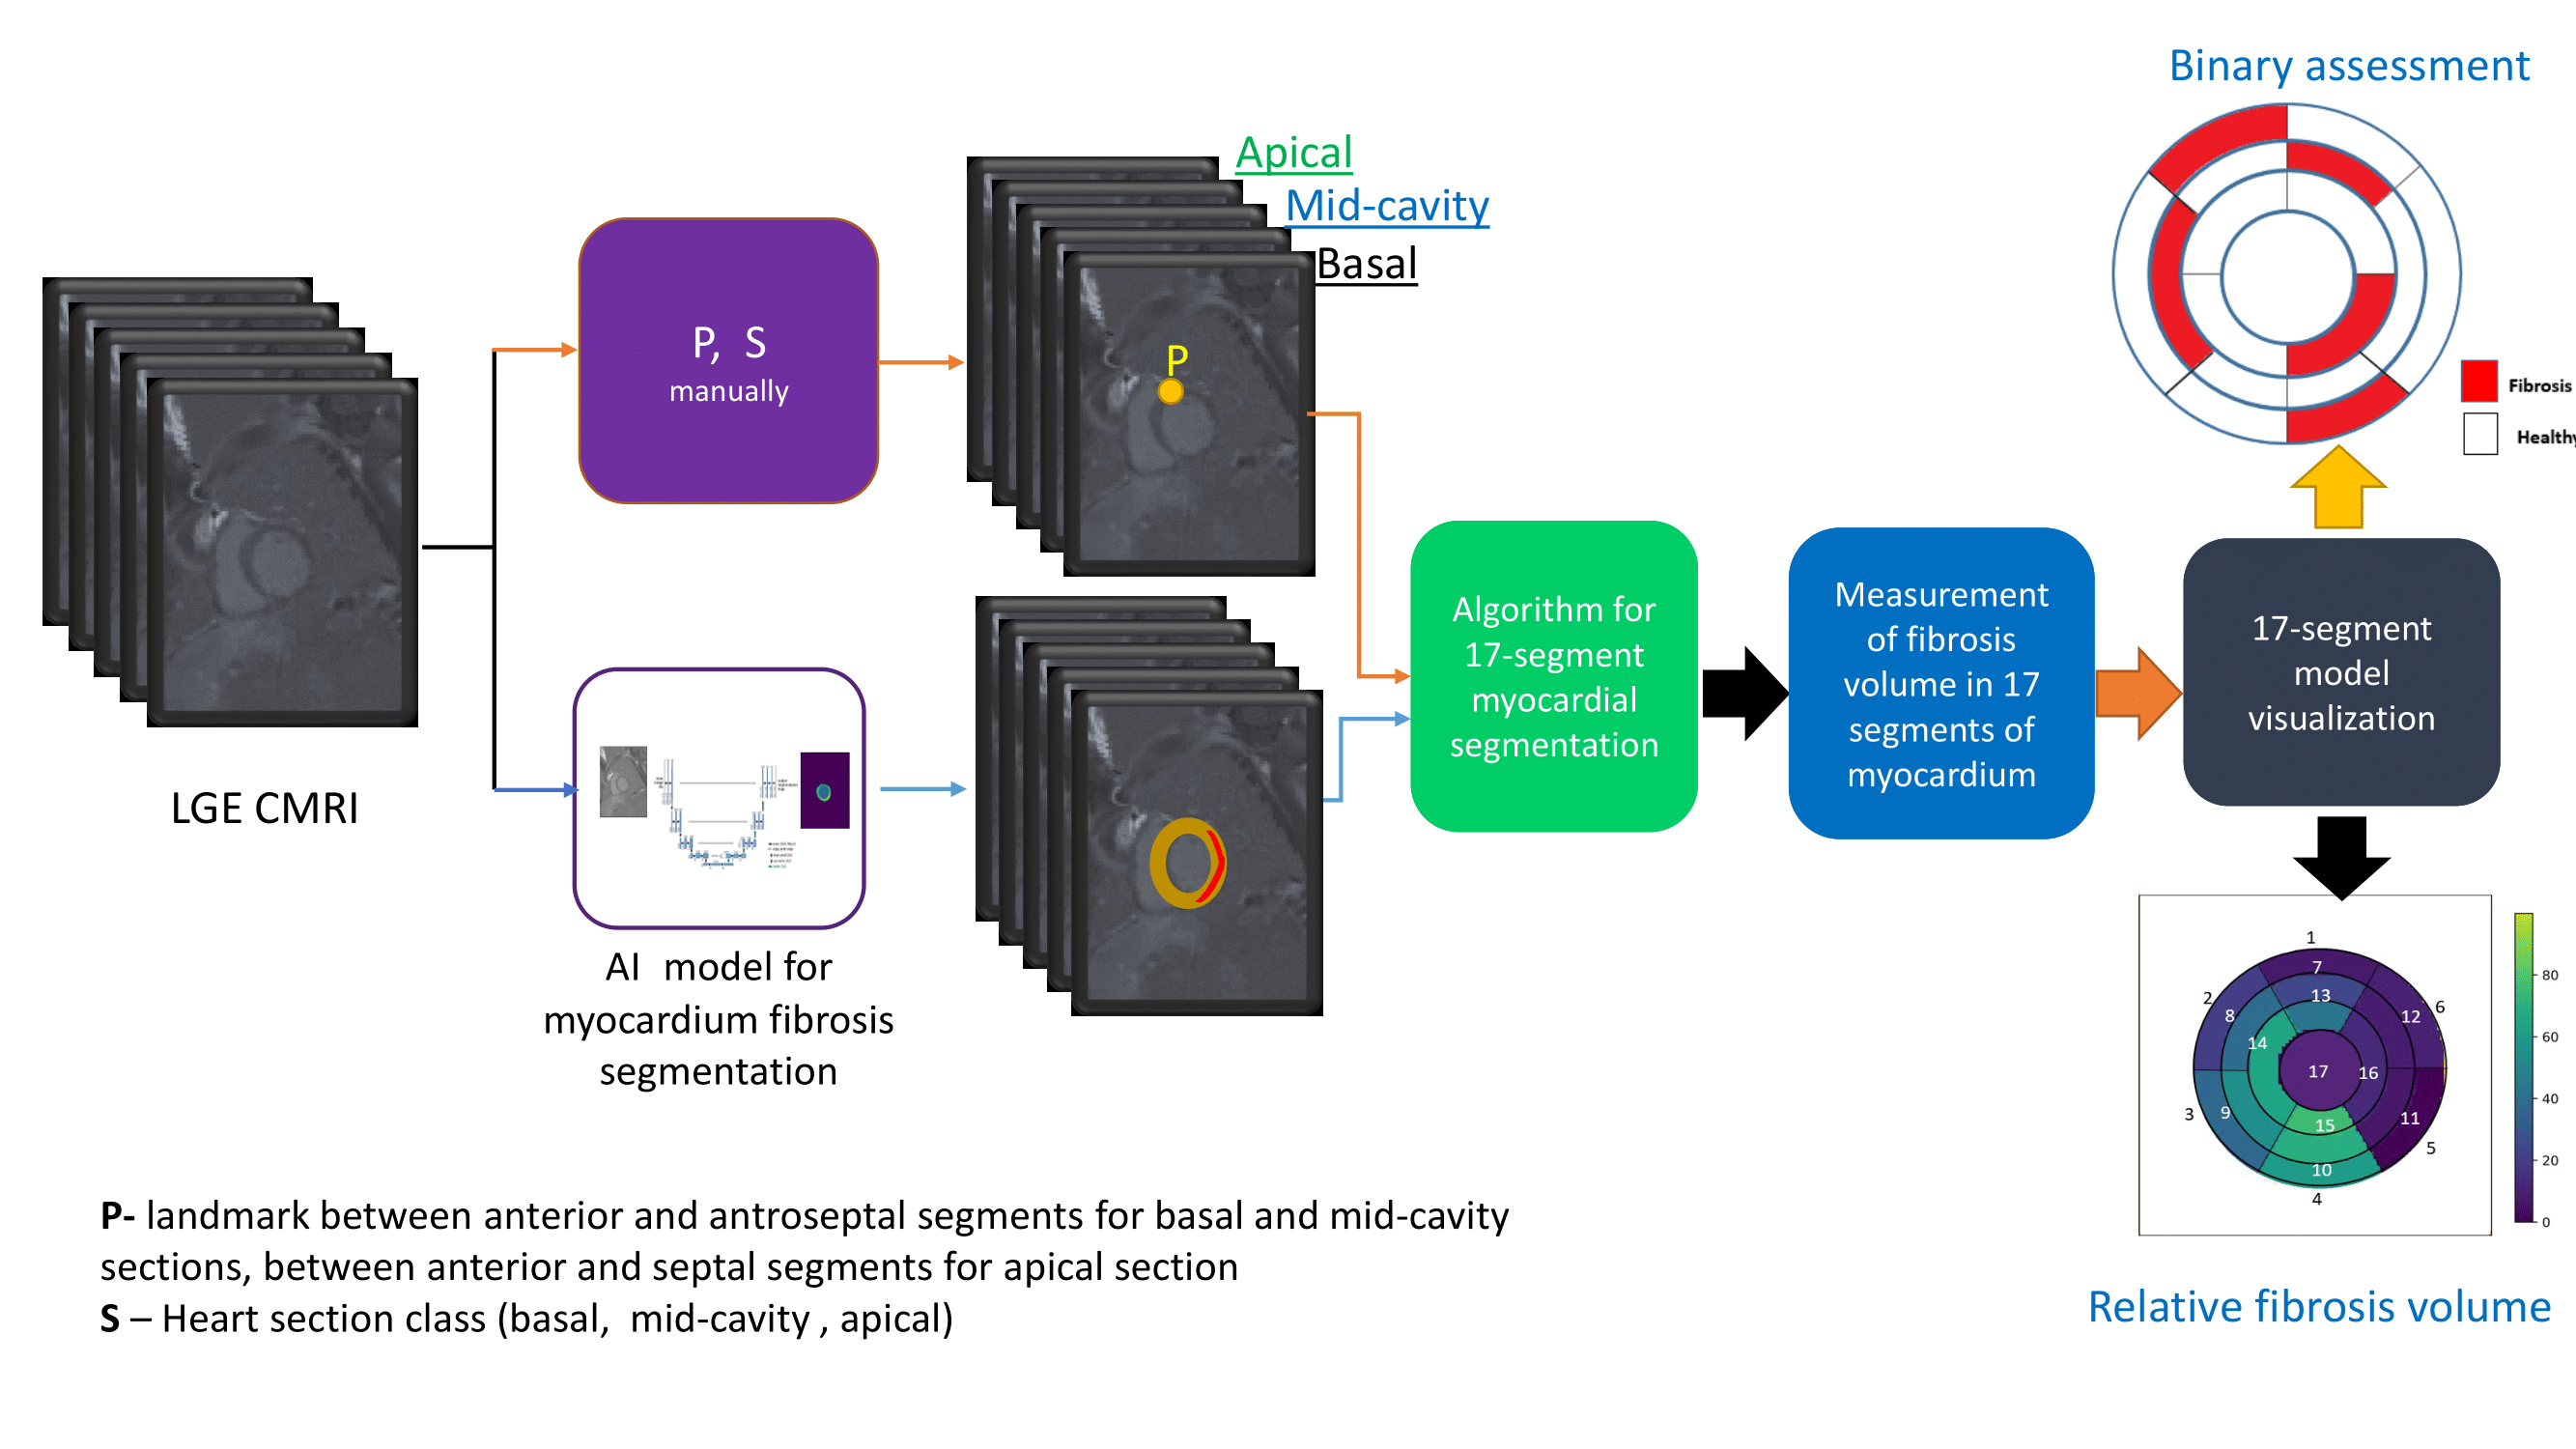
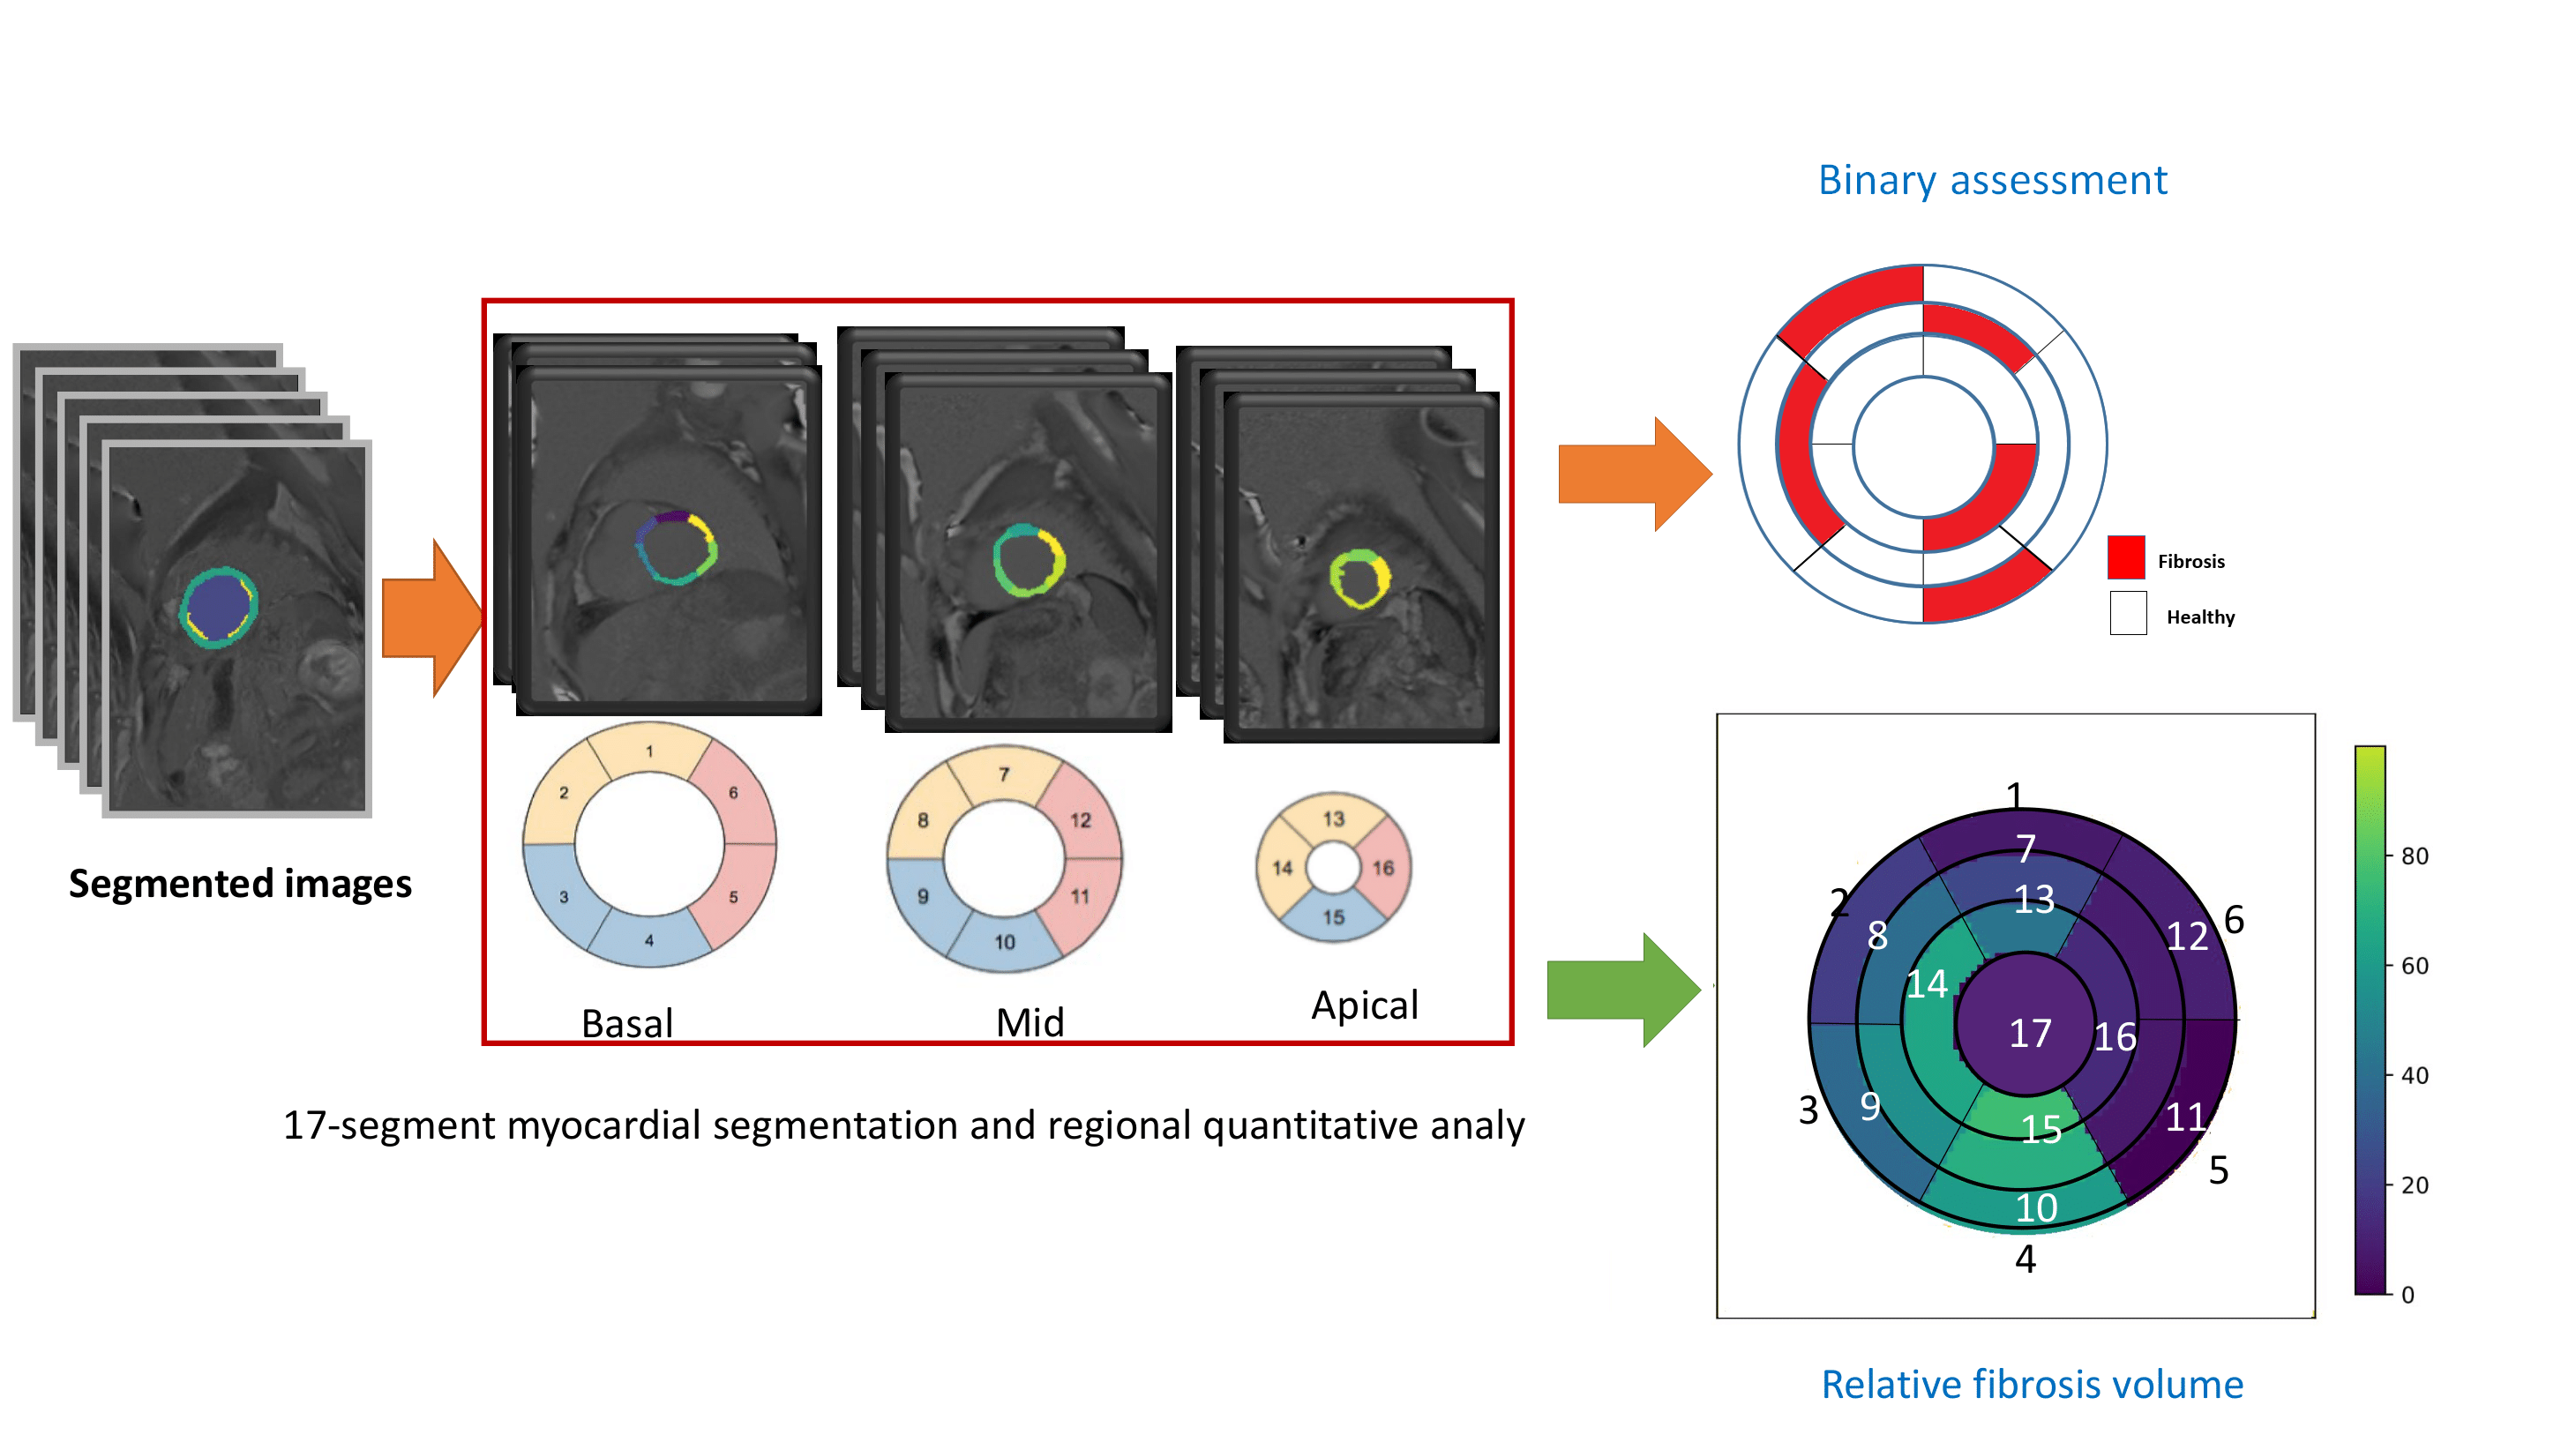
The developed framework (Figure 1) contains several parts, as follows. 1. Convolutional neural network (CNN) model for accurate myocardium and fibrosis segmentation. For training and testing of the model we collected a dataset of short-axis heart images acquired with phase-sensitive inversion recovery (PSIR) pulse sequence. The dataset contained the images of 100 patients with postinfarction cardiosclerosis (80 – for training, 20 – for testing). Each image contained from 9 to 11 2D slices. The images were manually labeled by an experienced radiologist, obtaining tree classes for ground truth masks: healthy myocardium, myocardium fibrous and LV cavity. The CNN-based segmentation was performed in two steps (cascade approach). The first CNN model was trained to perform a rough presegmentation of the LV cavity with the aim to detect its center and to crop the initial image to a smaller size (64x64). The second CNN model was trained to segment healthy myocardium, fibrosis and LV cavity in the cropped image. U-Net architecture with attention layers was utilized at both stages, the hyperparameters were optimized in a grid search. Dice similarity coefficient (DSC) was used to evaluate segmentation performance. 2. The block for manual parameter determining for each slice. S denotes the heart section (1 – basal, 2 - mid-cavity, 3 - apical, 4 - apex). P is assigned to the coordinates of point between anterior and antroseptal segments (for basal and mid-cavity sections), and between anterior and septal segments for apical section. 3. An algorithm for 17 segments myocardial segmentation. The algorithm acquires the predicted masks of myocardium and fibrosis, parameters S and P, and the coordinates of the LV cavity center, as input. The myocardium is approximated as a circle with a center in a the LV cavity center. S determines whether the mask should be divided into 6 segments (segments #1-#6 for basal or #7-#12 for mid-cavity sections), into 4 (segments #13-#16 for apical section) or into 1 segment (17-th segment for apex). 4. Measurement of the relative fibrosis volume in each of 17 segments of the myocardium based on the predicted masks of healthy myocardium and fibrosis. For each patient in a test dataset, the radiologists have visually analyzed the presence of fibrosis tissue in each of the LV segments. This information was used as a ground truth for the framework validation. We evaluated the efficiency of our algorithm using evaluation metrics for binary classification such as precision and recall and F1-score which is defined as a weighted average of both precision and recall [6]: 5. 17-segment model visualization. This block provides two types of visualization of myocardial 17-segment model: relative volume of fibrosis and binary assessment of the fibrosis presence.Results
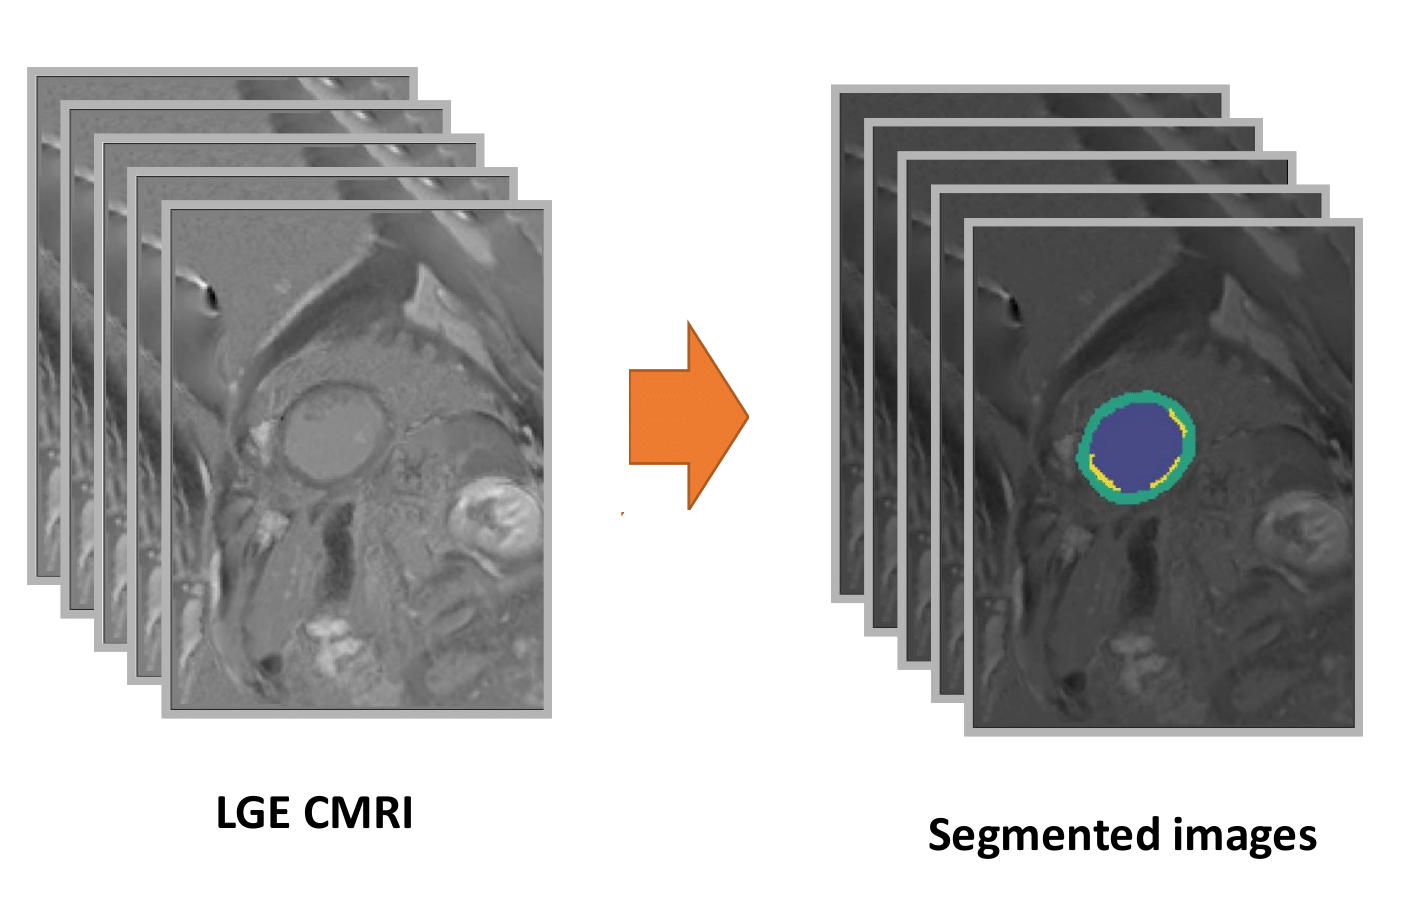
Trained cascade U-Net CNN provided median DSC of 0.75 [0.64, 0.83] and 0.85 [0.79, 0.89] for fibrosis and myocardium respectively. An example of the segmented images is presented in Figure 2. The binary classification metrics for fibrosis detection in the 17 segments were as follows: precision = 0.60, recall = 0.88 and F1 = 0.71. The examples of binary and quantitative 17-segment diagrams are shown in Figure 3.Discussion and Conclusion
In this work, we have developed a deep learning-based quasi-automatic tool for regional analysis of the myocardium fibrosis in LGE CMRI. It allows division of LV myocardium into 17 segments according to AHA recommendation, measurement of the relative fibrosis volume in every single segment and visualization of the results via a “bull’s-eye” diagram. The performance of the neural network is comparable to previously reported results for a cascade approach (mean DSC = 0.72) [5]. As a future step, the manual determination of S and P parameters can be substituted by CNN-based algorithm.Acknowledgements
The study was supported by the Russian Science Foundation (RSF) grant No. 23-75-10045References
1. K.C. Wu, R.G. Weiss, D.R. Thiemann, K. Kitagawa, A. Schmidt, D. Dalal, S. Lai, D.A. Bluemke, G. Gerstenblith, E. Marban, Tomaselli G.F., ´ Lima J.A., Late gadolinium enhancement by cardiovascular magnetic resonance heralds an adverse prognosis in nonischemic cardiomyopathy, J. Am Coll Cardiol., 2008, 51(25):2414-21
2. Cerqueira MD, Weissman NJ, Dilsizian V, Jacobs AK, Kaul S, Laskey WK, Pennell DJ, Rumberger JA, Ryan T, Verani MS; American Heart Association Writing Group on Myocardial Segmentation and Registration for Cardiac Imaging. Standardized myocardial segmentation and nomenclature for tomographic imaging of the heart. A statement for healthcare professionals from the Cardiac Imaging Committee of the Council on Clinical Cardiology of the American Heart Association. Circulation. 2002 Jan 29;105(4):539-42. doi: 10.1161/hc0402.102975. PMID: 11815441.
3. Spier N, Nekolla S, Rupprecht C, Mustafa M, Navab N, Baust M. Classification of Polar Maps from Cardiac Perfusion Imaging with Graph-Convolutional Neural Networks. Sci Rep. 2019 May 20;9(1):7569. doi: 10.1038/s41598-019-43951-8. PMID: 31110326; PMCID: PMC6527613.
4. Nojiri A, Hongo K, Kawai M, Komukai K, Sakuma T, Taniguchi I, Yoshimura M. Scoring of late gadolinium enhancement in cardiac magnetic resonance imaging can predict cardiac events in patients with hypertrophic cardiomyopathy. J Cardiol. 2011 Nov;58(3):253-60. doi: 10.1016/j.jjcc.2011.07.007. Epub 2011 Sep 3. PMID: 21890327.
5. Lustermans DRPRM, Amirrajab S, Veta M, Breeuwer M, Scannell CM. Optimized automated cardiac MR scar quantification with GAN-based data augmentation. Comput Methods Programs Biomed. 2022 Nov;226:107116. doi: 10.1016/j.cmpb.2022.107116. Epub 2022 Sep 7. PMID: 36148718.
6. Dalianis, H. (2018). Evaluation Metrics and Evaluation. In: Clinical Text Mining. Springer, Cham. https://doi.org/10.1007/978-3-319-78503-5_6
Figures