2112
CNN for Automatic Estimation of Paraspinal Skeletal Muscle Index for Assessment of Sarcopenia and Correlation with Liver Frailty1Biomedical Engineering, The University of Memphis, Memphis, TN, United States, 2Liver Transplantation, Gastroenterology, Internal Medicine, North Shore University Hospital/ Northwell Health, Manhasset, NY, United States, 3Diagnostic Imaging, St. Jude Children's Research Hospital, Memphis, TN, United States
Synopsis
Keywords: Analysis/Processing, Segmentation
Motivation: Paraspinal muscle mass estimation for liver transplant candidacy is practically limited by tedious segmentation.
Goal(s): Develop an automatic segmentation algorithm using a convolutional neural network (CNN) for segmentation of abdominal paraspinal muscles to calculate skeletal muscle index in cirrhotic patients.
Approach: A U-Net CNN was trained on spin echo images and evaluated with Dice coefficient. Skeletal muscle index of original and predicted masks was compared with independent t-test, ANOVA and a Bland-Altman plot.
Results: Dice coefficient was >0.88, with a mean bias of <1% between CNN SMI and manual SMI, while not being statistically significant. SMI and liver frailty were not directly associated.
Impact: Faster and precise segmentation of abdominal paraspinal muscles to calculate muscle mass in cirrhotic patients would reduce the time burden, thereby increasing practicality for MRI skeletal muscle index estimation.
Introduction
Sarcopenia, defined as the decrease of muscle mass, has been associated with increased liver transplant mortality.1–4 For prognosis of cirrhotic patients, CT is the gold standard for segmenting paraspinal muscles and estimating skeletal muscle index(SMI), which is transverse muscle area divided by the square of height. Frailty, decrease in muscle function, has also shown to correlate with post-liver transplant mortality, and is often measured with liver frailty index, consisting of handgrip strength, a five chair stand test, and balance test.1Most SMI measurements are performed at the L3 level1,5,6. Unlike CT, MRI can also provide proton density fat fraction(PDFF) for myosteatosis. A limitation in implementing this prognostic biometric is tedious segmentation. The U-Net convolutional neural network (CNN) model is a recipe for biomedical imaging segmentation7. For SMI to mature in routine practice for cirrhotic patient liver transplantation candidacy evaluation, paraspinal segmentation must have minimal user bias and lower time investment.
This study's purpose is to develop a U-Net-based automatic segmentation method to segment paraspinal muscles at the L3 endplate for SMI estimation. Secondly, to determine a direct relationship between sarcopenia and frailty. It is hypothesized that automatic segmentations’ SMI output is comparable to human estimated SMI and sarcopenia is associated with liver frailty.
Methods
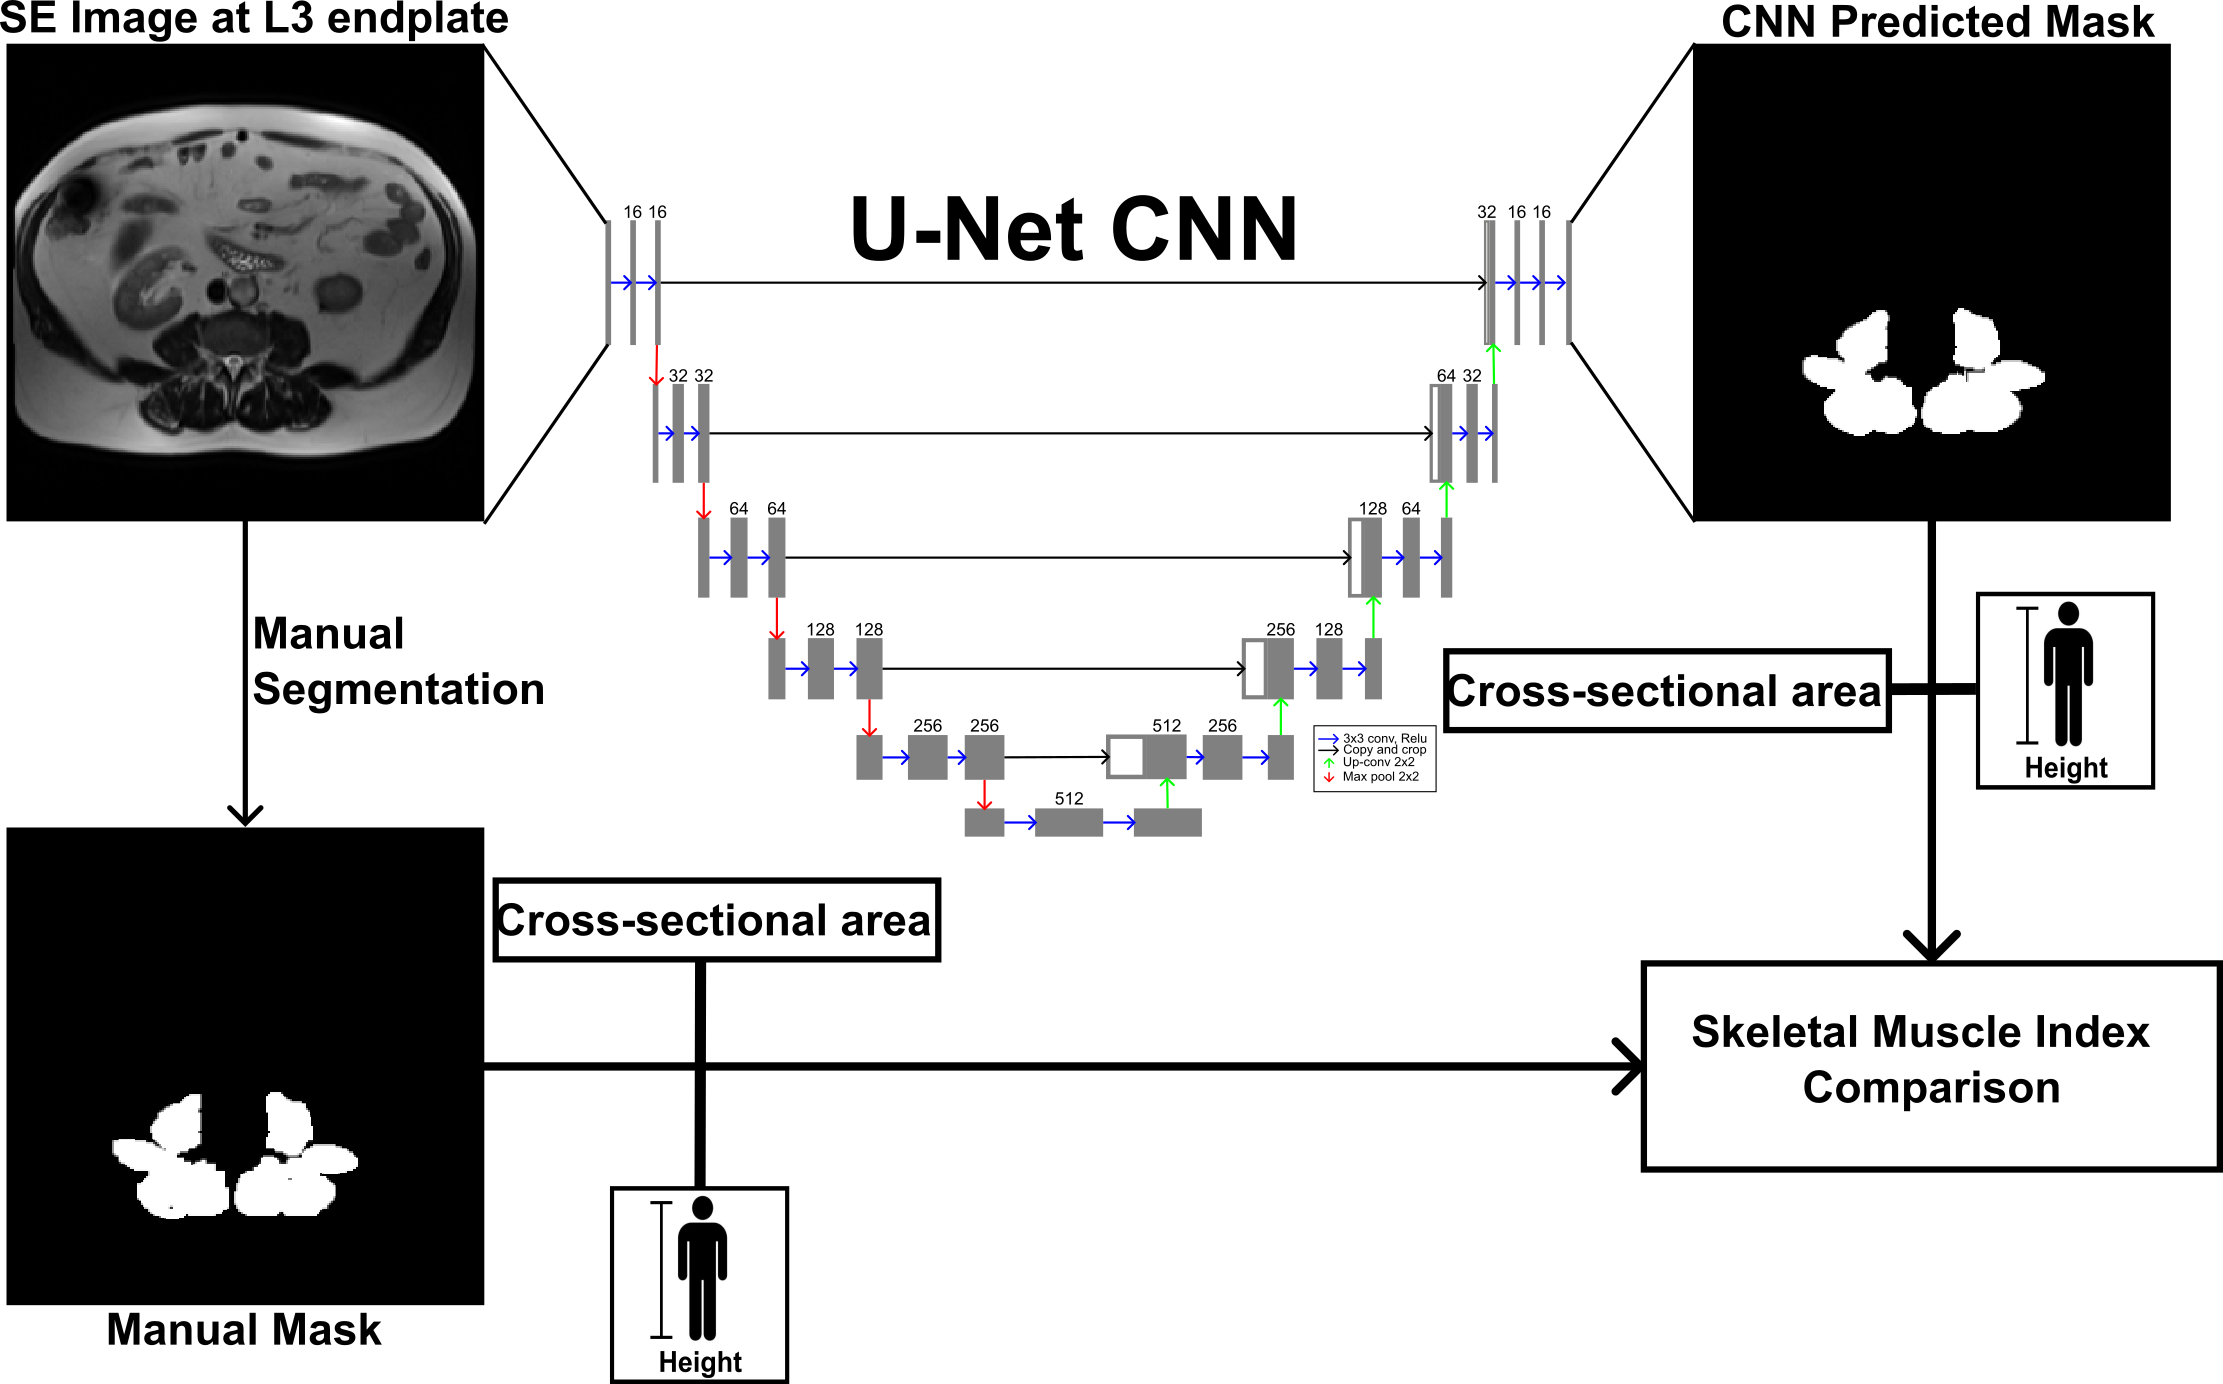
Data was retrospectively collected from 145 liver transplant candidates that were scanned at 1.5T and 3.0T using HASTE or Fast spin-echo (SE) sequences on multiple vendor scanners at Northwell Health System. The psoas, erector spinae, and quadratus lumborum were manually segmented at the L3 endplate using ITK-SNAP8. Images were normalized by their maximum signal intensity and reshaped into 256x256 matrices.The U-Net contained five down-sampling and up-sampling layers, where the first layer contained 16 filters, doubling and halved at each down-sampling layer and up-sampling layer with ReLU activation, respectively. Batch normalization was utilized, and loss consisted of binary cross entropy-Dice loss. Cases were split into 80:20 for training/validation to testing. Models were trained with a 10-fold cross-validation approach. Base learning rate was 0.01 with possible reduction to 1x10⁻⁶ and 20-epoch patience.
CNN and manual SMI were compared using Bland-Altman analysis and independent t-test in a total of 92 patients. CNN and manual SMI were categorized into frail, prefrail and robust patient conditions determined by liver frailty index and compared via ANOVA,10. Figure 1 summarizes the study workflow.
$$SMI = \dfrac{L3\,transverse\,cross-sectional\,area (cm^2)} {height (m^2)}$$
Results
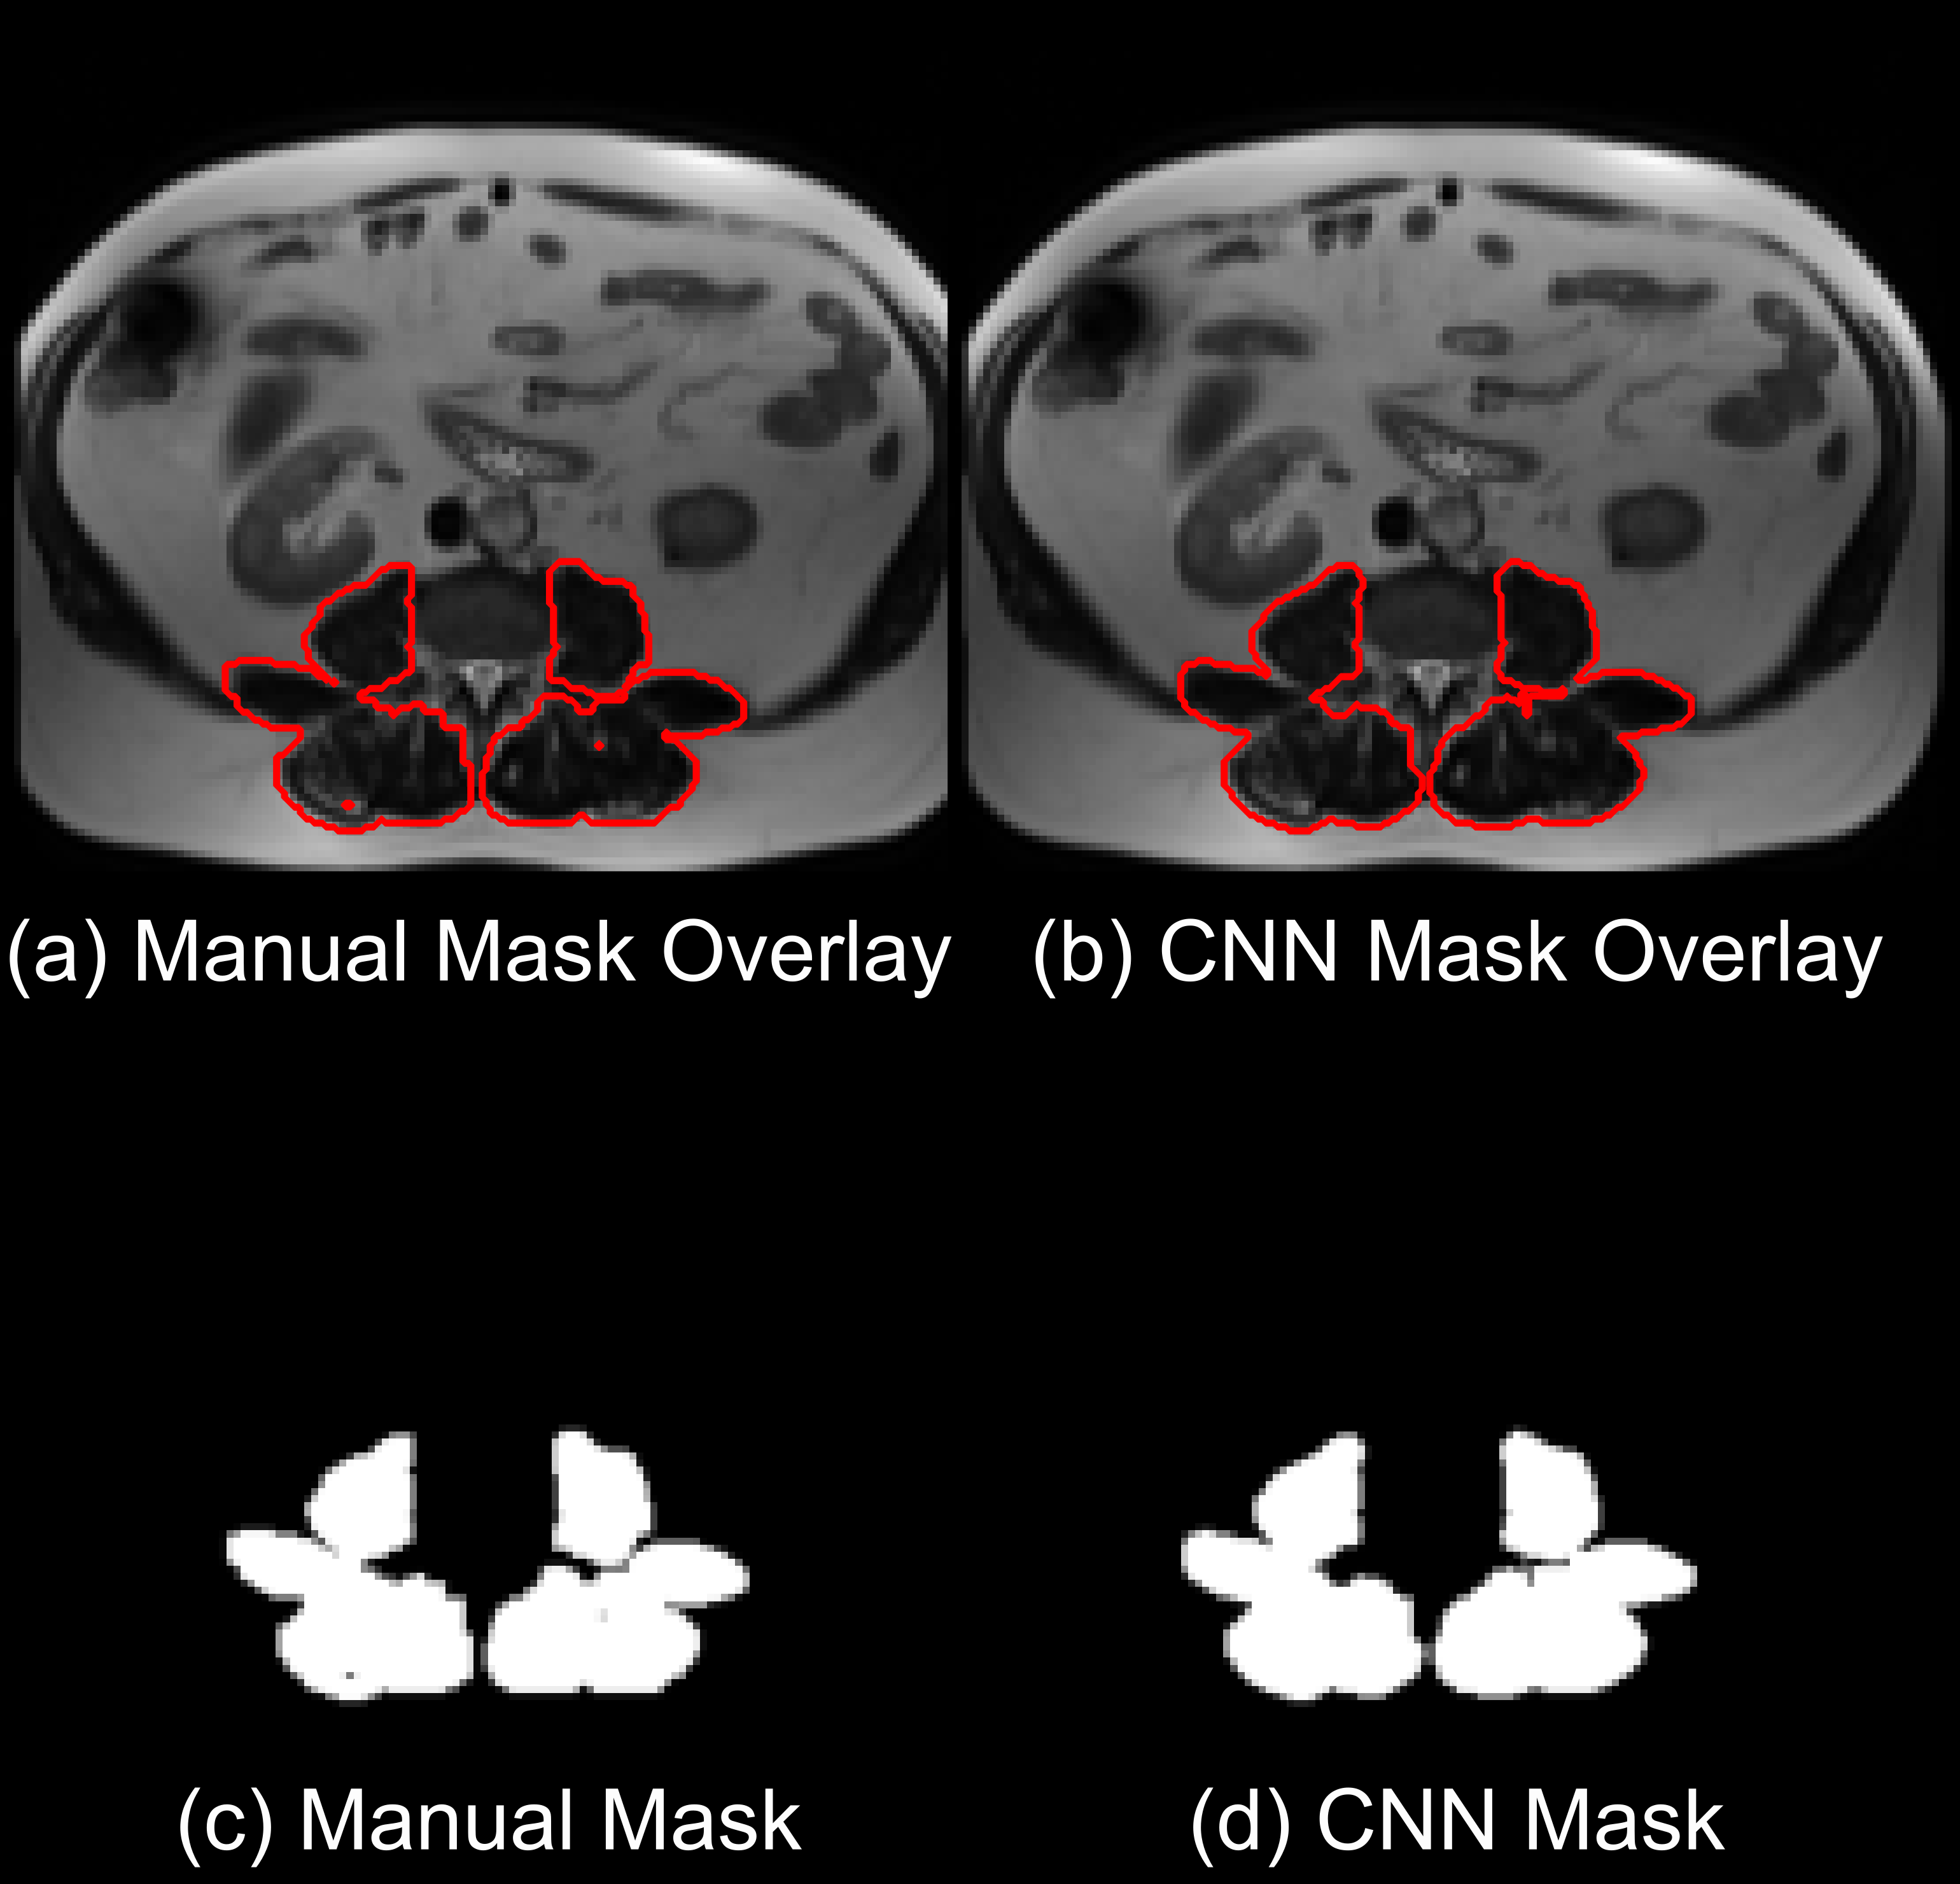
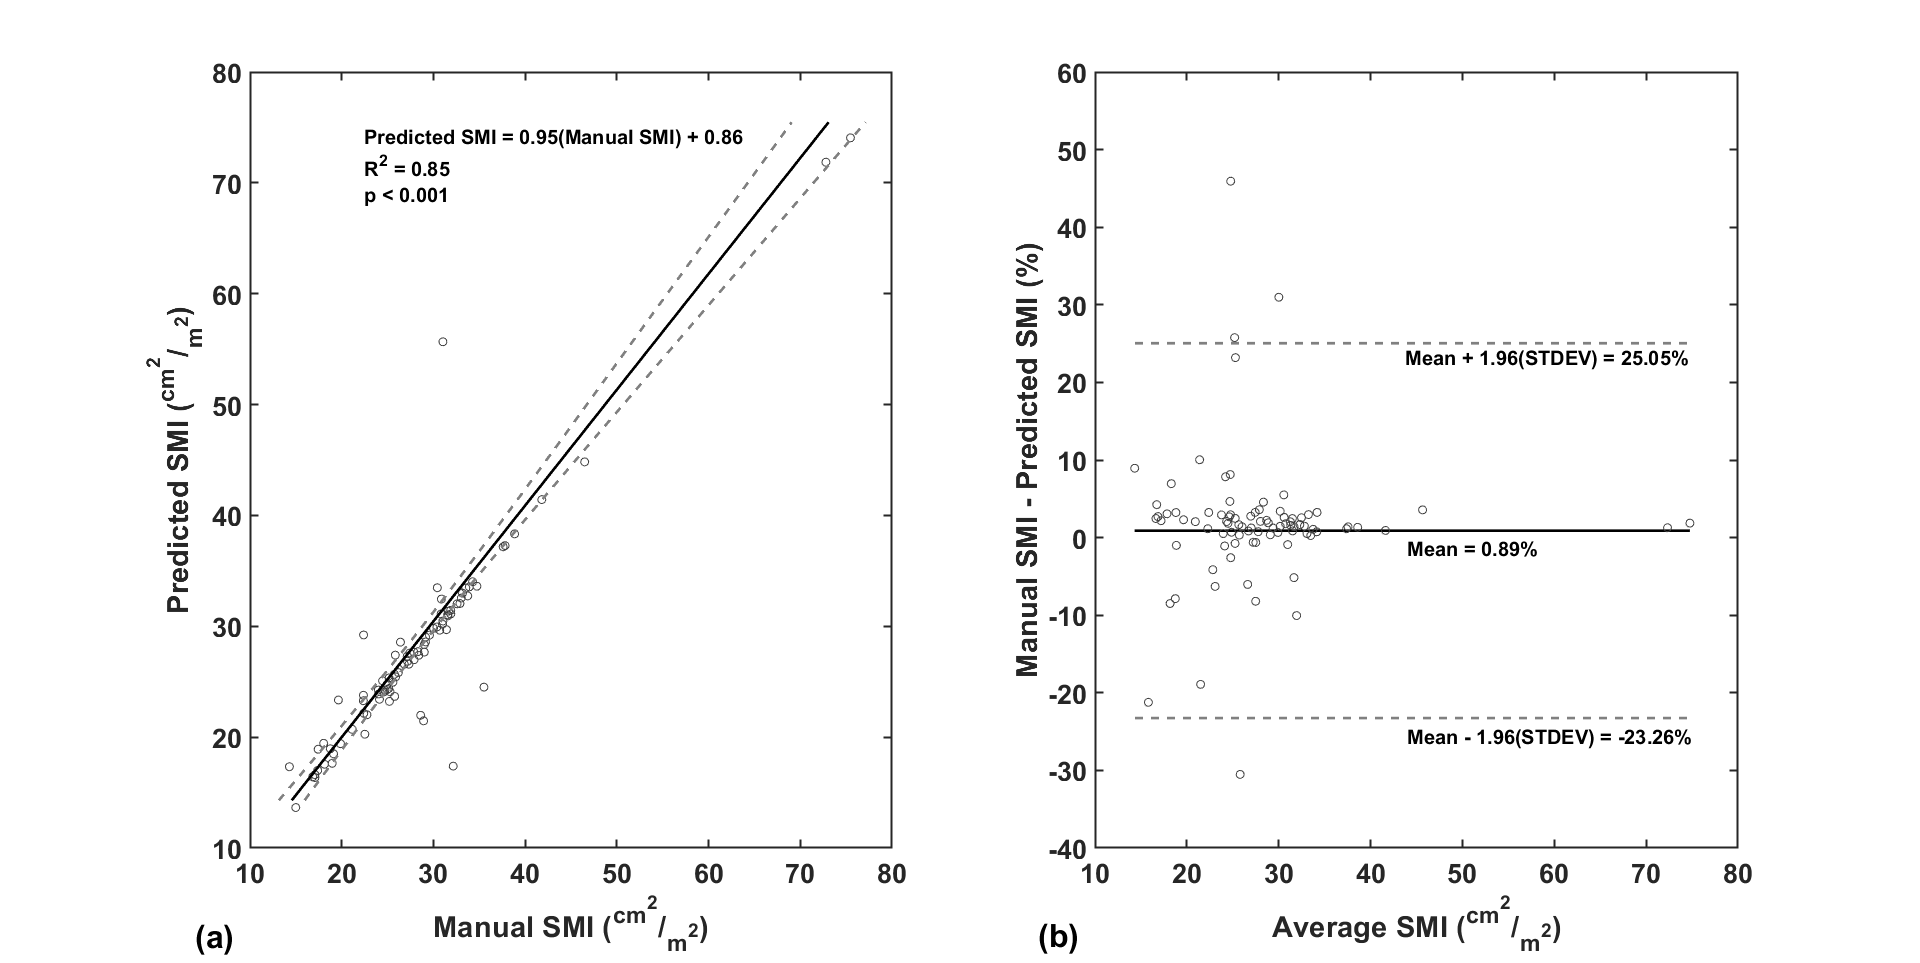
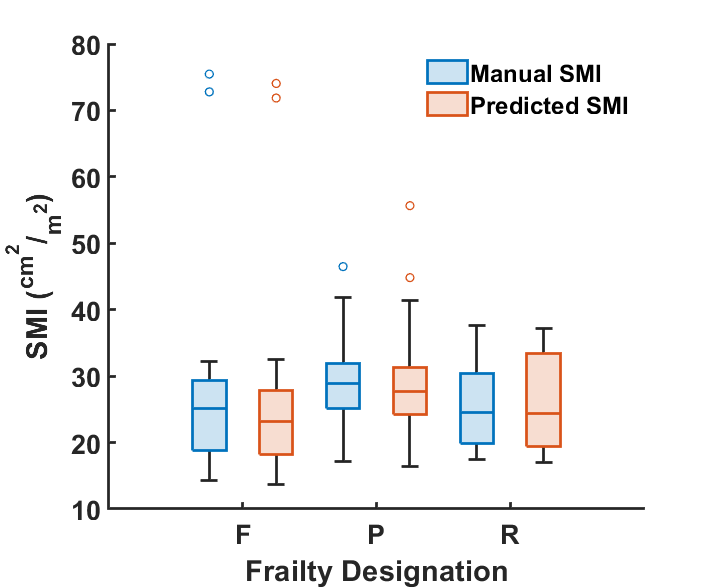
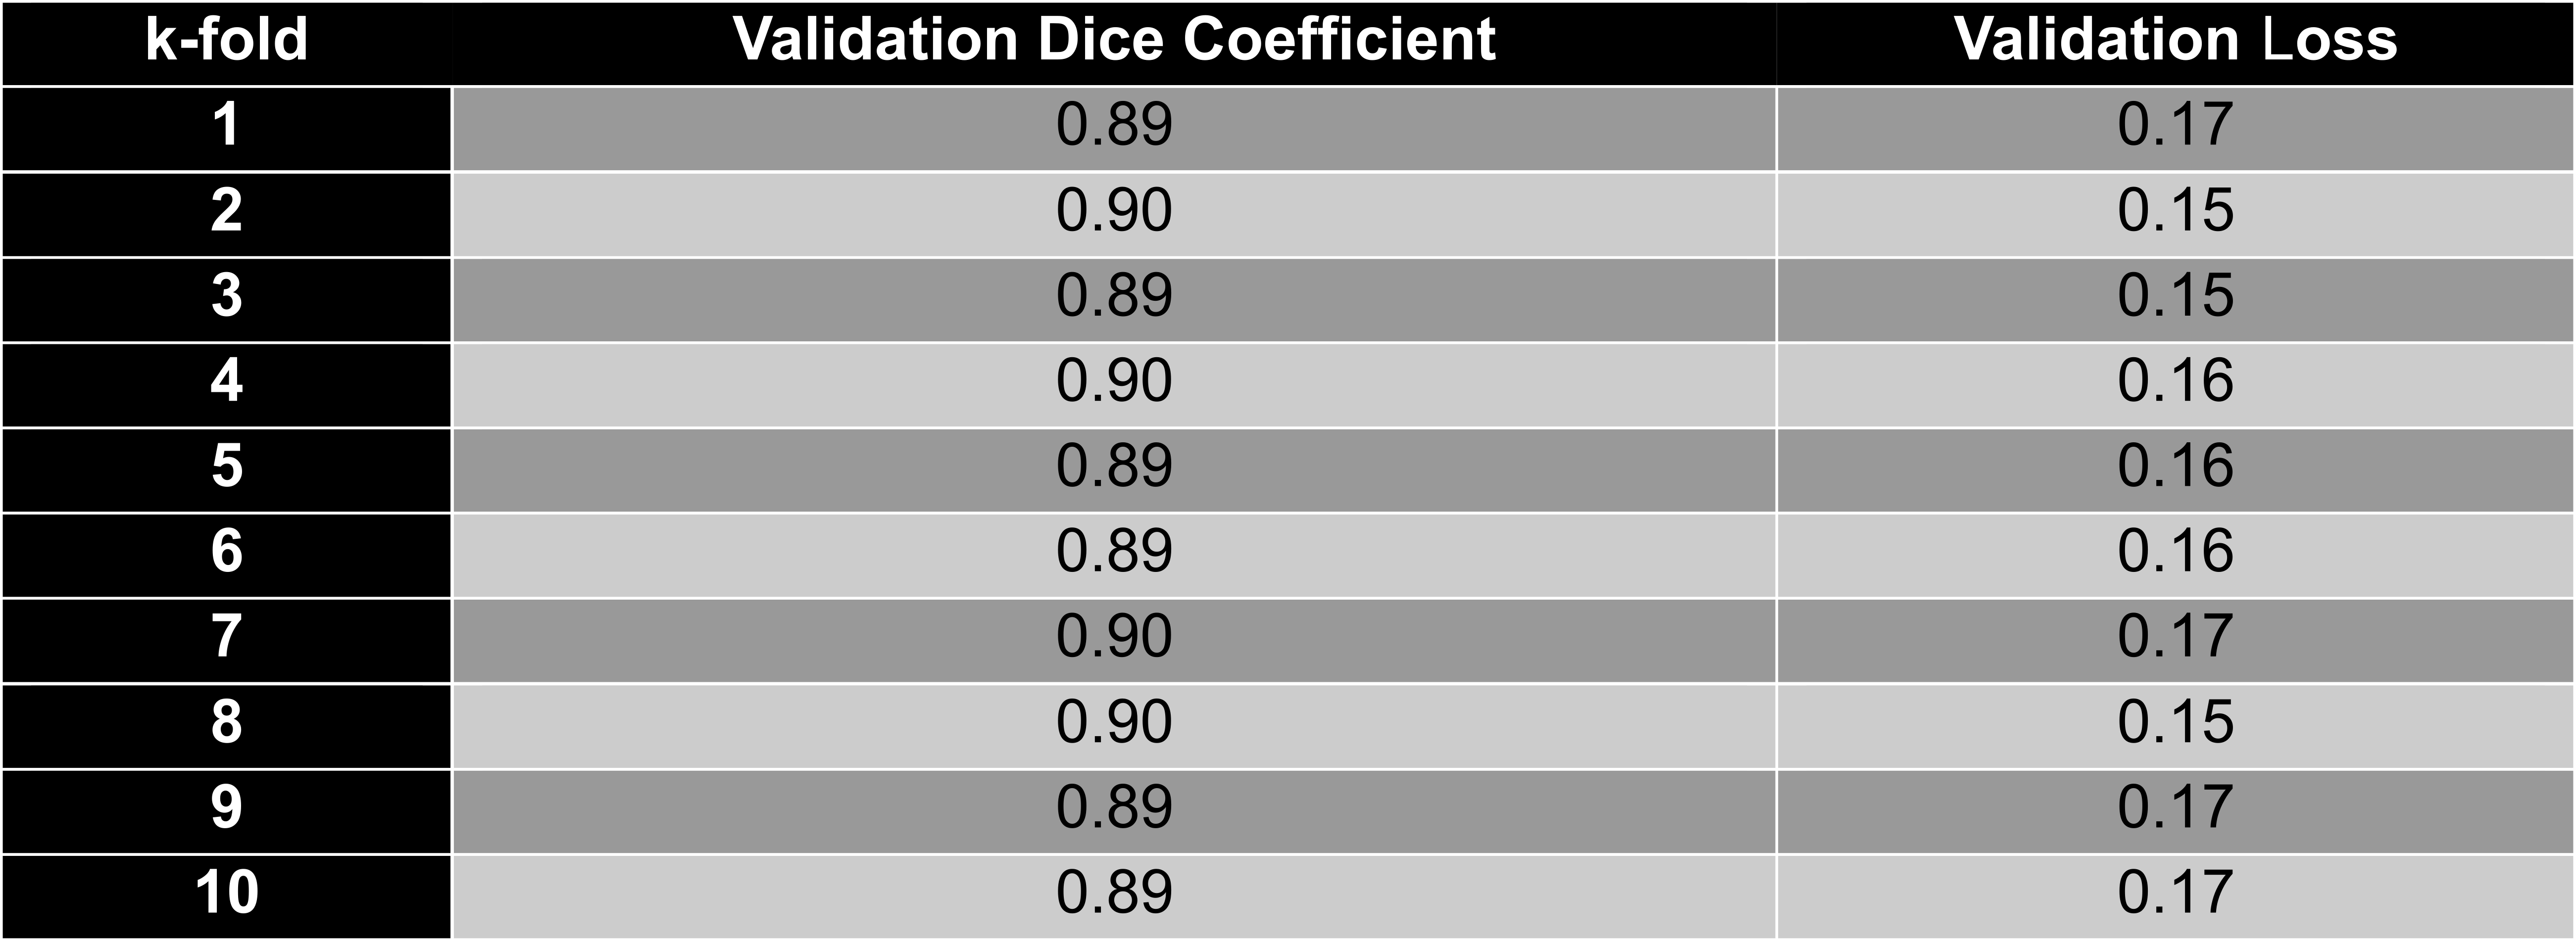
All Dice coefficients and loss in 10-fold cross validation (Table 1) were above 0.88 and below 0.18, respectively. CNN predicted and manual paraspinal muscle areas had excellent agreement (Figure 2), where majority of muscle areas coincided.Linear regression analysis of CNN SMI and manual SMI showed a slope close to unity with excellent correlation (R2=0.85) and the Bland-Altman plot shows a mean bias of 0.89% (Figure 3). The bias for most cases was less than 10%, but a few outliers exceeded the limits of agreement. Among frailty groups and SMI estimation methods (Figure 4), there was no statistical difference among groups, p=0.942. Among the test set, there was no statistical significance, p=0.432 , between CNN SMI and manual SMI.
Discussion
The purpose of this study was to develop an automatic segmentation algorithm to ease manual paraspinal segmentation for SMI estimation, an important prognostic for liver transplantation outcomes. Automation can accelerate SMI’s incorporation into clinical practice.Dice coefficient being above 0.88, no statistical significance, and minimal bias suggest SMI can be estimated automatically using our proposed CNN. Dice coefficient has reached 0.95 in paraspinal CT and thigh MRI studies with greater sample size5. Outliers not within the limit of agreement warrants further investigation and improvements, and they may originate from varying muscle morphology and sarcopenia severity.
Despite no difference between frail and prefrail patients with manual SMI, this may differ with more inpatient patients in this retrospective study. CNN SMI coincided with manual results, suggesting that CNN SMI may not affect clinical studies.
Future work would increase model generalizability by segmenting GRE Dixon images to quantify proton density fat fraction. This could be challenging as the contrast is visually reversed, although shown possible for liver segmentation9. Secondly, the model can be improved to segment muscle volume, rather than restricting to a single slice. Further, SMI and PDFF can also potentially be applied to musculoskeletal problems.
Conclusion
An automatic paraspinal muscle segmentation was developed to reduce manual segmentation burden, potentially enabling SMI measurements in a clinical setting to predict liver transplantation outcomes in cirrhotic patients. This work can progress into making PDFF and muscle volume quantification practical in hepatology and in musculoskeletal clinical problems.Acknowledgements
Research Jump-Start Pilot (RJSP) Program from Northwell HealthReferences
1. Tandon P, Montano-Loza AJ, Lai JC, Dasarathy S, Merli M. Sarcopenia and frailty in decompensated cirrhosis. Journal of Hepatology. 2021;75:S147-S162. doi:10.1016/j.jhep.2021.01.025
2. Shenvi SD, Taber DJ, Hardie AD, Botstein JO, McGillicuddy JW. Assessment of magnetic resonance imaging derived fat fraction as a sensitive and reliable predictor of myosteatosis in liver transplant recipients. HPB. 2020;22(1):102-108. doi:10.1016/j.hpb.2019.06.006
3. Hamaguchi Y, Kaido T, Okumura S, et al. Including body composition in MELD scores improves mortality prediction among patients awaiting liver transplantation. Clinical Nutrition. 2020;39(6):1885-1892. doi:10.1016/j.clnu.2019.08.012
4. Beer L, Bastati N, Ba-Ssalamah A, et al. MRI-defined sarcopenia predicts mortality in patients with chronic liver disease. Liver International. 2020;40(11):2797-2807. doi:10.1111/liv.14648
5. Rozynek M, Kucybała I, Urbanik A, Wojciechowski W. Use of artificial intelligence in the imaging of sarcopenia: A narrative review of current status and perspectives. Nutrition. 2021;89:111227. doi:10.1016/j.nut.2021.111227
6. Engelke K, Chaudry O, Gast L, et al. Magnetic resonance imaging techniques for the quantitative analysis of skeletal muscle: State of the art. Journal of Orthopaedic Translation. 2023;42:57-72. doi:10.1016/j.jot.2023.07.005
7. Ronneberger O, Fischer P, Brox T. U-Net: Convolutional Networks for Biomedical Image Segmentation. In: Navab N, Hornegger J, Wells WM, Frangi AF, eds. Medical Image Computing and Computer-Assisted Intervention – MICCAI 2015. Springer International Publishing; 2015:234-241.
8. Yushkevich PA, Piven J, Hazlett HC, et al. User-guided 3D active contour segmentation of anatomical structures: Significantly improved efficiency and reliability. NeuroImage. 2006;31(3):1116-1128. doi:10.1016/j.neuroimage.2006.01.015
9. Wang K, Mamidipalli A, Retson T, et al. Automated CT and MRI Liver Segmentation and Biometry Using a Generalized Convolutional Neural Network. Radiology: Artificial Intelligence. 2019;1(2):180022. doi:10.1148/ryai.2019180022
10. Lai JC, Covinsky KE, McCulloch CE, Feng S. The Liver Frailty Index Improves Mortality Prediction of the Subjective Clinician Assessment in Patients With Cirrhosis. Official journal of the American College of Gastroenterology | ACG. 2018;113(2).
Figures