2111
Automated Deep Learning-based Stiffness Quantification in Magnetic Resonance Elastography of the Liver1University of Rzeszow, Rzeszow, Poland, 2Clinical Hospital No. 2 in Rzeszow, Rzeszow, Poland
Synopsis
Keywords: Analysis/Processing, Elastography
Motivation: The assessment of liver MRE exams is time-consuming, as is the reconstruction process performed by the scanner.
Goal(s): Our objective was to automate the reconstruction and evaluation of stiffness maps, allowing for the calculation of liver stiffness based solely on MRE data, all accomplished within a matter of seconds.
Approach: To achieve this, we developed a U-Net-based model combination that takes both magnitude and phase MRE images as input. This model generates stiffness maps and corresponding ROIs while also estimating stiffness within the ROI.
Results: The proposed model successfully and accurately estimated liver stiffness, reducing the entire process to a few seconds.
Impact: The proposed model can effectively assess liver stiffness using MRE data, substantially decreasing image reconstruction and analysis time to just a few seconds - a crucial advancement for clinical applications.
Introduction
Magnetic Resonance Elastography (MRE) represents a rapidly advancing imaging technique that enables non-invasive, quantitative evaluation of liver stiffness. Despite its clinical potential, the analysis of MRE examinations remains time-consuming and susceptible to human-related errors, primarily stemming from the manual delineation of regions of interest (ROIs) on parametric maps. Moreover, the processing of acquired images requires the application of inversion algorithms, further extending the duration of MRE data analysis. Recent advancements in artificial intelligence, particularly within the domain of deep learning (DL), have motivated our exploration of the potential of DL techniques for the automation of stiffness map generation and ROI delineation. This project aims to expedite the interpretation of liver MRE exams, addressing a critical need for efficiency and accuracy in clinical practice.Methods
In this retrospective IRB-approved study, we used 76 MRE datasets from both healthy volunteers and patients with non-alcoholic fatty liver disease and alcoholic liver disease acquired using a 1.5T whole-body MRI scanner between June 2016 and November 2019. The datasets were split into three sets: 58 datasets were used for training, 12 for validation, and 6 for final testing. For each dataset, an experienced radiologist manually outlined an ROI following the QIBA recommendations.1,2 T2-weighted anatomical images were employed to enhance the precision of ROI delineation, while only data derived from MRE were used for training. Two U-Net-based3 models, one for the reconstruction of stiffness maps and the other for the segmentation of ROIs were trained and later fused. The network input was composed of normalized magnitude and phase images at different phase offsets combined into single volumes for each image slice. Structural Similarity Index (SSIM) and Mean Absolute Error (MAE) were calculated to assess the quality of the generated stiffness maps. To evaluate segmentation accuracy, Dice score, sensitivity, specificity, AUROC, and Hausdorff Distance (HD) were computed. Additionally, the Wilcoxon rank test and Bland-Altman analysis were performed to compare the stiffness values obtained from both methods, and the Intraclass Correlation Coefficient (ICC) was calculated to assess the agreement between them.Results
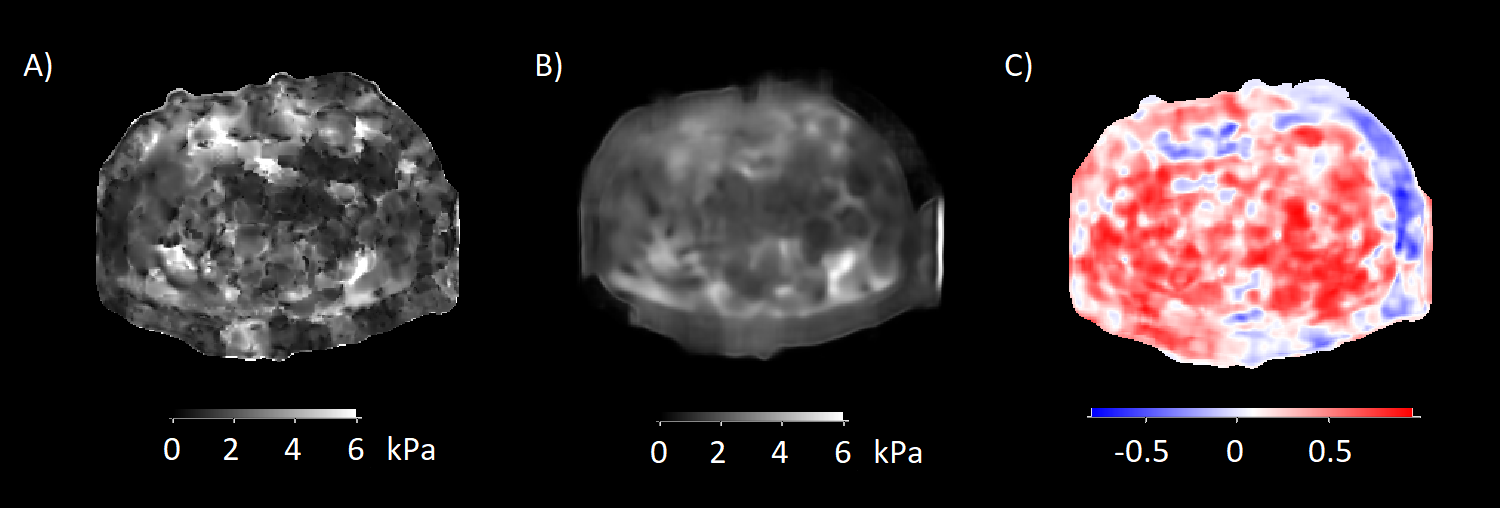
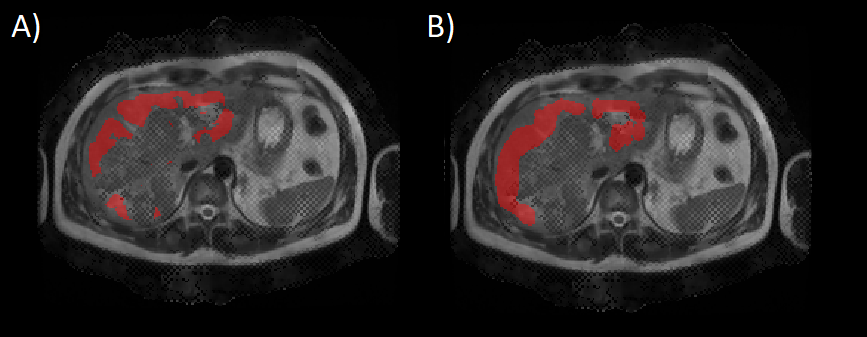
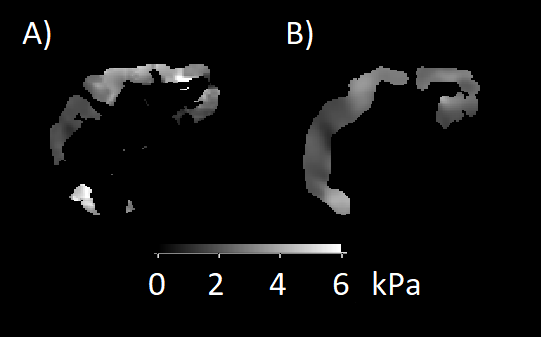
The mean±SD SSIM (Figure 1) for the predicted stiffness maps was 0.58±0.03 (range 0.54–0.63), and the mean±SD MAE was 0.41±0.06 kPa (range 0.31–0.48 kPa). The mean±SD values for the segmentation metrics (Figure 2) were as follows: Dice score – 0.63±0.06 (range 0.54–0.70), specificity – 0.99±0.01 (range 0.98 – 0.99), sensitivity – 0.76±0.10 (range 0.60–0.90), AUROC – 0.87±0.05 (0.80–0.95), and HD – 1.50±0.07 (range 1.41–1.57). The stiffness values obtained using manually drawn masks on the scanner-generated stiffness maps exhibited no significant difference compared to the stiffness values obtained through DL methods (p=0.44). The mean±SD values were 2.52±0.29 kPa (range 2.16–3.02 kPa) and 2.56±0.34 kPa (range 2.06–3.13 kPa), respectively (Figure 3). An ICC of 0.94 (95% CI, 0.79–0.98) and the result of the Bland-Altman analysis with a bias of 0.04 kPa (95% limits of agreement -0.26 to 0.18 kPa) further demonstrated very strong agreement between the stiffness values obtained with these methods.Discussion
The automation of the MRE evaluation process is a pertinent challenge that numerous researchers are actively addressing.4-6 The proposed model shows considerable reconstruction and segmentation performance and also overcomes certain limitations encountered by previous research efforts. Specifically: i) Not only ROI segmentation but also the reconstruction of stiffness maps is automated, leading to a remarkable reduction in the time required for the interpretation of MRE data, now taking mere seconds; ii) The ground-truth masks utilized in this study were drawn with the aid of T2-weighted images for improved accuracy. The models, however, were trained exclusively with MRE data, excluding the need for additional MRI data; iii) Both magnitude and phase data were employed for model training, enhancing the model's ability to interpret the complex nature of MRE data. The primary limitation of this study is the relatively small dataset used and its retrospective, single-institution nature. This limitation may constrain the generalizability of the developed model beyond the specific context of this study.Conclusion
This study demonstrates the robustness of DL-based models for MRE analysis, even when trained on a relatively small dataset. While the discrepancy between the generated stiffness maps and ground truth remains noticeable, and the DL-generated ROIs may not yet detect minor details such as small vessels, the results hold great promise. Using the presented model, the time required for the evaluation of MRE exams can be reduced to a matter of seconds, enhancing the efficiency of MRE interpretation, and offering a strong foundation for further research and development in this domain.Acknowledgements
No acknowledgement found.References
REFERENCES:
1) Quantitative Imaging Biomarkers Alliance (QIBA). (2018). Consensus Profile. https://qibawiki.rsna.org/images/a/a5/MRE-QIBAProfile-2018-05-02-CONSENSUS.pdf. Accessed November 07, 2023.
2) Quantitative Imaging Biomarkers Alliance (QIBA). (2022). Technically Confirmed Profile. https://qibawiki.rsna.org/images/5/54/MRE-QIBAProfile-2022-02-14-TECHNICALLY-CONFIRMED.pdf. Accessed November 07, 2023.
3) Ronneberger, O., Fischer, P., Brox, T. U-Net: Convolutional Networks for Biomedical Image Segmentation. In: Navab, N., Hornegger, J., Wells, W., Frangi, A. (eds) Medical Image Computing and Computer-Assisted Intervention – MICCAI 2015. MICCAI 2015. Lecture Notes in Computer Science 2015, vol 9351. Springer, Cham. https://doi.org/10.1007/978-3-319-24574-4_28
4) Dzyubak, B., Venkatesh, S. K., Manduca, et al. Automated liver elasticity calculation for MR elastography. J Magn Reson Imaging 2016, 43(5), 1055–1063. https://doi.org/10.1002/jmri.25072
5) Pollack, B.L, Batmanghelich, K., Cai, S.S., et al. Deep Learning Prediction of Voxel-Level Liver Stiffness in Patients with Nonalcoholic Fatty Liver Disease. Radiology: Artificial Intelligence. 2021; 3:6. https://doi.org/10.1148/ryai.2021200274
6) Cunha, G.M., Delgado, T.I., Middleton, M.S., et al. Automated CNN–Based Analysis Versus Manual Analysis for MR Elastography in Nonalcoholic Fatty Liver Disease: Intermethod Agreement and Fibrosis Stage Discriminative Performance. American Journal of Roentgenology. 2022; 219(2). https://doi.org/10.2214/AJR.21.27135
Figures