2110
Acquisition of Ktrans perfusion parameter maps from DCE-MRI using a deep learning approach1Paul C. Lauterbur Research Center for Biomedical Imaging, Shenzhen Institute of Advanced Technology, Chinese Academy of Sciences, Shenzhen, China, 2School of Mathematics and Statistics, Minnan Normal University, Zhangzhou, China, 3Medical Imaging Center, Shenzhen Hospital, Southern Medical University, Shenzhen, China, 4Key Laboratory of Biomedical Imaging Science and System, Chinese Academy of Sciences, Shenzhen, China, 5United Imaging Research Institute of Innovative Medical Equipment, Shenzhen, China
Synopsis
Keywords: Analysis/Processing, Breast
Motivation: Breast cancer has become the leading cancer worldwide. Hemodynamic features obtained from breast DCE-MRI perfusion maps can accurately quantify tumor pathophysiology. However, traditional estimation of perfusion parameter maps requires significant computational resources and time.
Goal(s): To investigate whether deep learning techniques can synthesize Ktrans perfusion parameter maps from contrast-enhanced MRI.
Approach: A pix2pix-based cGAN architecture was proposed to generate breast Ktrans perfusion maps.
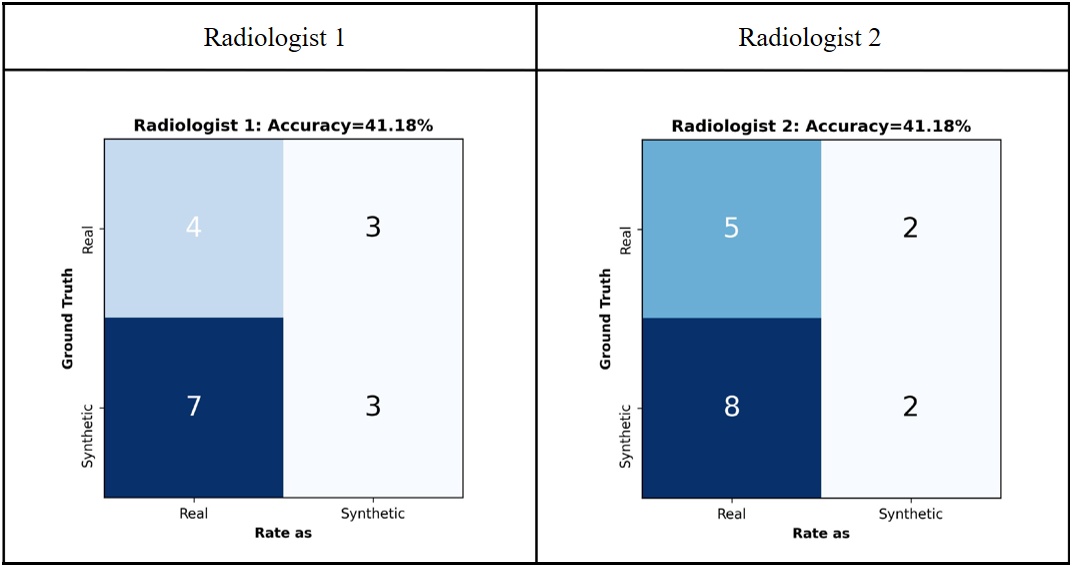
Results: The Ktrans values of the tumor regions in the synthetic and real Ktrans maps show a strong correlation. Two experienced radiologists could not distinguish between real and synthetic Ktrans maps.
Impact: This study presents a novel feasible approach for synthesizing Ktrans perfusion maps, which enables rapid generation of high-quality and low-noise perfusion maps, thereby facilitating more effective application of these maps in clinical practice by physicians.
INTRODUCTION
Breast cancer has become the leading cancer worldwide1. Dynamic contrast-enhanced magnetic resonance imaging (DCE-MRI) is a widely employed diagnostic imaging modality for the detection of breast tumors due to its indispensable role in clinical practice. Hemodynamic features obtained from breast DCE-MRI perfusion maps can accurately quantify tumor pathophysiology2-4. Traditional estimation of perfusion parameter maps requires significant computational resources and time5. The application of deep learning in medical image synthesis has received increasing attention6. However, there have been limited investigations conducted thus far on the utilization of deep learning techniques for the synthesis of perfusion parameter maps. In the current study, we proposed and evaluated a method of synthesizing Ktrans perfusion maps from contrast-enhanced MRI using a deep learning method.METHODS
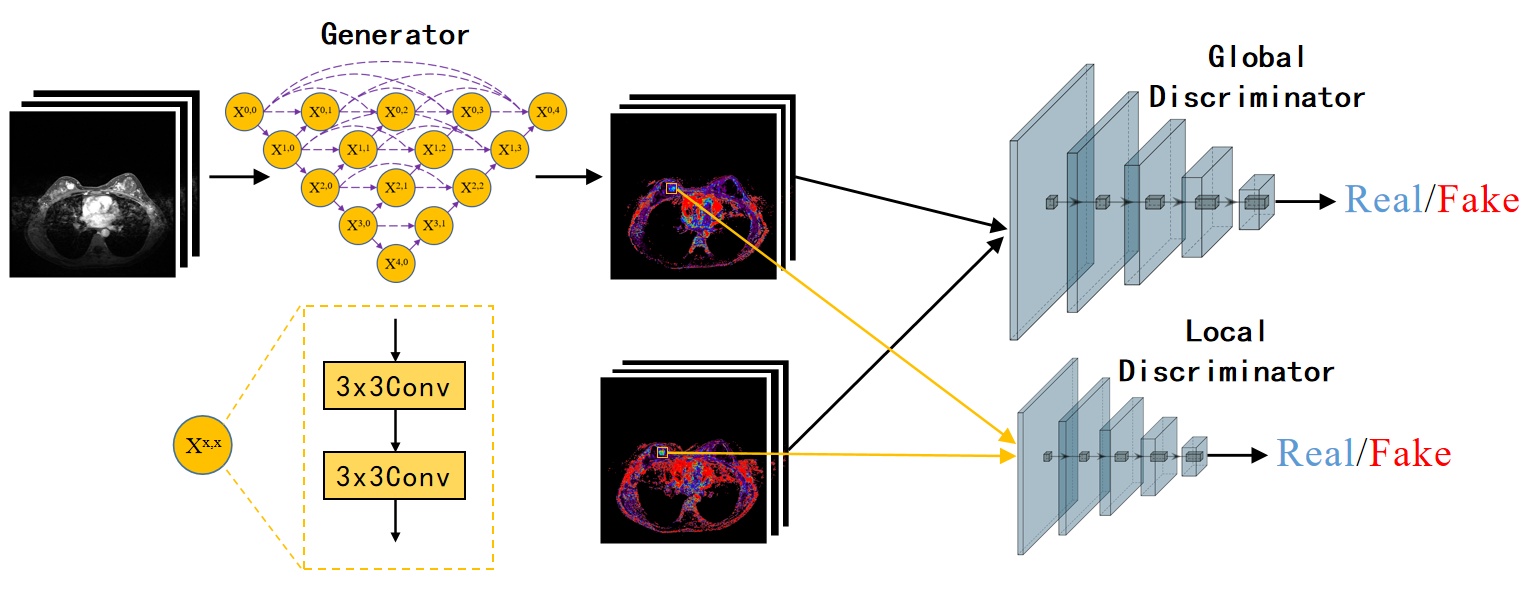
DCE-MRI data were acquired from 80 patients with breast cancer on a commercial 3.0 T scanner (uMR 790, United Imaging Healthcare, Shanghai, China). Ground truth acquisition was performed using dedicated medical image processing software (uWS-MR, United Imaging Healthcare, Shanghai, China) by an experienced radiologist. After excluding 10 patients who had severely motion-induced artifact images, we only used 767 slices containing tumors from the 70 patients. Among them, 615 slices from 53 subjects were used as the training set, and 189 slices from 17 patients were used as the test set. Before being input into the networks, each DCE slice and Ktrans map was normalized to the range (0, 1). A Pix2pix-based deep learning architecture was proposed to generate breast Ktrans perfusion maps. UNet++ was used as the generator architecture. The discriminator of the pix2pix model used a convolutional neural network named patchGAN, which is primarily used to determine whether the generated image is real or fake.RESULTS
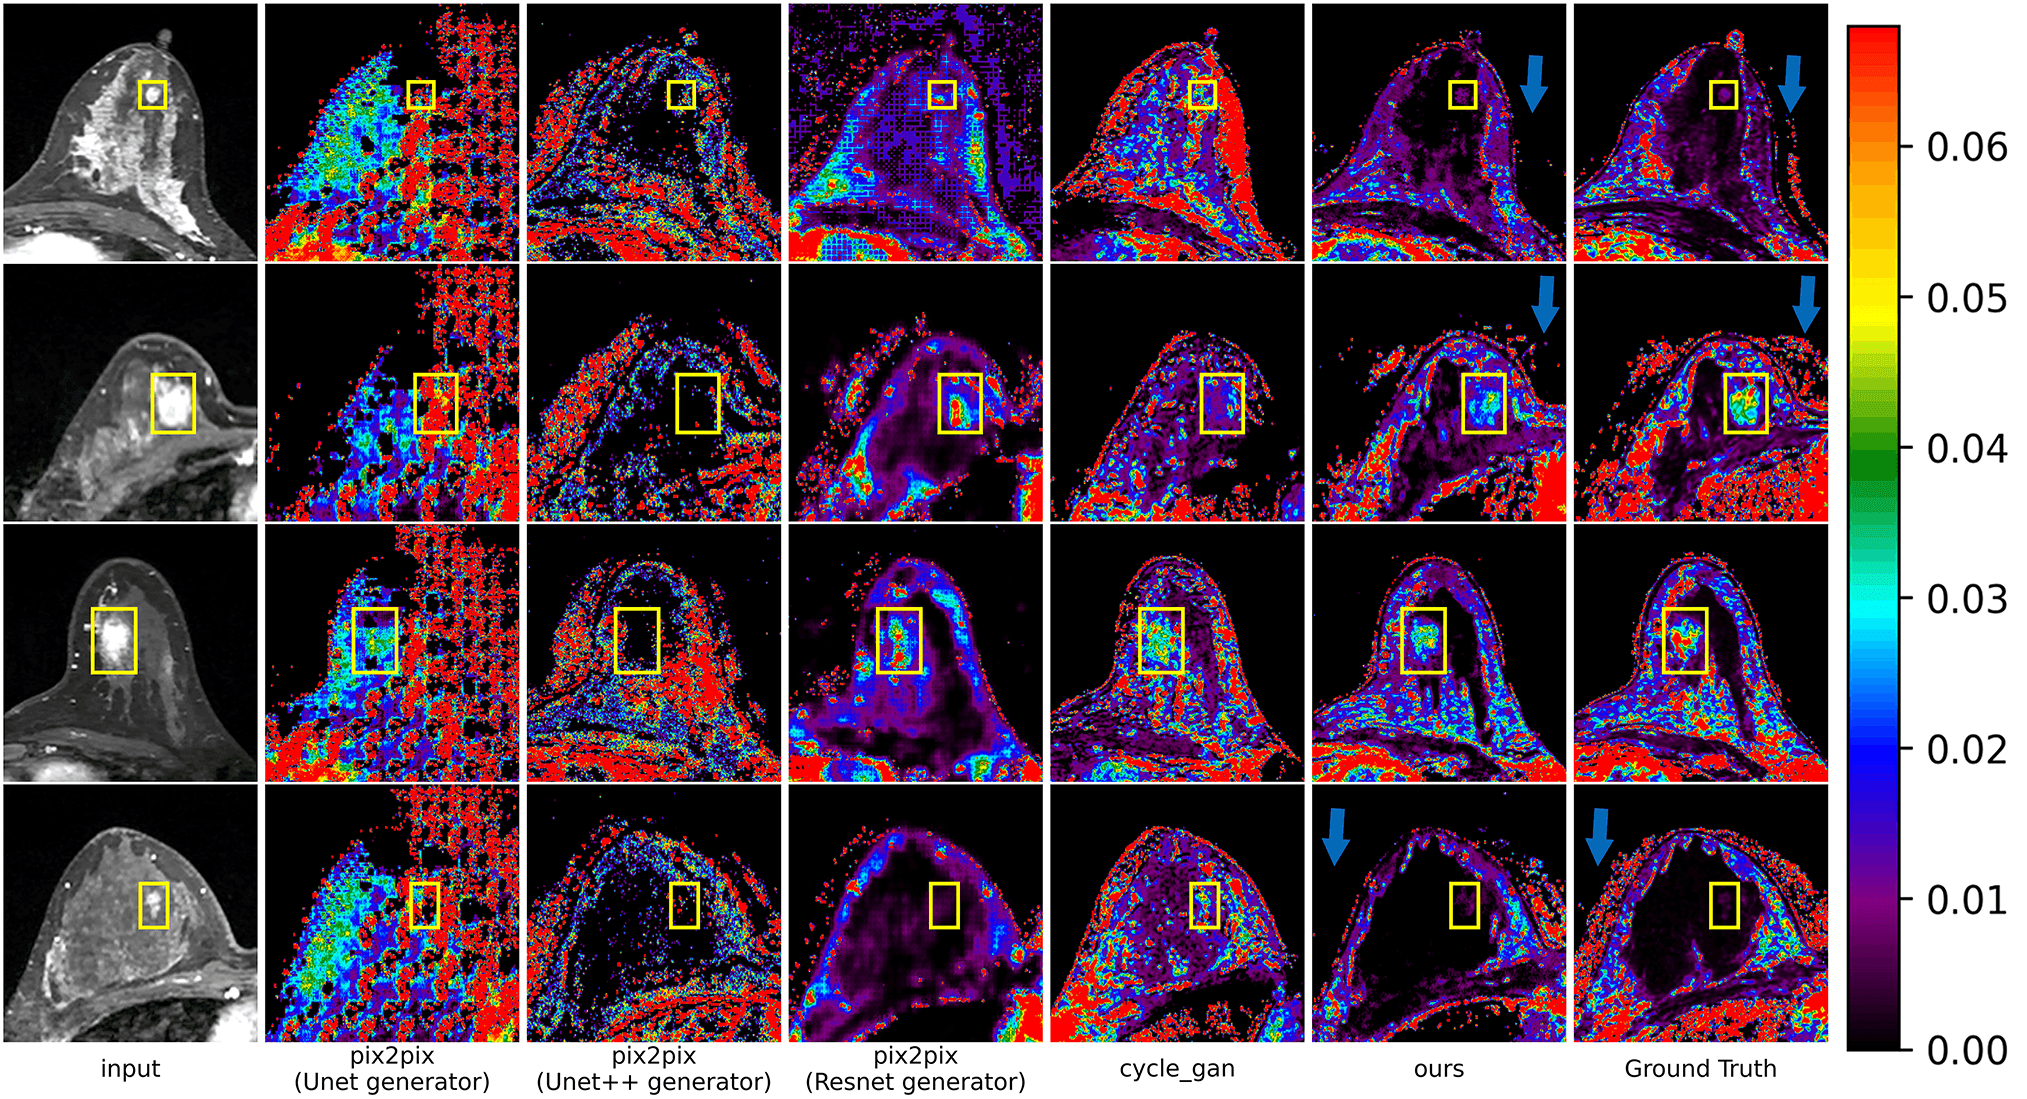
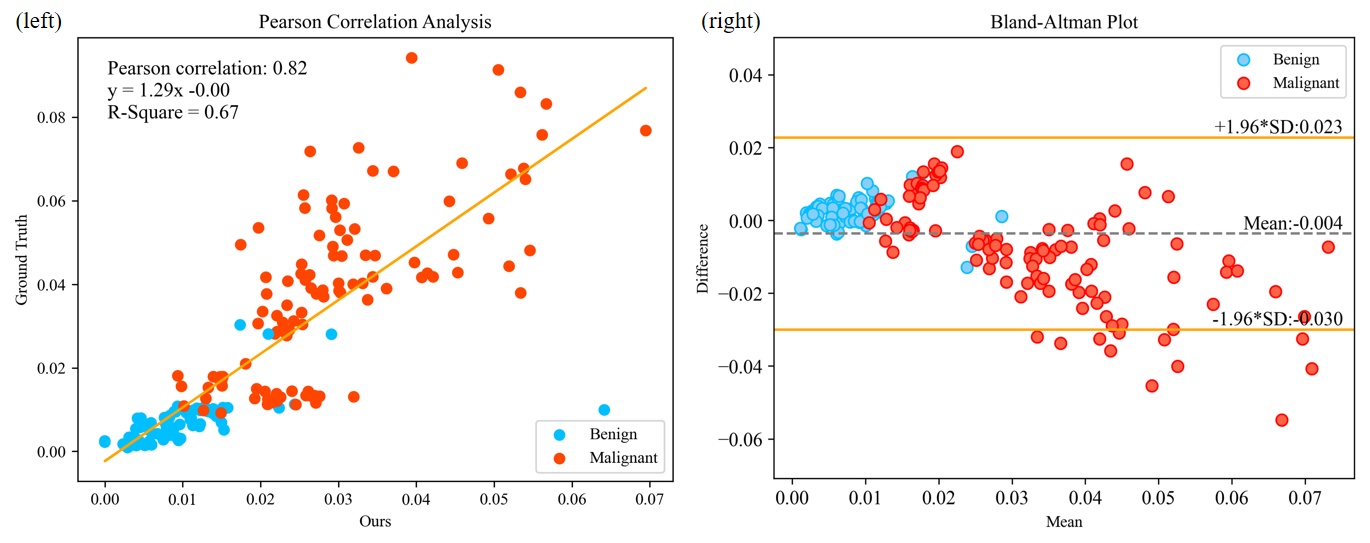
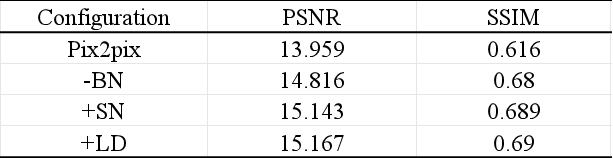
The results of the ablation experiment are summarized in Table 1, and the effectiveness of each module was validated in the ablation experiment. The BN layer of the discriminator was removed and replaced with an SN layer. In addition, a local discriminator (LD) was added to the model. The represented Ktrans maps synthesized by different models are shown in Figure 2. Compared to the other models, the Ktrans maps synthesized by our model are most similar to the real Ktrans maps, with less noise, as indicated by the blue arrows. Figure 3 (left) displays the linear relationship between the synthetic and the real Ktrans values of 189 tumor regions in the test set, with a coefficient of determination (R-square) of 0.67. The Pearson correlation coefficient between these Ktrans values was 0.82, indicating a strong correlation. Figure 3 (right) shows that the majority of data points fell within the 95% limits of agreement, and data points with small differences were usually near the mean bias line. As shown in Figure 4, both radiologists were able to correctly determine whether a presented parametric map was real or synthetic for 7 of 17 maps, indicating that they could not distinguish between real and synthetic parametric maps. In addition, there were significant differences in synthesized Ktrans values between benign and malignant tumors, indicating that synthetic Ktrans can be used to distinguish benign from malignant breast cancer.DISCUSSION
For larger tumor images, our method can synthesize good results. In the synthetic maps, the tumor region obviously contrasts with surrounding tissues, and the vascular permeability of tumor tissue can be accurately reflected. However, for smaller tumor maps, our model encounters severe class imbalance problems during the learning process. This is because the number of voxels in the tumor region of contrast-enhanced MR images is considerably fewer than the background, resulting in a noticeable disparity between the tumor region in the synthetic Ktrans map and the real tumor region. Moreover, our dataset consisted of DCE-MR images and corresponding Ktrans maps. We used a deep learning approach to synthesize the Ktrans maps, but they are still limited by the quality of the original Ktrans maps, which were estimated using traditional methods based on pharmacokinetic analysis models and suffer from issues such as noise and artifacts. These issues may interfere with our deep learning model during the training process and have a certain impact on the model's performance.CONCLUSION
The synthesis of breast Ktrans perfusion parameter maps from DCE-MRI is enabled by the proposed deep learning-based method. This provides a new feasible solution for the clinical use of Ktrans.Acknowledgements
The study was partially support by Natural Science Foundation of Guangdong Province-Outstanding Youth Project (2023B1515020002), National Key Technology Research and Development Program of China (2021YFF0501502), Key Laboratory for Magnetic Resonance and Multimodality Imaging of Guangdong Province (2023B1212060052), and Central guidance for local science and technology development project (ZYYD2023D02).References
1. Sung H, Ferlay J, Siegel RL, et al. Global cancer statistics 2020: GLOBOCAN estimates of incidence and mortality worldwide for 36 cancers in 185 countries. CA: a cancer journal for clinicians 2021;71(3):209-249.
2. Parker GJ, Buckley DL. Tracer kinetic modelling for T1-weighted DCE-MRI. Dynamic contrast-enhanced magnetic resonance imaging in oncology: Springer; 2005. p. 81-92.
3. Lebel RM, Jones J, Ferre JC, Law M, Nayak KS. Highly accelerated dynamic contrast enhanced imaging. Magnetic Resonance in Medicine 2014;71(2):635-644.
4. Ulas C, Das D, Thrippleton MJ, et al. Convolutional neural networks for direct inference of pharmacokinetic parameters: application to stroke dynamic contrast-enhanced MRI. Frontiers in neurology 2019;9:1147.
5. Ottens T, Barbieri S, Orton MR, et al. Deep learning DCE-MRI parameter estimation: Application in pancreatic cancer. Medical Image Analysis 2022;80:102512.
6. Oh G, Moon W-J, Ye JC. Unpaired Deep Learning for Pharmacokinetic Parameter Estimation from Dynamic Contrast-Enhanced MRI. arXiv preprint arXiv:230604339 2023.
Figures