2109
Quantitative Thyroid Volume Analysis in Healthy, Hypo and Hyperthyroid Individuals Using T2-Weighted MRI and Artificial Intelligence1AI, Voxelwise Imaging Technology Inc., Vancouver, BC, Canada, 2Prenuvo, Vancouver, BC, Canada, 3Early Medical, Austin, TX USA; The Institute of Neurodegenerative Diseases of Florida, Boca Raton, FL, USA, Boca Raton, FL, United States
Synopsis
Keywords: Analysis/Processing, Machine Learning/Artificial Intelligence, thyroid segmentation, MRI, hypothyroidism, hyperthyroidism
Motivation: Assess the feasibility of calculating thyroid volumes using T2-weighted MR imaging.
Goal(s): Quantify thyroid volume using deep learning methods in healthy, hypo and hyperthyroid patients.
Approach: We assessed MRIs of 469 healthy, 606 hypothyroid, and 203 hyperthyroid individuals, matched for age, weight, and height.
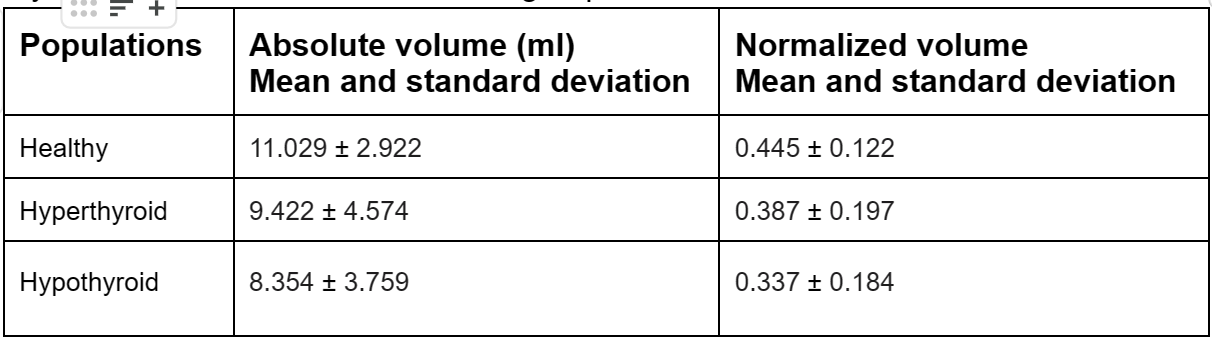
Results: Findings indicated altered thyroid volumes in healthy (11.02 ml), hyperthyroid (9.42 ml), and hypothyroid (8.35 ml), BMI-normalized volumes also differed: healthy (0.445), hyperthyroid (0.387), and hypothyroid (0.337). There is a moderate association between thyroid volume and weight (0.41, p=3.2e-25) and a weaker link with height (0.17, p=3.9e-05).
Impact: MRI-based analysis of thyroid volumes in healthy, hyper and hypothyroid patients using deep learning, revealing varied absolute and BMI-based normalized volumes.
INTRODUCTION
MRI offers non-invasive assessment of thyroid gland in thyroid disorders, aiding detailed evaluation of volume and structure [1, 2]. In both hypo- and hyperthyroidism, alterations in thyroid volume can occur, influencing the gland's size and structure. Ultrasonography is the gold standard for thyroid volume assessment, offering high sensitivity in visualizing nodules and structural changes. It is widely used in clinical settings for quick and effective thyroid evaluation [3]. Recent studies highlight MRI's ability to accurately assess thyroid volume, offering vital insights for disease management. [3].The study aims to explore MRI's accuracy in assessing thyroid volume changes in hypo and hyperthyroidism, providing insights for diagnosis, quantification and treatment [4]. Through detailed examination and quantification of thyroid volume, this research aims to contribute to a deeper understanding of how MRI can assist in clinical management and decision-making for individuals with thyroid disorders.
METHODS
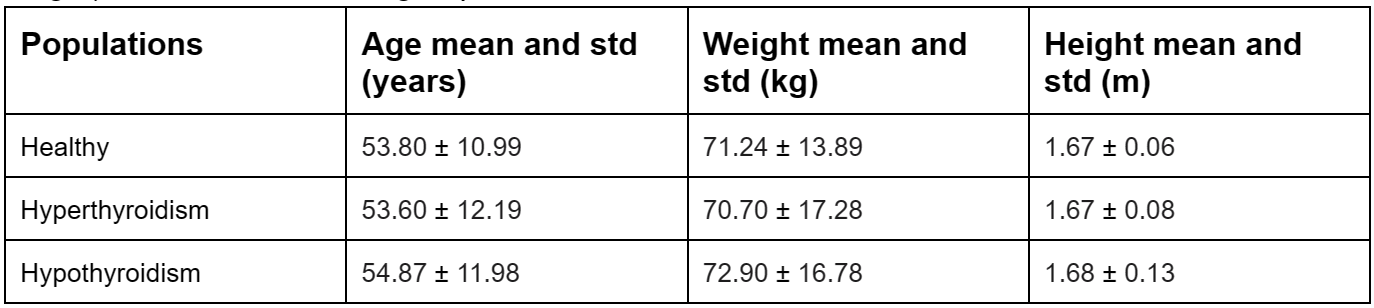
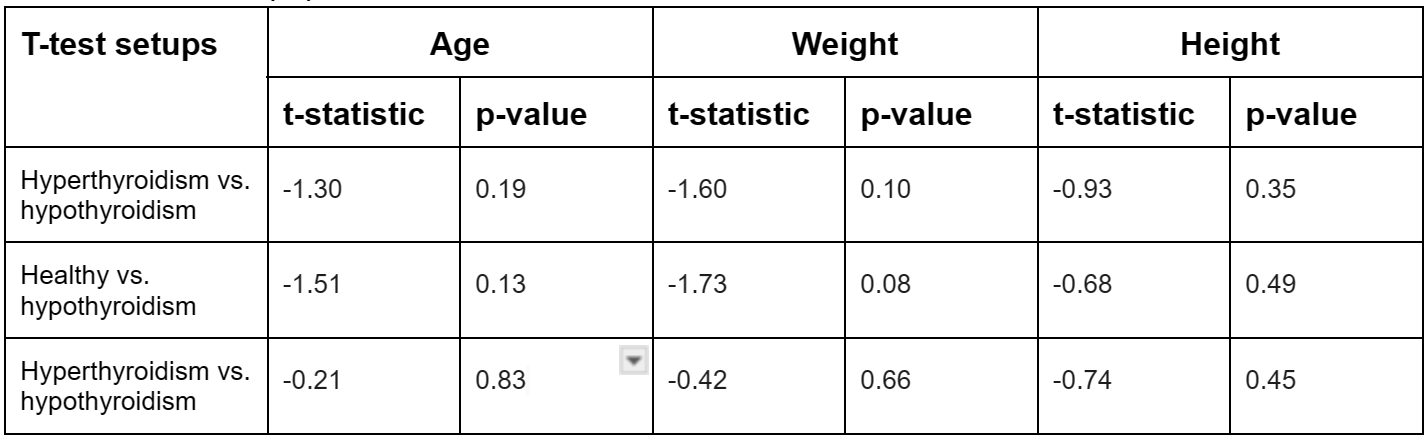
We utilized a deep learning technique for precise thyroid volume extraction via the nnUNet framework. Employing T2-weighted axial MRI scans that encompassed the entire neck region, the study comprised three distinct populations: healthy cohort (n=469), hypothyroid (n=606), and hyperthyroid group (n=203). Whole body MRIs (WB-MRIs) were obtained with 1.5 Tesla Siemens and Philips scanners as part of a preventative health screening program. To ensure robust and equitable comparisons, all demographic parameters, including age, weight, and height, were rigorously matched across the study groups.Table 1 displays the means and standard deviations for age in the three groups: healthy (53.80±10.99 years), hyperthyroid (53.60±12.19 years), and hypothyroid (54.87±11.98 years). Independent t-tests showed non-significant age differences, confirming unbiased patient selection. An analysis of mean weight and height across the groups revealed minimal variations as well. The healthy cohort averaged 71.24±13.89 kg, the hyperthyroidism group 70.70±17.28 kg, and the hypothyroidism group 72.90±16.78 kg respectively. Similarly, mean height displayed slight variances, with the healthy cohort averaging 1.67±0.068 meters, the hyperthyroidism group being 1.67±0.08 meters, and the hypothyroidism group being 1.68±0.13 meters.
Thorough demographic analysis and non-significant t-tests for age, weight, and height comparisons confirm unbiased patient selection for equitable representation in the hyperthyroid, hypothyroid, and healthy cohorts. The demographic information and statistical tests are reported in Table 1 and 2.
RESULTS
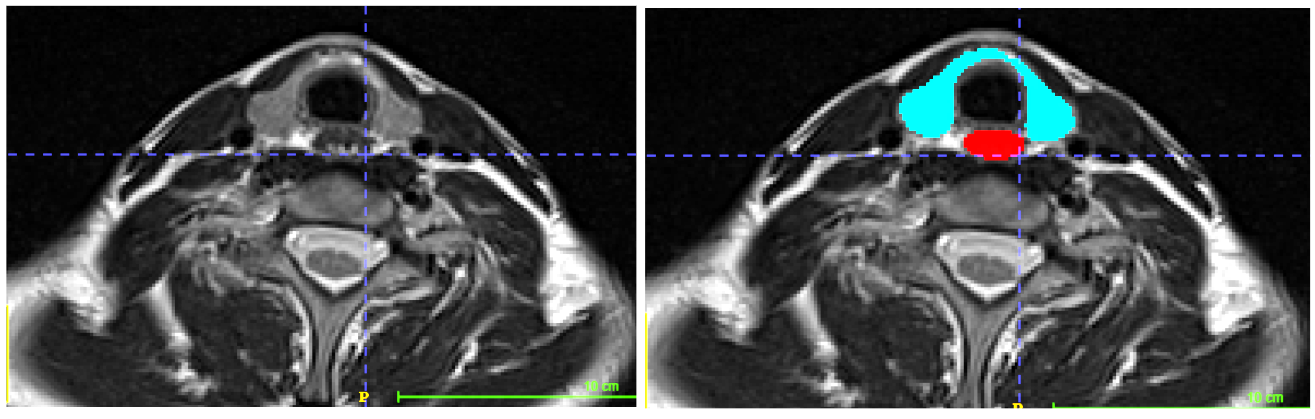
MRI analysis of thyroid volumes in healthy, hyper and hypothyroidism patients revealed key findings. Using deep learning for segmentation, the Dice score reached 82%, affirming segmentation accuracy. Fig. 1 shows an example of thyroid segmentation from a T2 axial MRI image.Furthermore, correlations between thyroid volume and weight demonstrated a positive association of 0.41 (p-value = 3.2e-25), signifying a moderate relationship between them. Additionally, a correlation of 0.17 (p-value = 3.9e-05) between thyroid volume and height was observed, indicating a weaker association. These thyroid volume-body parameter correlations offer insights into these relationships within the studied population.
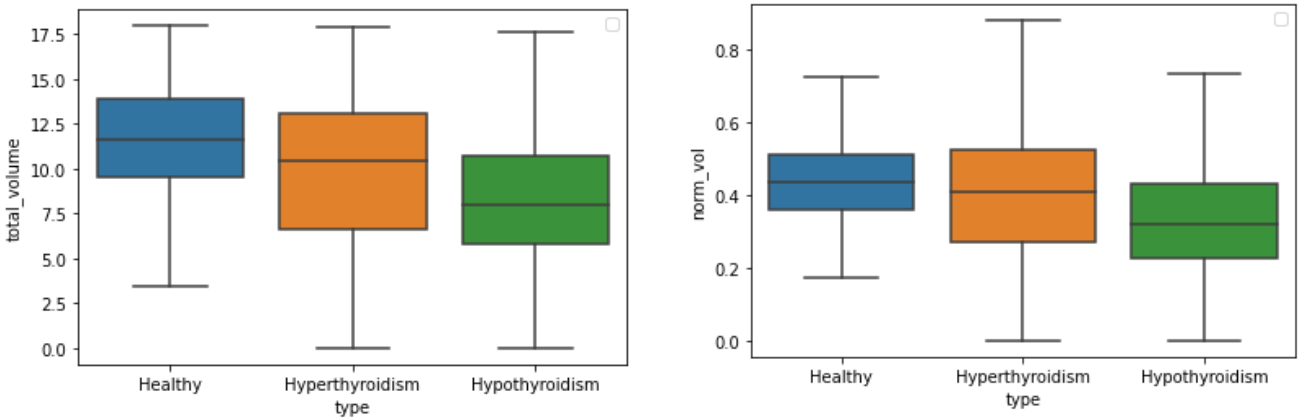
The absolute thyroid volumes across the study groups revealed distinct differences (Fig. 2). The healthy cohort exhibited an average absolute thyroid volume of 11.02±2.92 ml, whereas individuals with hypothyroidism and hyperthyroidism demonstrated volumes of 8.35±3.75 and 9.42±4.57 ml, respectively.
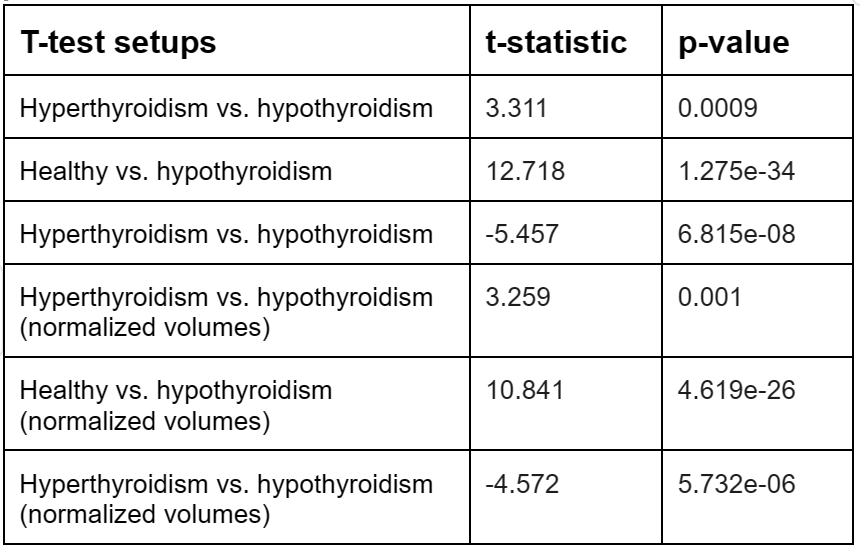
Moreover, as there is a correlation between thyroid volume and BMI, we further assessed BMI-normalized thyroid volumes among the study groups. The healthy cohort displayed a BMI-normalized thyroid volume of 0.44±0.12, while the hypothyroid and hyperthyroid groups exhibited 0.33±0.18 and 0.39±0.19, respectively. All independent t-test statistics and associated p-values for both thyroid volumes and normalized thyroid volumes were found to be significant (all p-values < 0.05), affirming the observed differences among the study groups. Table 3 and 4 presents the findings of the mean and standard deviation of thyroid volumes among three analyzed populations as well as their corresponding t-tests results.
CONCLUSION
The comprehensive MRI-based thyroid volume analysis employing deep learning techniques via nnUNet framework illuminated significant distinctions in thyroid volumes across healthy, hyper and hypothyroidism patients. The study's robust methodology ensured precision and accuracy in extraction, showcasing varied absolute and BMI-normalized thyroid volumes. The correlations with weight and height underscored associations, culminating in a thorough, unbiased analysis.Acknowledgements
We would like to thank the MRI Technologists, Patient Care, and Backend teams for their contributions in patient care and data acquisition.References
[1] Gotway MB, Higgins CB. “MR imaging of the thyroid and parathyroid glands”. Magn Reson Imaging Clin N Am. 2000 Feb;8(1):163-82, ix. PMID: 10730241.
[2] Alfred L. Weber, Gregory Randolph, Fatma Gul Aksoy, “The thyroid and parathyroid glands: CT and MR Imaging and Correlation with Pathology and Clinical Findings”, Radiologic Clinics of North America, Volume 38, Issue 5, 2000, Pages 1105-1129, https://doi.org/10.1016/S0033-8389(05)70224-4.
[3] Tessler FN, Middleton WD, Grant EG, et al. ACR Thyroid Imaging, Reporting and Data System (TI-RADS): White Paper of the ACR TI-RADS Committee. J Am Coll Radiol. 2017;14(5):587-595. doi:10.1016/j.jacr.2017.01.046
[4] Bini F, Pica A, Azzimonti L, Giusti A, Ruinelli L, Marinozzi F, Trimboli P. Artificial Intelligence in Thyroid Field-A Comprehensive Review. Cancers (Basel). 2021 Sep 22;13(19):4740. doi: 10.3390/cancers13194740. PMID: 34638226; PMCID: PMC8507551.
Figures