2100
Deep Learning-Based Automated Kidney and Cortex Segmentation from Non-contrast T1-weighted Images1Gansu University of Chinese Medicine, lanzhou, China, 2Department of Radiology, Gansu Provincial Hospital, lanzhou, China, 3Philips Healthcare, Xi'an, China, 4Philips Healthcare, Bejing, China
Synopsis
Keywords: Analysis/Processing, Machine Learning/Artificial Intelligence
Motivation: In the realm of kidney imaging, the precise measurement of kidney volumes, including total, cortical, and medullary volumes, is of significant clinical importance, but manual segmentation is time-consuming and impractical.
Goal(s): To develop a fully automated deep learning-based segmentation method for segmenting the entire kidney and internal structures in MR images.
Approach: Utilized a 3D nnU-Net deep learning model trained with non-contrast-enhanced T1-weight MR images from 40 volunteers, validated against manual segmentation.
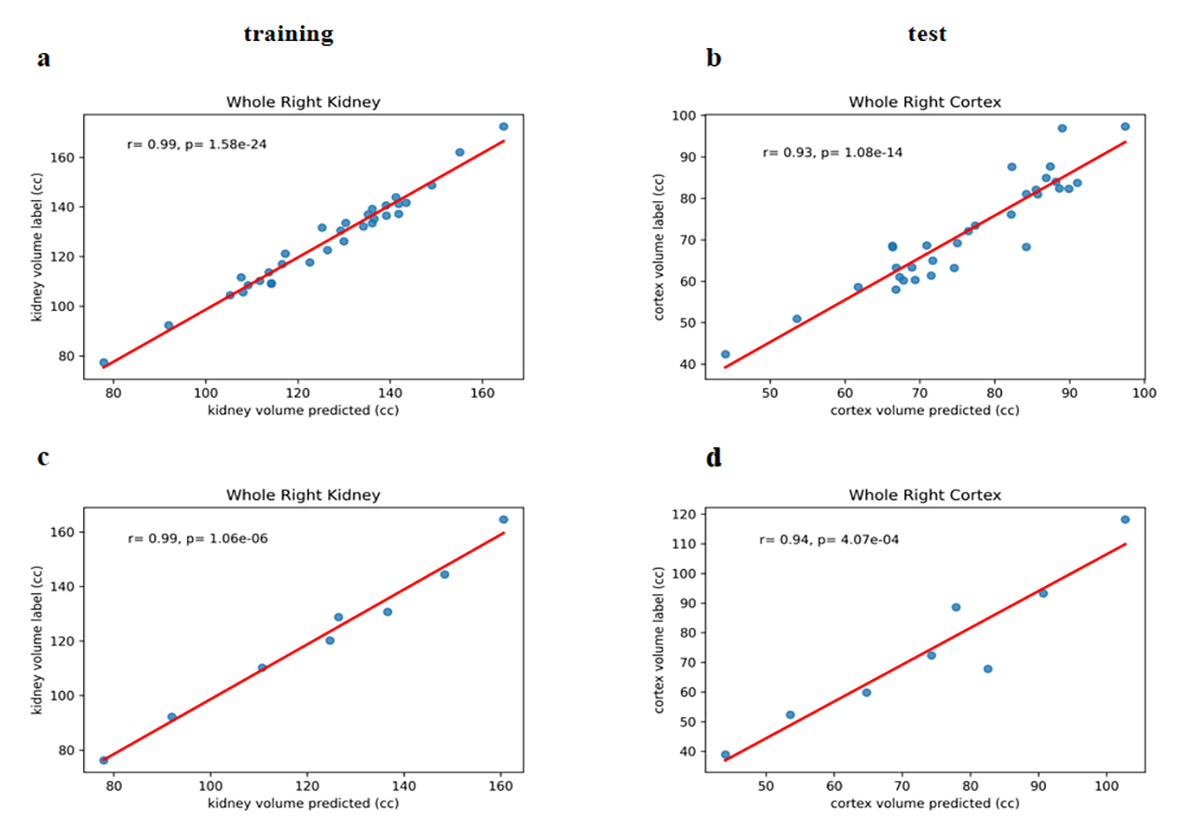
Results: The automated method strongly correlated with manual measurements (Pearson’s > 0.9) and achieved Dice coefficients of 0.96 for the whole kidney and 0.84 for the cortex on the test set.
Impact: This deep learning approach offers rapid, precise, and replicable kidney volume analysis, enhancing both research and clinical care.
Introduction:
In kidney imaging, phenotypic features such as kidney volume have been shown to be useful in many clinical situations[1,2]. A simple estimation for kidney volume can be obtained from renal length measurements using ultrasound imaging. However, this method has limited accuracy and reproducibility in estimating renal volume[3]. Magnetic resonance imaging (MRI) provides spatially highly-resolved anatomical images, and therefore represents a more precise imaging modality for volumetric measurements. Although most studies have focused on total kidney volume[4], a disproportionate decrease in cortical volume relative to medulla is a characteristic finding of both age[5] and chronic kidney disease[6]. It may be more useful to assess kidney cortical volume separately[7]. Image processing tool (ITK-snap) enables segmentation of kidneys and calculation of kidney volume, but this is time consuming and impractical for clinical care. In the field of machine learning, the potential for automatic medical image segmentation in many different organs, including the kidney, has recently been shown. Studies based on CT and MRI images have shown that especially convolutional neural networks can accurately segment the entire kidney, extract its compartments, and even distinguish tumor tissue[8,9]. This study presents a fully automated method to segment kidney and cortex.Methods:
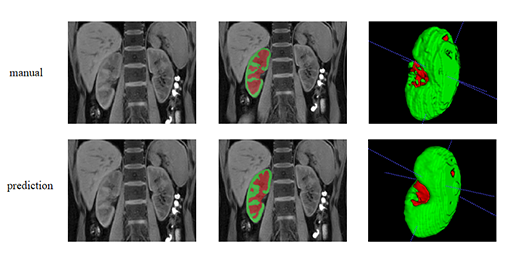
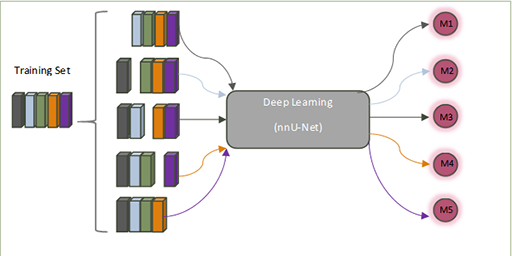
The segmentation of the total entire renal structures and cortical tissue were performed in 40 volunteers based on non-contrast-enhanced T1-weight MR images. Data was collected using a 3.0 MR scanner (Elition, Philips Healthcare, Netherlands) with 32 channel abdomen coils. All the images were segmented by an expert radiologic technologist using ITK-snap (version 3.8). The radiologic was blinded to any clinical information. A sub-region from the coronal plane is manually identified to include right kidney (Figure.1). A summary of the network workflow is shown in Figure 2. A 3D nnU-Net v2.2[10] deep learning model was trained (n=32) with five-fold cross validation, and then evaluated in a hold-out test set(n=8). Dice similarity coefficient was employed to evaluate the automated segmentation performance. Volumetric analyses of the segmentations derived from deep learning and manual techniques were conducted, with Bland-Altman plots assessing the concordance and Pearson’s correlation coefficient assessing the correlation between them. The volume and Pearson’s coefficient were computed using Python version 3.9.5. The Bland-Altman analysis was conducted using MedCalc version 20.019 (MedCalc Software Ltd).Results:
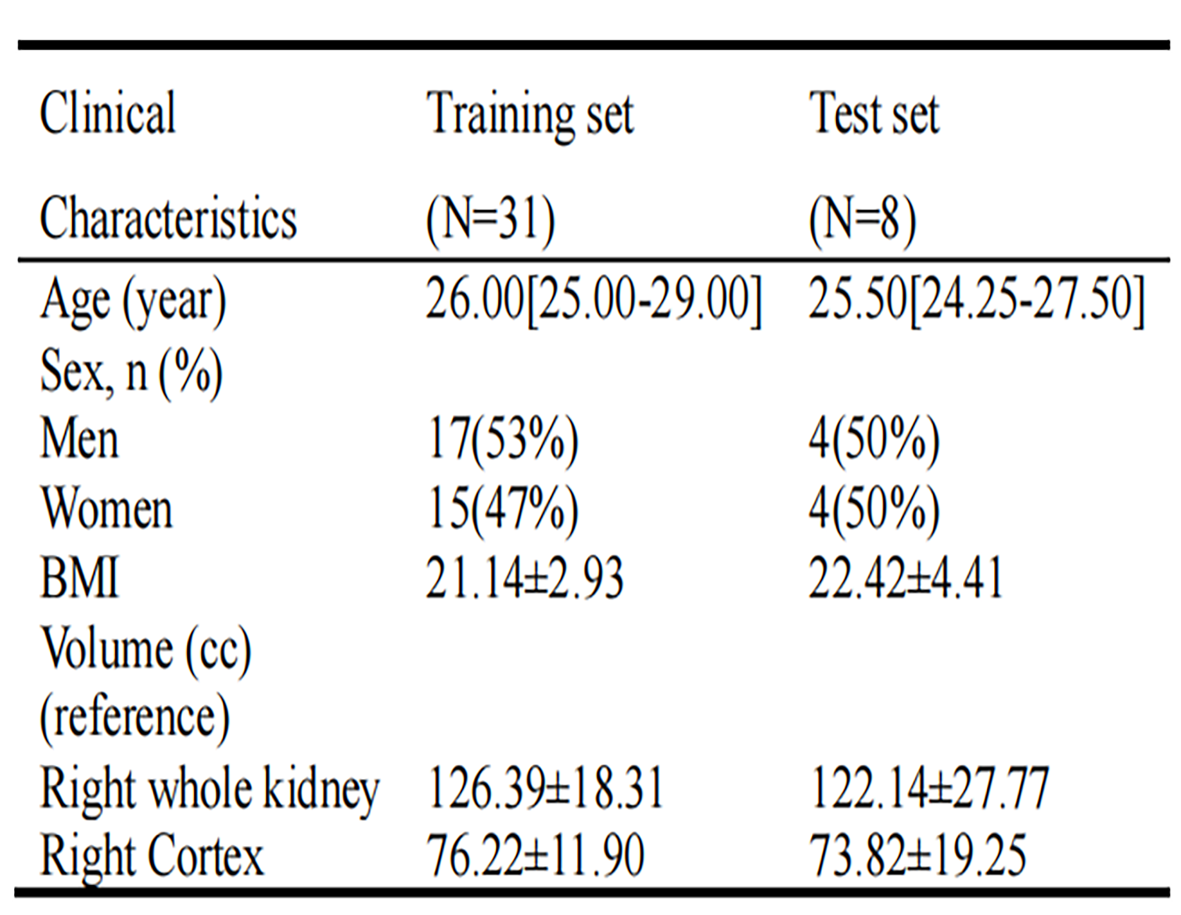
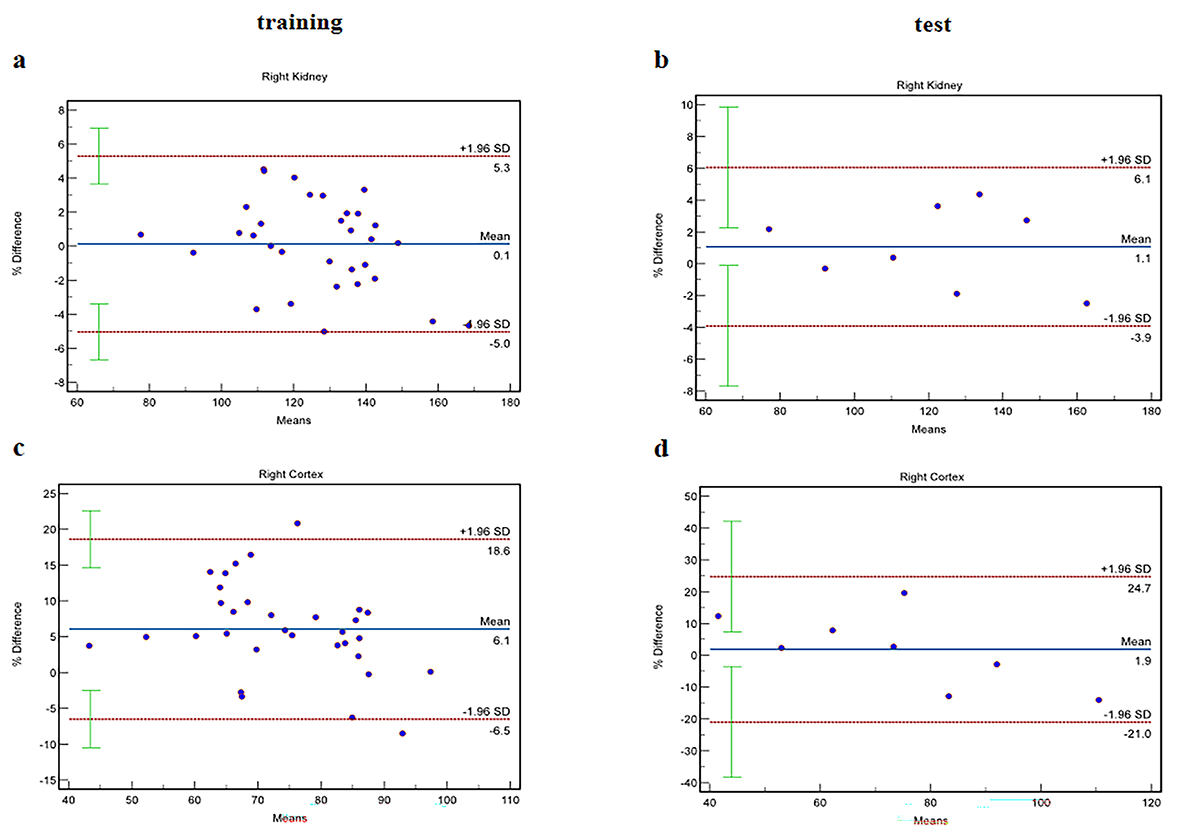
Table 1 summarizes the clinical characteristics of the volunteers studied. The resulting kidney and cortex volumes of automated segmentation correlated well with those obtained by manual segmentation (all Pearson’s correlation coefficients > 0.9 and P < 0.001, for both training and testing set)(Figure.3). Compared with the reference standard, the automated approach achieved a Dice similarity score of 0.96 (right whole kidney),0.84 (right cortex) in the test set, and 0.96 (right whole kidney),0.85 (right cortex) in the training set. Bland–Altman plots, as presented in Figures 4, the percent bias mean ± standard deviation for right whole kidney in training set was 0.1 ±2.64%, for right cortex in training set was 6.1 ±6.40%, for right whole kidney in test set was 1.1 ±2.54%, for right cortex in test set was 1.9 ±11.65%, indicate that the majority of automated measurements reside within a clinically acceptable margin of error.Discussion:
In this article, we introduce an automated renal segmentation method based on deep learning, which enables the full automation of renal structural volume analysis from non-contrast-enhanced T1-weighted MR images. Given the kidney's complex vascular architecture, our findings underscore the importance of automatic segmentation. The predominant distribution of blood flow in the cortical region[11] necessitates the separate assessment of cortical and medullary volumes, which is crucial as it offers a more detailed understanding of individual anatomical variations and pathological changes related to kidney diseases[12]. Because this method does not require unique MR imaging acquisition, there also exists an opportunity to apply this method to large existing datasets across numerous clinical settings. However, deep learning approaches require large amounts of training data, future work will collect more data. All in all, full automated segmentation method can be significantly leveraged to allow fast, accurate, and reproducible segmentation of kidney structures within routine MR imaging.Conclusion:
In conclusion, the automated, deep learning-based method we have developed for measuring renal volumes demonstrates a high degree of reliability when compared to traditional manual segmentation. This method is not only significantly faster than the manual segmentation, but it also may be useful for both research and the clinical practice in order to rapidly quantify kidney internal structures volume.Acknowledgements
Gang Huang is gratefully acknowledged for his professional Guidance. Philips Healthcare are great fully acknowledged for providing practical and technical resources.References
[2]. J. Dias, J. Malheiro, M. Almeida, CT-based renal volume and graft function after living-donor kidney transplantation: Is there a volume threshold to avoid?, International urology and nephrology, 47(5), 851-859. https://doi.org/10.1007/s11255-015-0959-3
[3]. J. Bakker, M. Olree, R. Kaatee, Renal volume measurements: accuracy and repeatability of US compared with that of MR imaging, Radiology, 211(3), 623-628. https://doi.org/10.1148/radiology.211.3.r99jn19623
[4]. A. J. Daniel, C. E. Buchanan, T. Allcock, Automated renal segmentation in healthy and chronic kidney disease subjects using a convolutional neural network, Magn Reson Med, 86(2), 1125-1136. https://doi.org/10.1002/mrm.28768
[5]. X. Wang, T. J. Vrtiska, R. T. Avula, Age, kidney function, and risk factors associate differently with cortical and medullary volumes of the kidney, Kidney international, 85(3), 677-685. https://doi.org/10.1038/ki.2013.359
[6]. S. R. Yamashita, A. C. von Atzingen, W. Iared, Value of renal cortical thickness as a predictor of renal function impairment in chronic renal disease patients, Radiol Bras, 48(1), 12-16. https://doi.org/10.1590/0100-3984.2014.0008
[7]. P. Korfiatis, A. Denic, M. E. Edwards, Automated Segmentation of Kidney Cortex and Medulla in CT Images: A Multisite Evaluation Study, Journal of the American Society of Nephrology : JASN, 33(2), 420-430. https://doi.org/10.1681/asn.2021030404
[8]. X. L. Zhu, H. B. Shen, H. Sun, L. X. Duan & Y. Y. Xu, Improving segmentation and classification of renal tumors in small sample 3D CT images using transfer learning with convolutional neural networks, International journal of computer assisted radiology and surgery, 17(7), 1303-1311. https://doi.org/10.1007/s11548-022-02587-2
[9]. Z. Sun, Y. Cui, X. Liu, Quantitative evaluation of chronically obstructed kidneys from noncontrast computed tomography based on deep learning, European journal of radiology, 136, 109535. https://doi.org/10.1016/j.ejrad.2021.109535
[10]. F. Isensee, P. F. Jaeger, S. A. A. Kohl, J. Petersen & K. H. Maier-Hein, nnU-Net: a self-configuring method for deep learning-based biomedical image segmentation, Nat Methods, 18(2), 203-211. https://doi.org/10.1038/s41592-020-01008-z
[11]. T. L. Pallone, A. Edwards & D. L. Mattson, Renal medullary circulation, Comprehensive Physiology, 2(1), 97-140. https://doi.org/10.1002/cphy.c100036
[12]. M. S. Hommos, R. J. Glassock & A. D. Rule, Structural and Functional Changes in Human Kidneys with Healthy Aging, Journal of the American Society of Nephrology : JASN, 28(10), 2838-2844. https://doi.org/10.1681/asn.2017040421
Figures