2097
Lesion Instance Segmentation in Multiple Sclerosis: Assessing the Efficacy of Statistical Lesion Splitting1ICTeam, UCLouvain, Louvain-la-Neuve, Belgium, 2Louvain Neuroinflammation Imaging Lab (NIL), UCLouvain, Brussels, Belgium, 3Center for Biomedical Imaging (CIBM), University of Lausanne, Lausanne, Switzerland, 4Medical Image Analysis Laboratory, Radiology Department, University of Lausanne, Lausanne, Switzerland, 5Department of Neurology, Saint-Luc University Hospital, Brussels, Belgium, 6Medical Image Analysis Laboratory, Radiology Department, Lausanne University Hospital, Lausanne, Switzerland
Synopsis
Keywords: Analysis/Processing, Segmentation, Instance Segmentation
Motivation: Accurate white matter lesion (WML) counting and delineation are crucial for multiple sclerosis (MS) diagnosis and prognosis. Though being a critical step in clinical research and automated tools relying on lesion-centered patches, no previous work studied post-processing methods to transform voxel-wise segmentations into lesion instance masks in MS.
Goal(s): In this study, we compare the conventional connected components (CC) method to a confluent lesion splitting (CLS) method that was used but never validated.
Approach: CC and CLS's performances are evaluated using three common lesion segmentation tools (LSTs): SPM, SAMSEG, and nnU-Net.
Results: CLS lacks generalization, sacrifices specificity for sensitivity and worsens segmentation quality.
Impact: Our results underscore the need for the development of a novel instance segmentation methodology that accounts for (i) the potential large distance between voxels and the center of the lesions to which they belong and (ii) confluent lesions.
Introduction
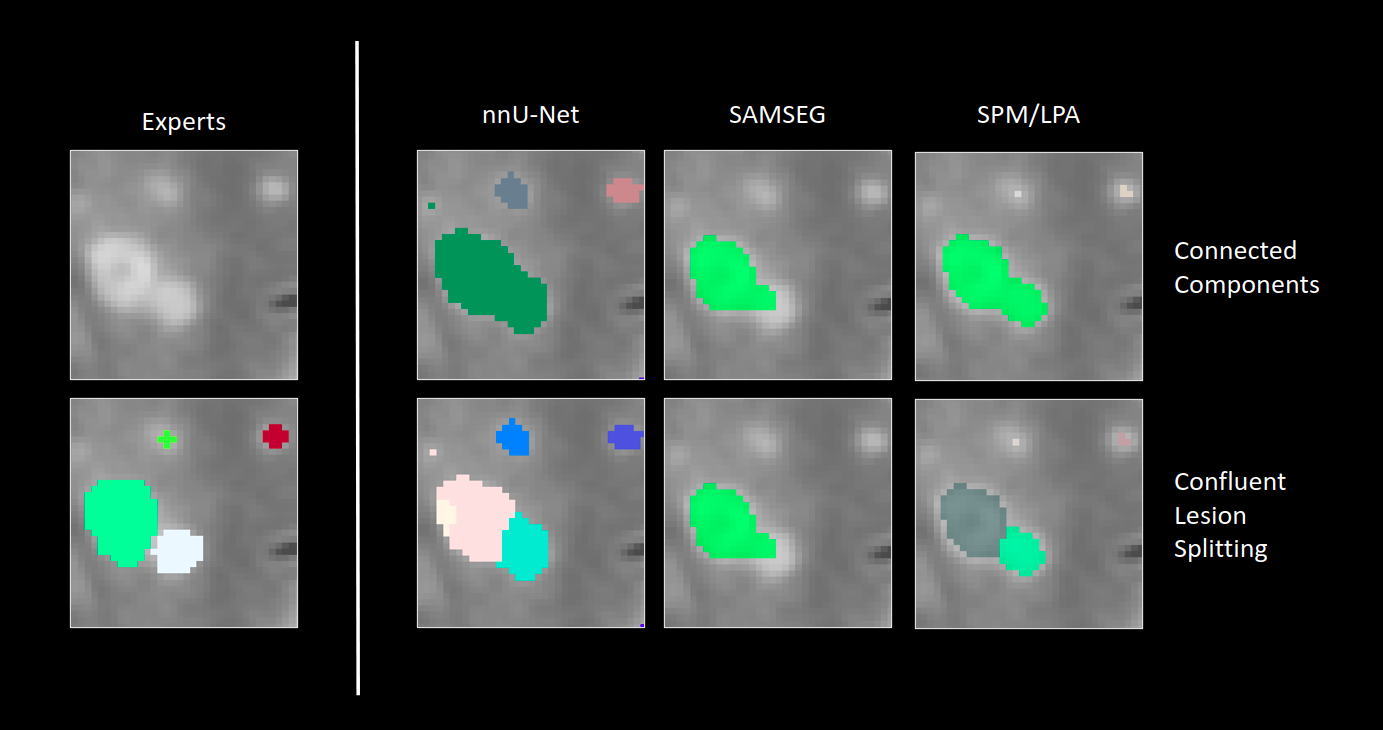
Accurate lesion counting and precise identification of white matter lesions (WMLs) are pivotal for multiple sclerosis (MS) diagnosis1 and prognosis2. Additionally, a precise delineation of lesion instances can both benefit clinical researchers studying lesion-level radiomic features3 and automated methods that rely on patches centered around lesions4. In computer vision, this process of delineating and categorizing individual object instances, within an image is called instance segmentation. Typically, a connected components analysis (CC) is employed to create instance segmentation masks from voxel-wise binary segmentation output5 (Figure 1). However, this method faces difficulties when lesions are confluent, i.e. when multiple distinct lesions' segmentations merge into a single entity6 due to pathological reasons or imprecise segmentation. The presence of these confluent lesions and the tedious nature of their manual splitting underscores the necessity for a specific method for lesion instance segmentation. To automate this process, Lou et al.7 have introduced a method that builds upon the work of Dworkin12 and colleagues, who proposed a statistical algorithm for lesion center detection using the lesion probability map. However, this approach, we hereafter refer to as CLS (Confluent Lesion Splitting), has not undergone a dedicated analysis, as its use has been confined to one specific lesion segmentation tool (LST) and only one validation dataset. The goal of our study is to benchmark lesion instance segmentation by comparing the CLS method combined with three common LSTs with the traditional CC method on an out-of-domain dataset.Materials and methods
We conducted our study with a cohort of 63 patients within an age range of 22 to 66. All participants underwent MRI scans using a 3T Signa Premier General Electrics MRI scanner at Saint-Luc University Hospital in Brussels, Belgium. Instance lesion segmentations were performed by two experts (A.S & P.M.) upon consensus, using 3D-FLAIR images. Three LSTs were employed, all generating voxel-wise probability lesion maps: a generative model (SAMSEG8), a logistic regression model (SPM9), and a pre-trained11 deep neural network (nnU-Net10). For each output lesion probability map, we employed two different approaches to produce instance segmentation masks. The first applied a threshold to generate a binary segmentation mask, followed by the use of CC. The second approach, CLS, was proposed by Lou et. al.7 and had a first step of lesion center identification12, and a second where lesion voxels are associated to their closest center. This resulted in a total of six different instance segmentation masks for each subject, equating to two for each LST. We then compared these segmentation maps to the reference annotation, assessing both the instance and class segmentation performances using metrics recommended by 5. For the instance segmentation, these metrics were Panoptic Quality (PQ) - a measure of the tradeoff between segmentation and recognition quality, detection Sensitivity, Specificity and F1, and finally the Dice score averaged over all correctly detected lesions (Dice/TP). Additionally, we also computed the Dice Score (DSC). Our analysis examined the effect of CLS for each LST. As an upper bound, we also applied CC on the binarized reference annotations. Finally, we conducted paired t-tests to assess the statistical significance of the observed performance differences between the CC and CLS methods.Results
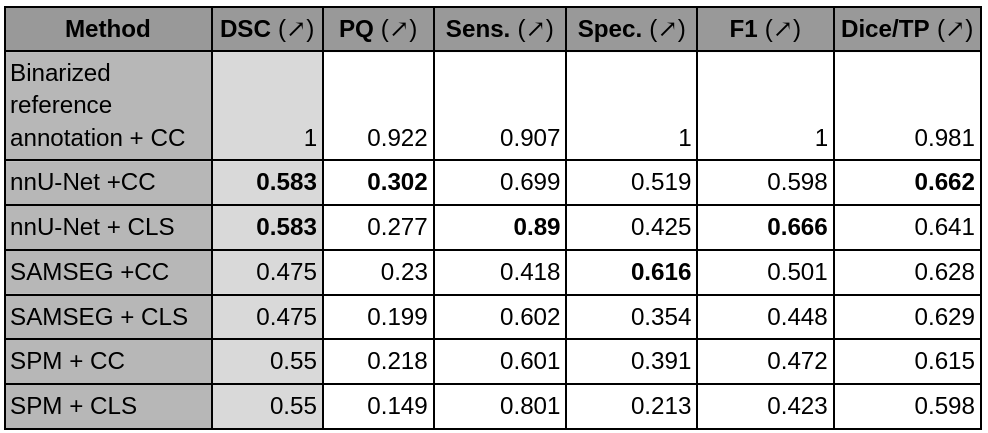
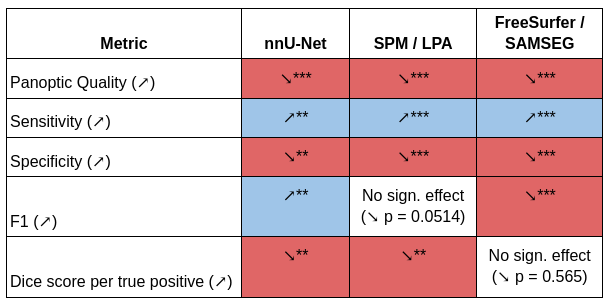
Figure 1 displays prediction examples for all analyzed methods. Firstly, nnU-Net exhibited superior performance than SPM and SAMSEG in all metrics except the specificity (Table 1) when using CC. Secondly, CLS had a significant negative impact on several performance metrics across all LSTs, including PQ, Specificity and Dice/TP, while positively affecting the sensitivity as shown in Table 2. Interestingly, the effect of CLS on the F1 score varied across LSTs, leading to a significant improvement in nnU-Net, a significant decline in SAMSEG, and no significant change in SPM. nnU-Net also out-performed SPM and SAMSEG in class segmentation (Table 1).Discussion
Our findings demonstrate that the CLS algorithm lacks generalizability, and tends to trade specificity for sensitivity at the expense of segmentation quality. This observed decrease in segmentation performance can be attributed to the inherent limitations of the nearest-neighbor strategy employed in voxel assignment, particularly when the voxels in question belong to lesions with centers located at larger distances. This phenomenon is particularly pronounced in the case of larger lesions, which have a higher probability to be confluent. Consequently, these results underscore the need for the development of a novel instance segmentation methodology that accounts for the potential large distance between voxels and the center of the lesions to which they belong. Finally, we note that nnU-Net outperforms other LSTs on our out-of-domain dataset in both class and instance segmentation tasks, and regardless of the employed postprocessing method (CC/CLS).Acknowledgements
M.W. is supported by TRAIL and the Walloon region.References
1. Thompson, A. J. et al. Diagnosis of multiple sclerosis: 2017 revisions of the McDonald criteria. Lancet Neurol. 17, 162–173 (2018).
2. Popescu, V. et al. Brain atrophy and lesion load predict long term disability in multiple sclerosis. J. Neurol. Neurosurg. Psychiatry 84, 1082–1091 (2013).
3. Stölting, A. et al. The Clinical Significance of Heterogeneous Paramagnetic Rim Lesions. in (2023).
4. La Rosa, F. et al. Cortical lesions, central vein sign, and paramagnetic rim lesions in multiple sclerosis: emerging machine learning techniques and future avenues. ArXiv220107463 Cs Eess (2022).
5. Maier-Hein, L. et al. Metrics reloaded: Recommendations for image analysis validation. Preprint at https://doi.org/10.48550/arXiv.2206.01653 (2023).
6. Barquero, G. et al. RimNet: A deep 3D multimodal MRI architecture for paramagnetic rim lesion assessment in multiple sclerosis. NeuroImage Clin. 28, 102412 (2020).
7. Lou, C. et al. Fully Automated Detection of Paramagnetic Rims in Multiple Sclerosis Lesions on 3T Susceptibility-Based MR Imaging. NeuroImage Clin. 102796 (2021) doi:10.1016/j.nicl.2021.102796.
8. Cerri, S. et al. A Contrast-Adaptive Method for Simultaneous Whole-Brain and Lesion Segmentation in Multiple Sclerosis. NeuroImage 225, 117471 (2021).
9. Schmidt, P. Bayesian inference for structured additive regression models for large-scale problems with applications to medical imaging. (Ludwig-Maximilians-Universität München, 2017). doi:10.5282/EDOC.20373.
10. Isensee, F., Jaeger, P. F., Kohl, S. A. A., Petersen, J. & Maier-Hein, K. H. nnU-Net: a self-configuring method for deep learning-based biomedical image segmentation. Nat. Methods 18, 203–211 (2021).
11. La Rosa, F. & Et, al. A deep learning-based pipeline for longitudinal white matter lesion segmentation using diverse FLAIR images. in (2023).
12. Dworkin, J. D. et al. An Automated Statistical Technique for Counting Distinct Multiple Sclerosis Lesions. Am. J. Neuroradiol. 39, 626–633 (2018).
Figures