2089
3D-QALAS in COVID: a whole brain voxel-based investigation of relaxometry1Department of Radiology and Magnetic Resonance, Vrije Universiteit Brussel (VUB), Universitair Ziekenhuis Brussel (UZ Brussel), Brussels, Belgium, 2Department of Imaging and Pathology, Translational MRI group, KU Leuven, Leuven, Belgium, 3Department of Radiology, UZ Leuven, Leuven, Belgium
Synopsis
Keywords: Infectious Disease, COVID-19, Synthetic MR, Quantitative Imaging, Data Analysis, Voxel-wise Analysis, Voxel-based Analysis
Motivation: The effect of COVID-19 on the brain is not fully understood. Simultaneous 3D-acquisition of relaxometry parameters can indicate where microstructure has changed.
Goal(s): To locate differences in T1, T2 and proton density in COVID-19 patients.
Approach: 3D-QALAS was performed on 17 volunteers and 17 patients. Relaxometry and segmentation maps were calculated and warped to a common space to compare both groups.
Results: T2 changes associated with COVID-19 were observed in left cerebellar white and grey matter and in WM of the brain stem and thalamus, along with increased right temporal and occipital T1 and PD, and decreased frontal T1, T2 and PD values.
Impact: A voxel-based relaxometry analysis using 3D-QALAS data,
including WM and PD, was performed for the first time, based on the hMRI
toolbox. Different patterns of parameter changes were observed in several brain
regions, possibly indicating different types of microstructural changes.
Introduction
While COVID-19 mainly affects the respiratory system, about one-fifth of the people affected suffer from various long-term effects on the central nervous system 1, indicating several regions in the brain are affected. The brain’s microstructure can be investigated using relaxometry, and T1, T2 and proton density (PD) maps can now be acquired simultaneously, e.g. using the 3D-QALAS acquisition 2. This allows for segmentation based on the tissue’s relaxometry parameters 3.In this research we investigate the differences in relaxometric values between COVID-19 patients and healthy individuals using both a voxel-wise T1/T2/PD estimation and tissue segmentation, and a voxel-wise analysis, to locate where in the brain microstructural changes took place.
Methods
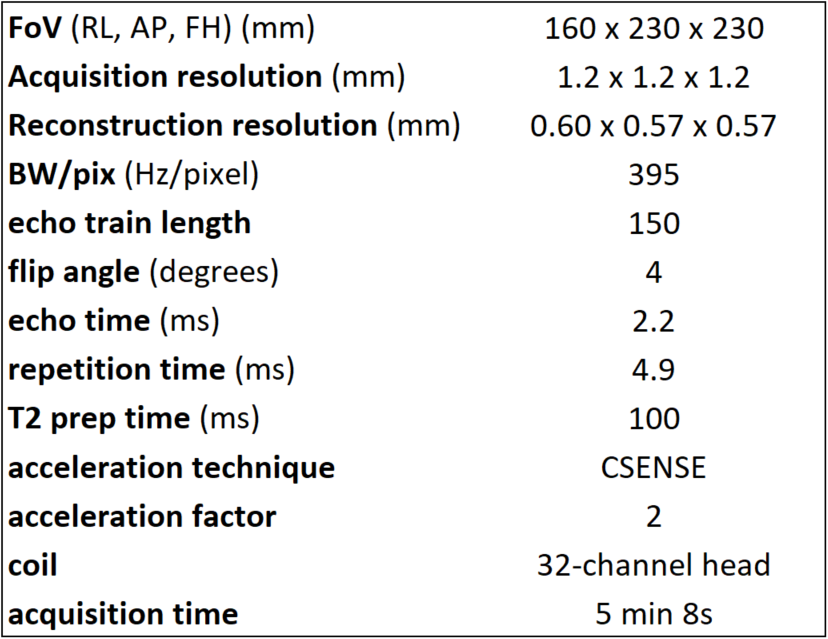
The cohort consisted of 17 patients (4 female, age = 55.9±9.36 years, range 36-76 years) who had been hospitalised due to a COVID-19 infection, scanned upon hospital discharge, and an age and sex-matched healthy control (HC) group consisting of 17 volunteers (5 female, age = 52.4±11.13 years, range 30-71 years). Approval by the Medical Ethics Committee of the UZ Brussel was obtained and all participants signed informed consent. Further information about recruitment and other tests can be found in 4,5.Among other scans, 3D-QALAS data was acquired on a 3T Ingenia scanner (Philips, The Netherlands), using the parameters listed in table 1. T1, T2 and PD maps were calculated using a prototype version of SyMRI (version 0.45.38) (SyntheticMR AB, Sweden), and white matter (WM), grey matter (GM) and cerebrospinal fluid segmentation was derived from these maps 3. A population based tissue template (1.5mm isotropic voxels) using all the subjects was made in SPM12 6 using the hMRI toolbox 7 and DARTEL 8, modified to use SyMRI tissue segments as input. Tissue-weighted smoothed parameter maps using a 6mm FWHM Gaussian kernel were created, as described by Draganski et al. 9.
Voxel-wise differences of these tissue-specific parametric maps between the patient and control group were investigated using a mass univariate approach, using age as a covariate. In the comparisons, a peak-level uncorrected p-value of 0.001 and a cluster-level FWE-corrected value of p<0.05 were used. The location of significant clusters was further determined using the Harvard-Oxford atlas 10, the MNI structural atlas 11, and the Fun With Tracts (FWT) tract atlas 12.
Results
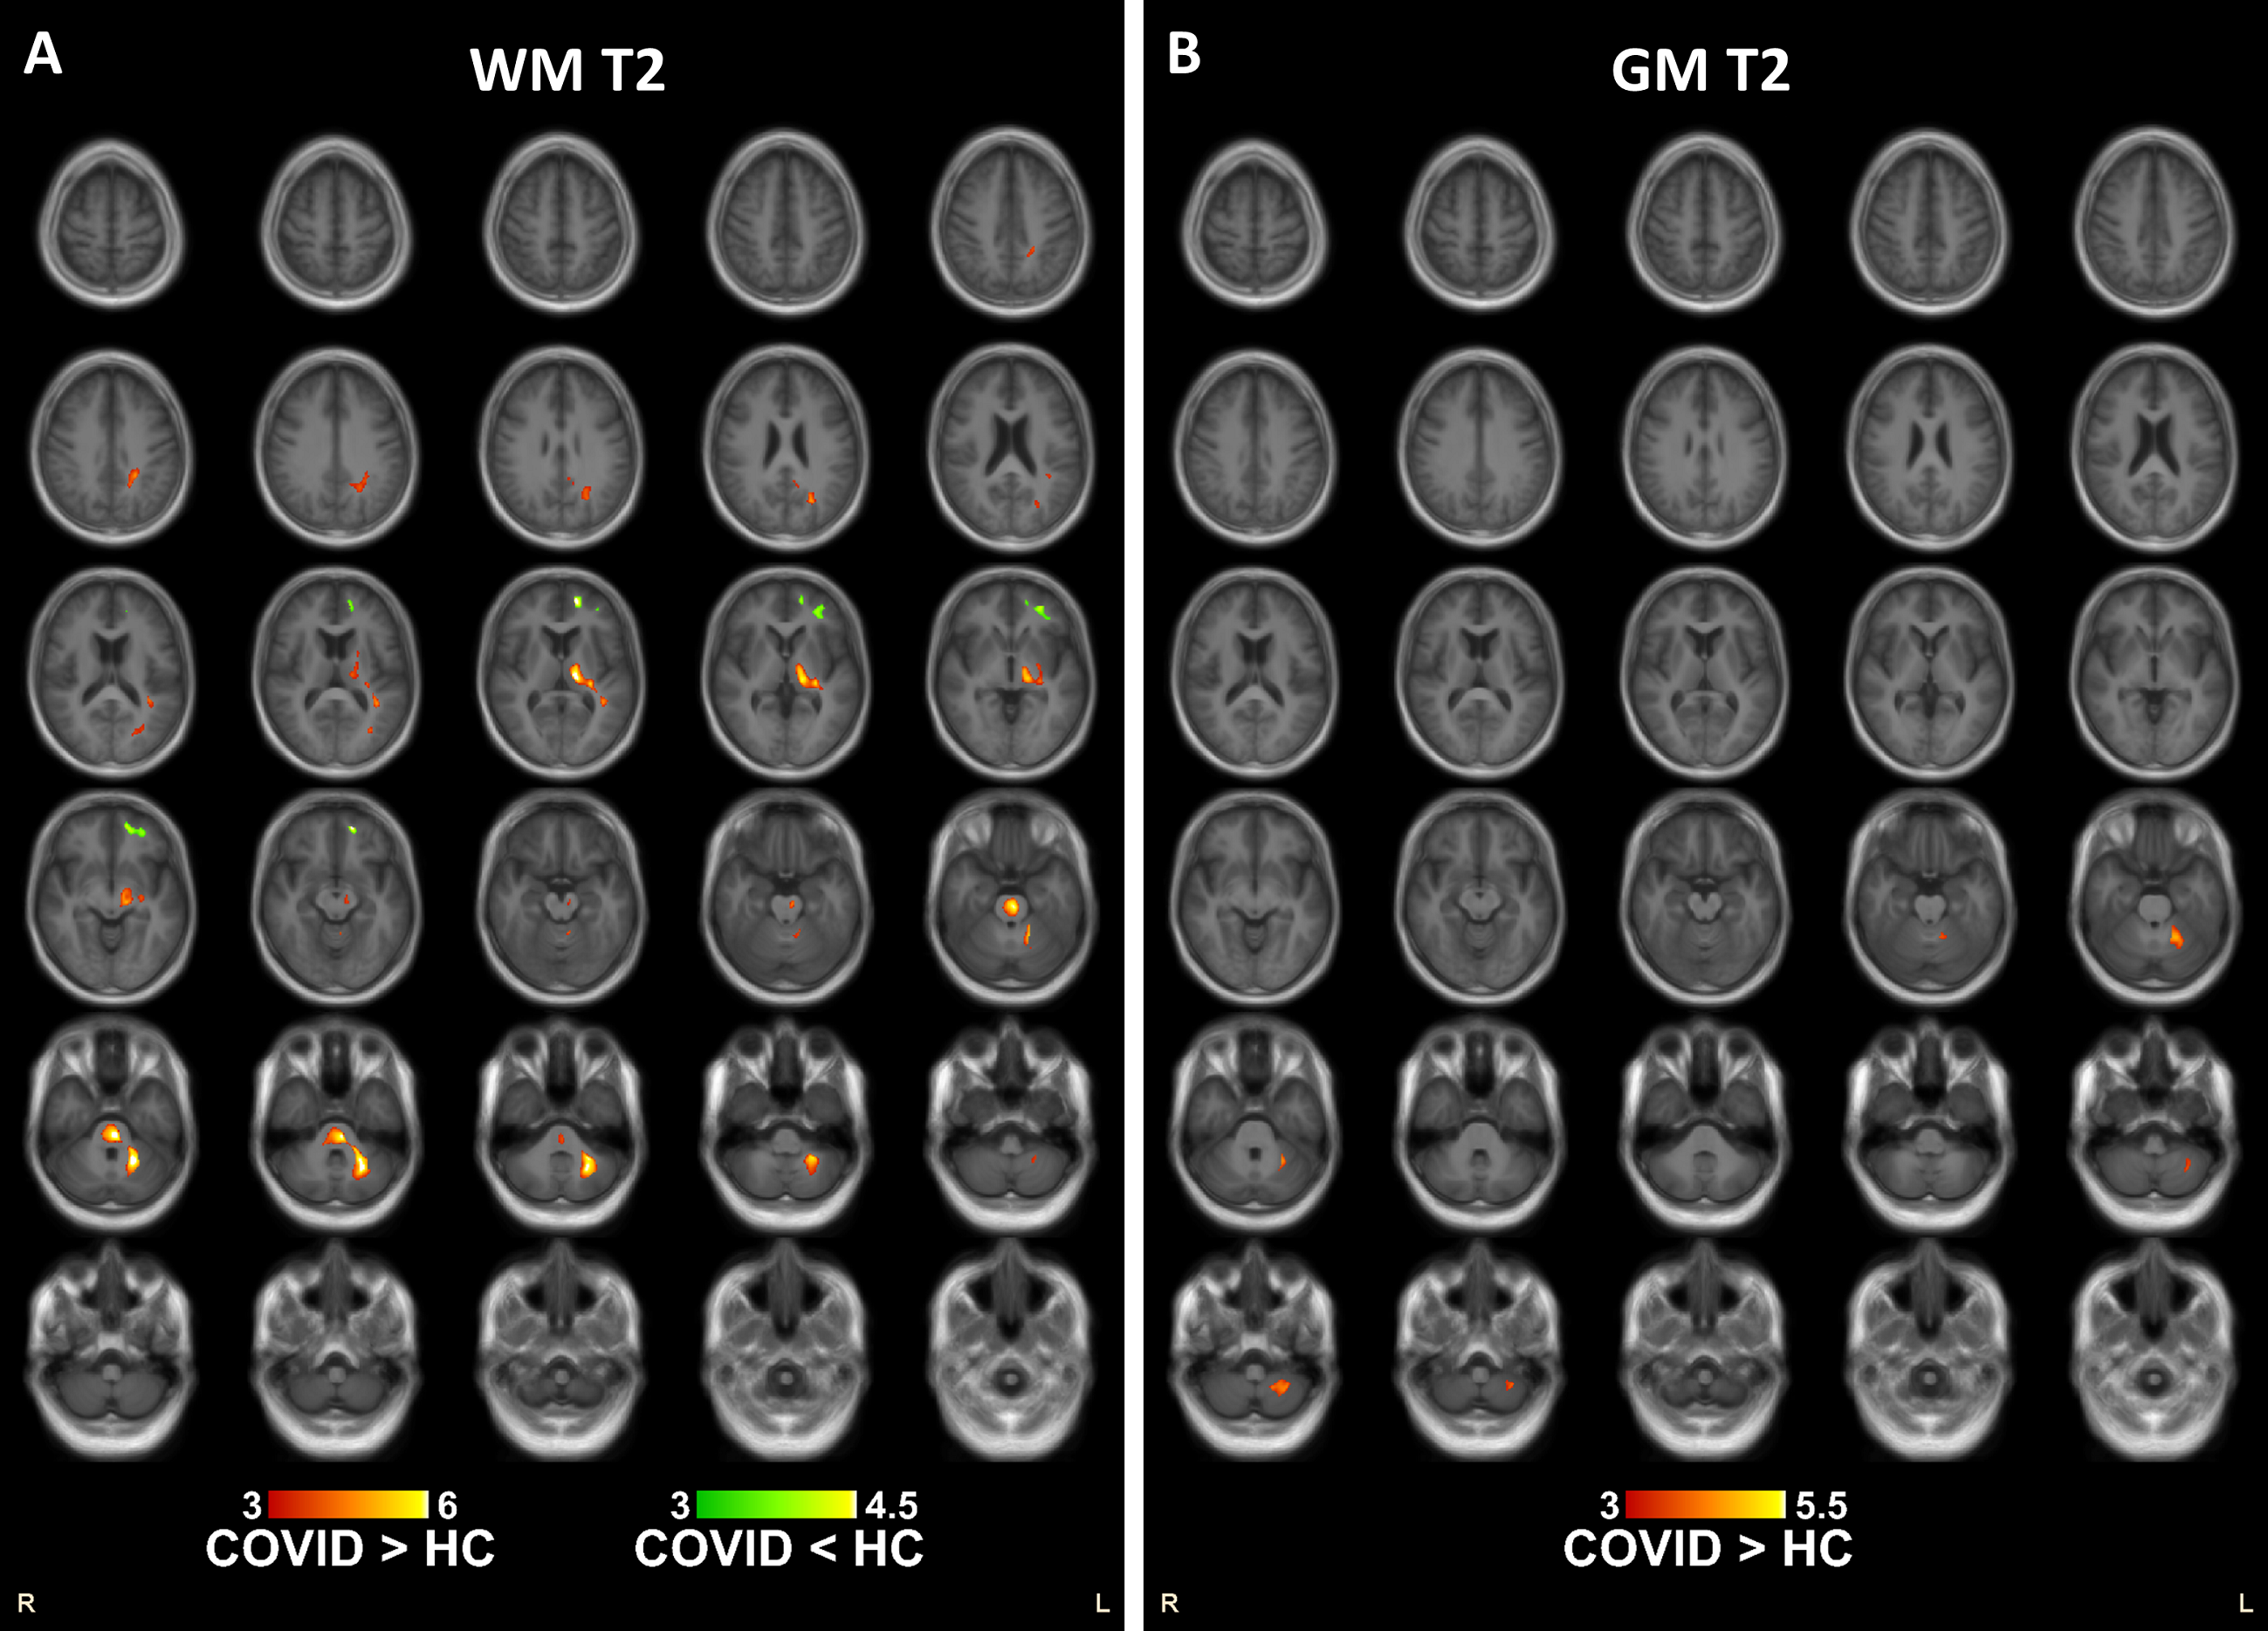
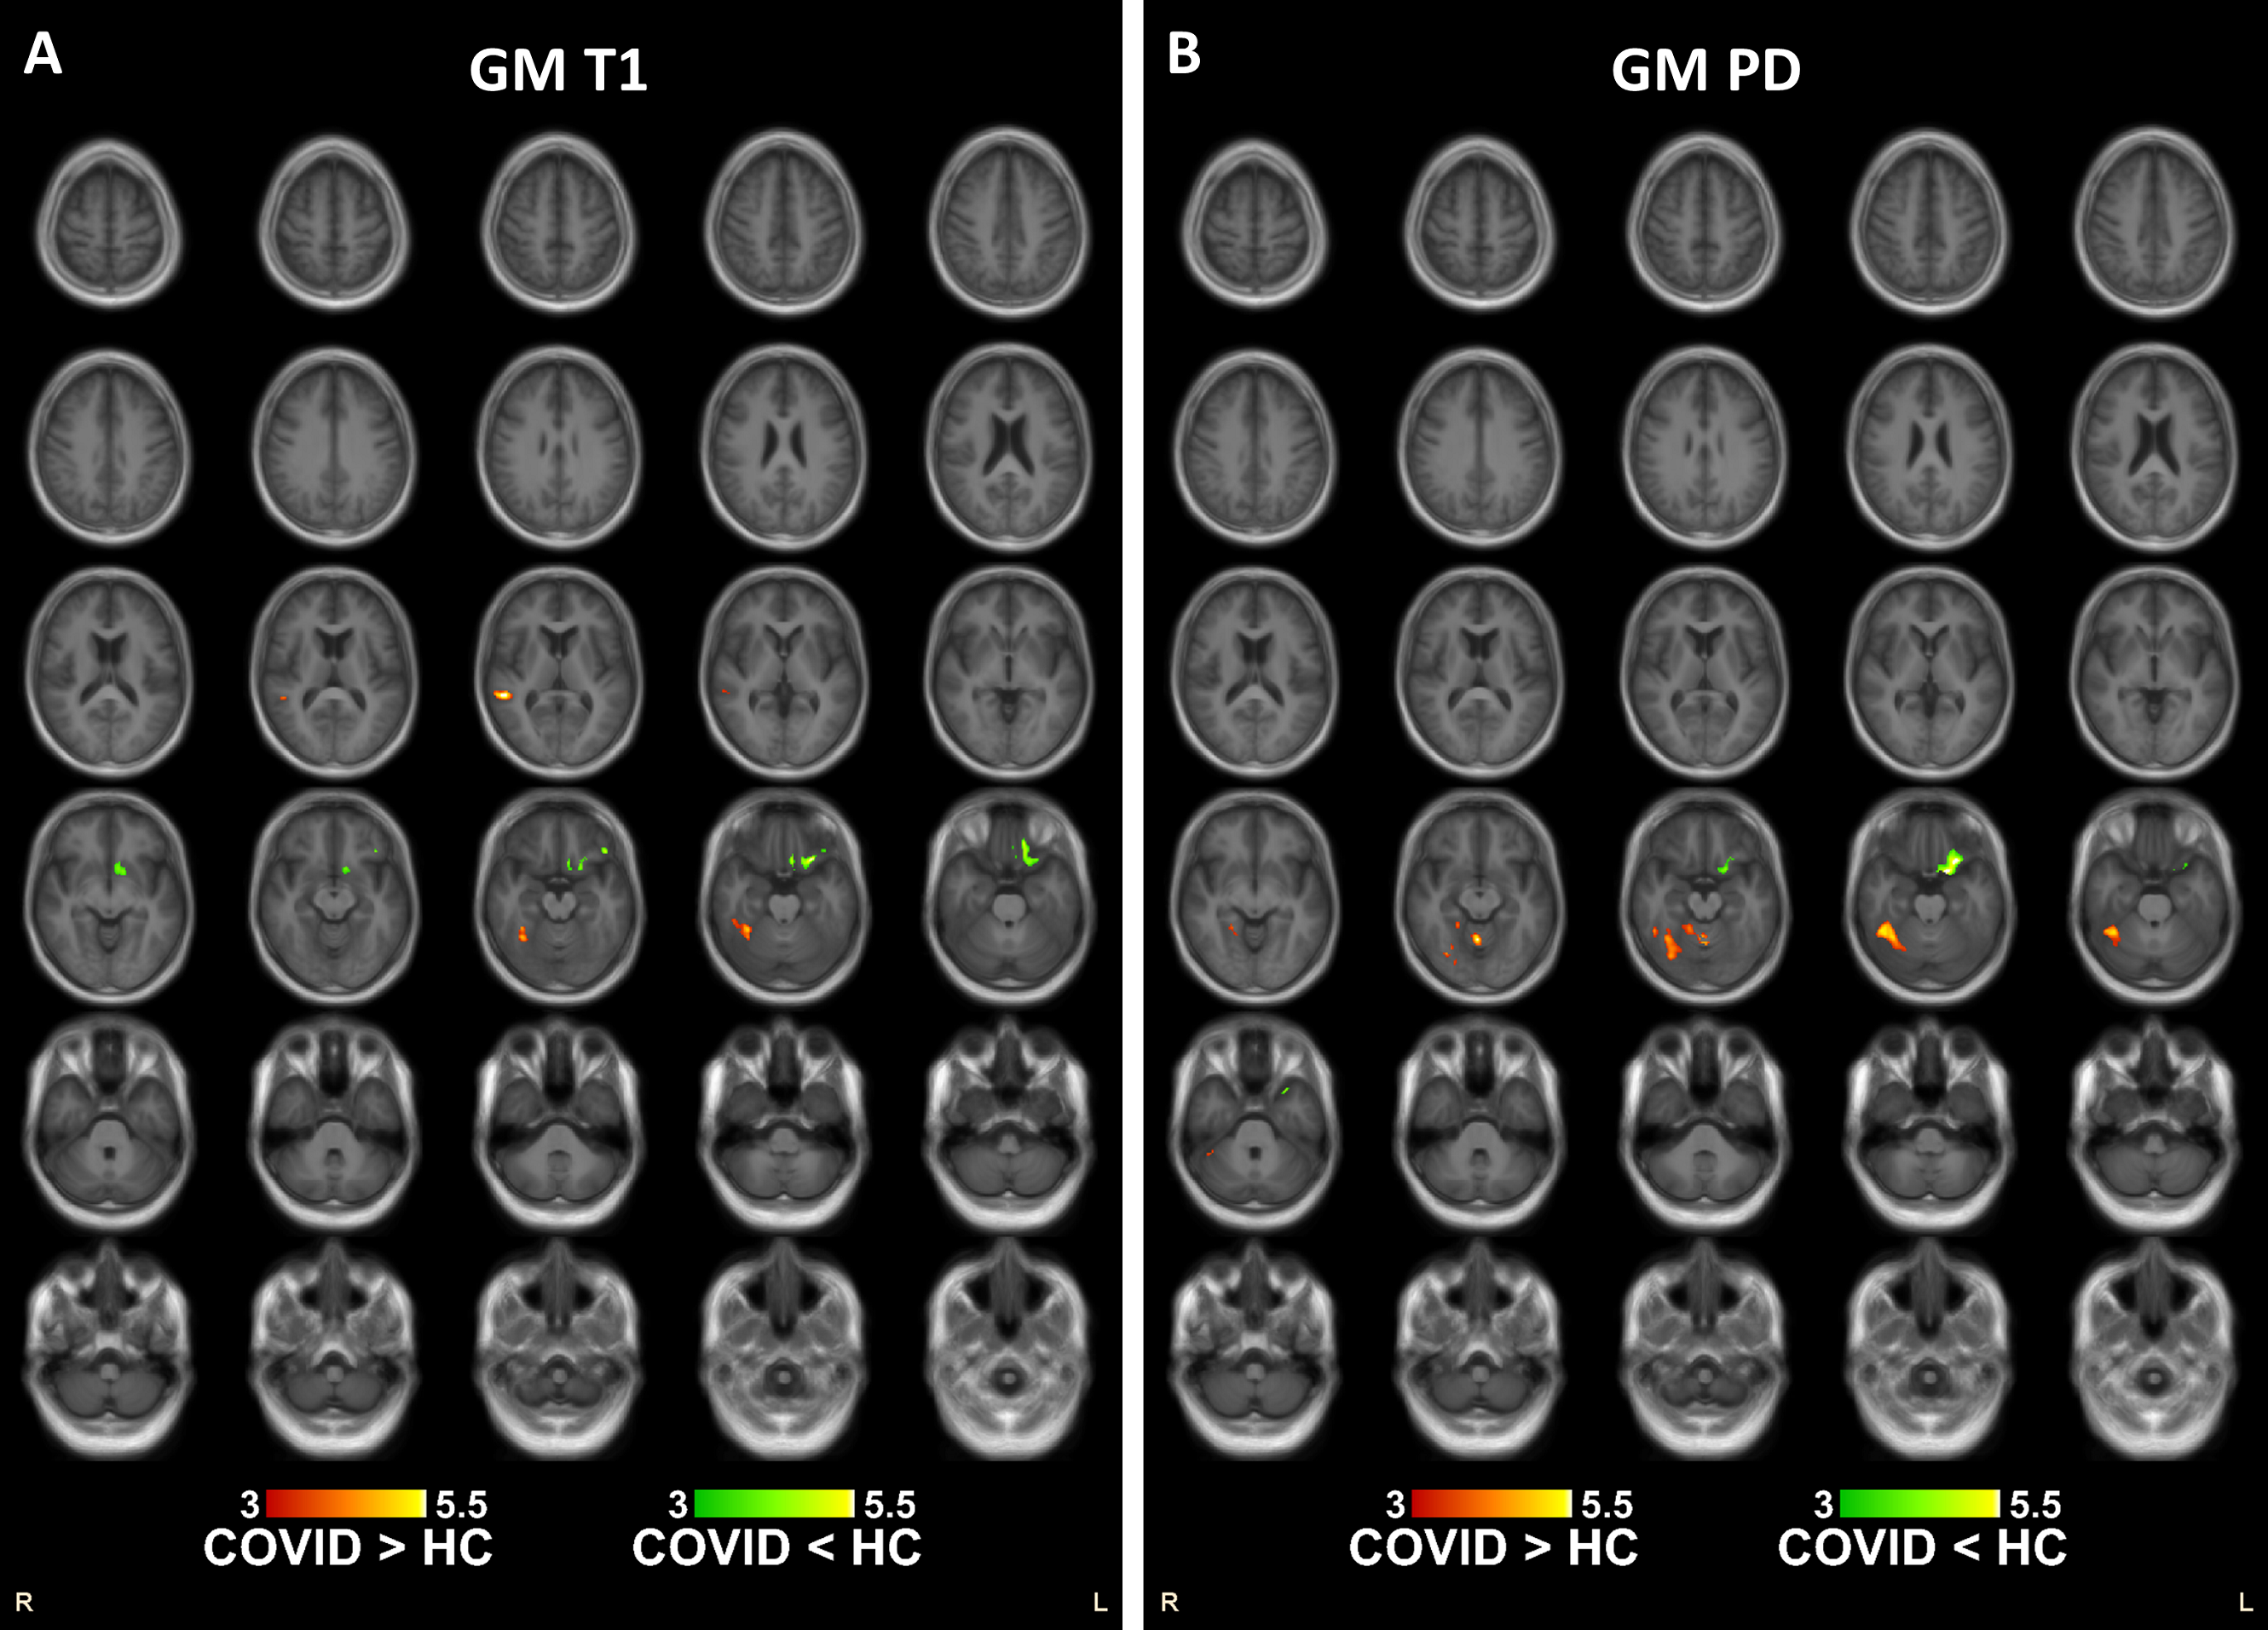
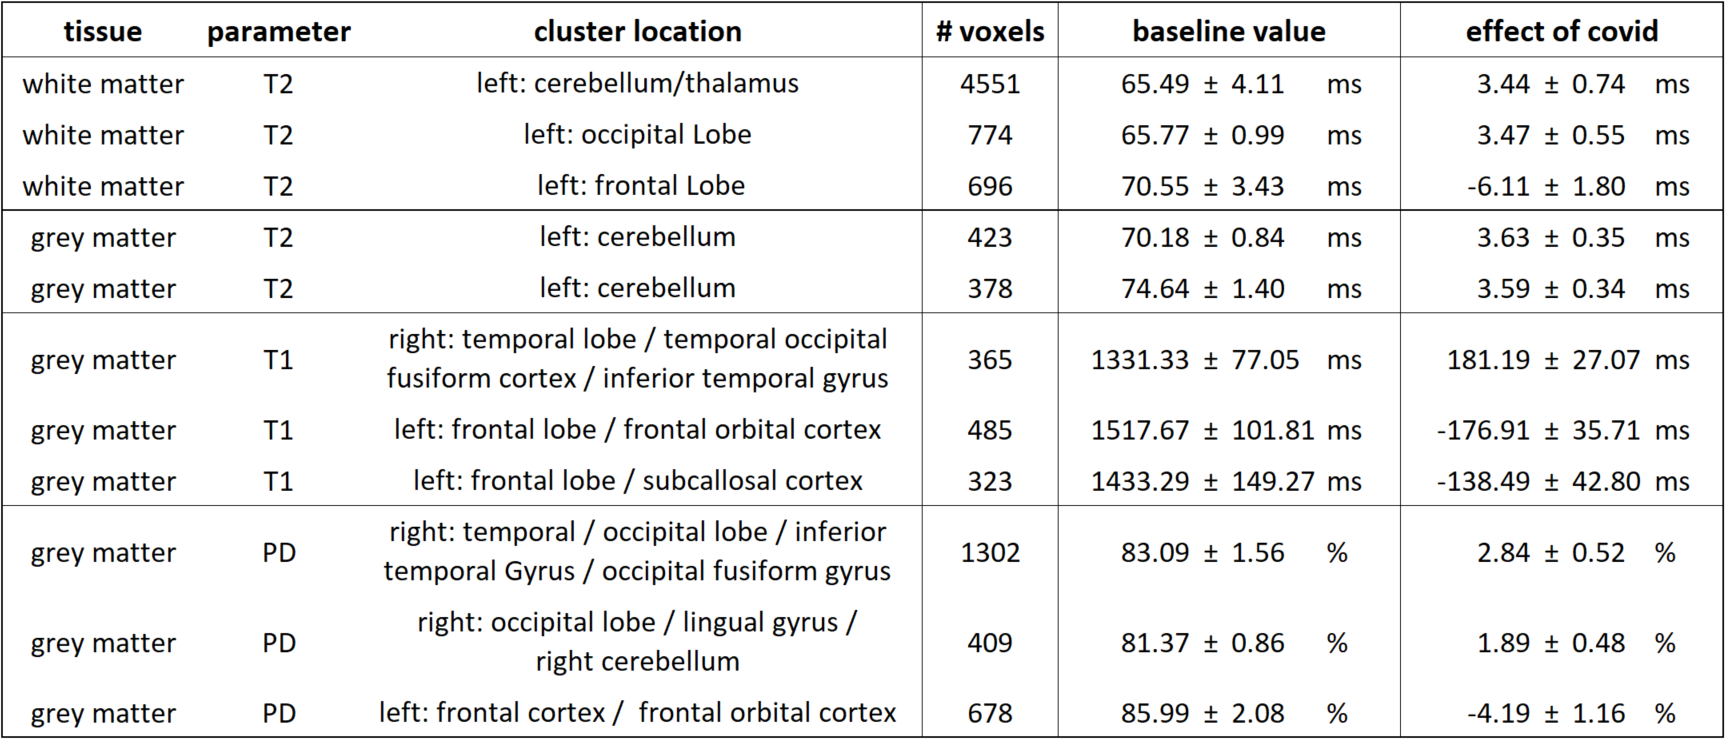
T2 was the only parameter that showed significant changes in WM, all on the left side of the brain (figure 1A). The large cluster with higher T2 values partially overlaps with the middle cerebellar peduncle, inferior cerebellar peduncle, pyramidal tract, and Inferior fronto-occipital fasciculus, while the smaller cluster overlaps with the parietal corpus callosum, inferior fronto-occipital fasciculus, and middle longitudinal fasciculus. The cluster with lower T2 values partially corresponds to the prefrontal corpus callosum and anterior thalamic radiation. The changes in T2 for GM are shown in figure 1B.T1 and PD differences in GM are shown in figure 2. Note that the clusters with positive T1 and PD changes overlap partially, as do the clusters with negative T1 and PD changes. The statistics for all significant clusters are listed in table 2.
Discussion
This research applies a voxel-wise analysis to the 3D-QALAS data for the first time, and to relaxometry in COVID-19, albeit in a relatively small group which only allowed for age as a covariate. In Lathouwers, Radwan et al. 4, the same group of subjects was analysed using whole brain fixel-based analysis, and the WM regions with positive T2 changes in COVID-19 found in our research are more extensive but overlap with regions where diffusion was found to be altered.Wu et al 13 and Qing et al. 14 used relaxometry to investigate the GM and found more T2 changes in the right side of the brain. However, patients in those studies were scanned months after their recovery from COVID-19, which makes it difficult to compare with our results 5.
The different patterns of changes, i.e. different T2 only or a co-localized change in T1 and PD might indicate different types of change at the microstructural level. For example, longer T2 values could indicate a reduction of myelin 15, while an increase in both PD and T1 could indicate an increase in gliosis or free water 16. However, the exact nature of these changes remains unknown and is subject of future research.
Conclusion
A voxel-wise relaxometry analysis was done on 3D-QALAS data, based on the hMRI toolbox, using only a single acquisition. Changes in microstructure were found in the brain stem, left cerebellum, left frontal lobe, thalamus and around the border of the right temporal and occipital lobes.Acknowledgements
We wish to thank Philips for providing the 3D-QALAS sequence, and Synthetic MR for providing the prototype software of SyMRI.References
1. Mahdizade Ari M, Mohamadi MH, Shadab Mehr N, et al. Neurological manifestations in patients with COVID-19: A systematic review and meta-analysis. J Clin Lab Anal. 2022;36(5):1-13. doi:10.1002/jcla.24403
2. Kvernby S, Warntjes MJB, Haraldsson H, Carlhäll C johan, Engvall J, Ebbers T. Simultaneous three-dimensional myocardial T1 and T2 mapping in one breath hold with 3D-QALAS. J Cardiovasc Magn Reson. 2014;16(1):102. doi:10.1186/s12968-014-0102-0
3. West J, Warntjes JBM, Lundberg P. Novel whole brain segmentation and volume estimation using quantitative MRI. Eur Radiol. 2012;22(5):998-1007. doi:10.1007/s00330-011-2336-7
4. Lathouwers E, Radwan A, Blommaert J, et al. A cross-sectional case–control study on the structural connectome in recovered hospitalized COVID-19 patients. Sci Rep. 2023;13(1):1-17. doi:10.1038/s41598-023-42429-y
5. Tassignon B, Radwan A, Blommaert J, et al. Longitudinal changes in global structural brain connectivity and cognitive performance in former hospitalized COVID-19 survivors: an exploratory study. Exp Brain Res. 2023;241(3):727-741. doi:10.1007/s00221-023-06545-5
6. Friston KJ, Ashburner J, Kiebel SJ, Nichols TE, Penny WD, eds. Statistical Parametric Mapping. 1st Editio. Elsevier; 2007. doi:10.1016/B978-0-12-372560-8.X5000-1
7. Tabelow K, Balteau E, Ashburner J, et al. hMRI – A toolbox for quantitative MRI in neuroscience and clinical research. Neuroimage. 2019;194(January):191-210. doi:10.1016/j.neuroimage.2019.01.029
8. Ashburner J. A fast diffeomorphic image registration algorithm. Neuroimage. 2007;38(1):95-113. doi:10.1016/j.neuroimage.2007.07.007
9. Draganski B, Ashburner J, Hutton C, et al. Regional specificity of MRI contrast parameter changes in normal ageing revealed by voxel-based quantification (VBQ). Neuroimage. 2011;55(4):1423-1434. doi:10.1016/j.neuroimage.2011.01.052
10. Desikan RS, Ségonne F, Fischl B, et al. An automated labeling system for subdividing the human cerebral cortex on MRI scans into gyral based regions of interest. Neuroimage. 2006;31(3):968-980. doi:10.1016/j.neuroimage.2006.01.021
11. Mazziotta J, Toga A, Evans A, et al. A probabilistic atlas and reference system for the human brain: International Consortium for Brain Mapping (ICBM). Philos Trans R Soc B Biol Sci. 2001;356(1412):1293-1322. doi:10.1098/rstb.2001.0915
12. Radwan AM, Sunaert S, Schilling K, et al. An atlas of white matter anatomy, its variability, and reproducibility based on constrained spherical deconvolution of diffusion MRI. Neuroimage. 2022;254(January):119029. doi:10.1016/j.neuroimage.2022.119029
13. Wu Y, Zhang X, Shen Y, et al. Magnetic resonance fingerprinting in two-month-recovered COVID-19 patients. In: Proceedings 30th Scientific Meeting, International Society for Magnetic Resonance in Medicine. ; 2021:1743. https://cds.ismrm.org/protected/21MPresentations/abstracts/1743.html.
14. Qing X, Shanshan N, Jianwei L, et al. Towards to quantitative evaluation of brain damages in recovered COVID-19 patients using Synthetic MRI. In: Proceedings 30th Scientific Meeting, International Society for Magnetic Resonance in Medicine. ; 2021:1745. https://cds.ismrm.org/protected/21MPresentations/abstracts/1745.html.
15. MacKay A, Laule C, Vavasour I, Bjarnason T, Kolind S, Mädler B. Insights into brain microstructure from the T2 distribution. Magn Reson Imaging. 2006;24(4):515-525. doi:10.1016/j.mri.2005.12.037
16. Seiler A, Nöth U, Hok P, et al. Multiparametric Quantitative MRI in Neurological Diseases. Front Neurol. 2021;12(March). doi:10.3389/fneur.2021.640239
Figures