2088
Graph theory demonstrates lower nodal efficiency and transitivity in the Default Mode Network 6-12 months after admission for COVID-19 pneumonia1Biomedical Engineering Research Centre, Division of Biomedical Engineering, Department of Human Biology, University of Cape Town, Cape Town, South Africa, 2Neuroscience Institute, University of Cape Town, Cape Town, South Africa, 3Department of Psychiatry and Mental Health, University of Cape Town, Cape Town, South Africa, 4Cape Universities Body Imaging Centre, University of Cape Town, Cape Town, South Africa
Synopsis
Keywords: Functional Connectivity, COVID-19
Motivation: Neural functional networks provide insights into the intrinsic function and integrity of brain areas.
Goal(s): The aim of the current study was to investigate the levels of functional integration and segregation of brain areas within the default mode network (DMN) in a cohort of adults 6-12 months after admission for SARS-CoV-2 pneumonia.
Approach: We used a functional atlas and graph-theoretical framework to model the topology of brain areas within the DMN.
Results: We found reduced functional integration within the DMN of adults previously admitted with SARS-CoV-2. Affected brain areas are involved in higher-cognitive memory processing functions.
Impact: Investigating the brain’s functional organization in the context of post-acute infection with SARS-CoV-2 can offer a window into the neuropathology of long COVID-19 symptoms.
Introduction
Studying the brain as a set of complex networks provides insight into its functional and structural organization 1,2 and may be helpful to characterize neurological, cognitive or mental health symptoms months after acute infection with SARS-CoV-2 (COVID-19)3–5. Independent component analysis (ICA) of resting-state functional MRI (RS-fMRI) data yields resting-state networks (RSNs) comprising spatially distinct but temporally correlated brain regions6,7. Graph theory provides a mathematical framework to model the topological architecture8,9 of brain networks. Here we aimed to investigate the topology of the default mode network (DMN) in adults previously admitted with COVID-19 pneumonia (post-acute-COVID-19) with persistent cognitive and mental symptoms (long-COVID). The DMN is the most active RSN when an individual is not performing an explicit task10,11 and changes may provide insight into the mechanisms of the persistence of symptoms months after acute COVID-19 infection. An important aspect of defining graphs is the definition of nodes and edges that meaningfully represent the brain network. Here we present a novel approach to defining nodes and edges.Methods
Participants were 37 adults assessed 6-12 months after discharge for the treatment of COVID-19 pneumonia at a tertiary hospital in Cape Town South Africa (post-COVID-19) and 20 adults who had not tested positive for or experienced symptoms of COVID-19 (non-COVID-19). T1w anatomical images with a 1x1x1 mm3 resolution and 360 T2*w RS-fMRI volumes comprising 60 slices at 2.4 x 2.4 x 2.4 mm3 resolution were acquired.RS-fMRI pre-processing was performed in AFNI and included slice scan time and motion correction, denoising, and bandpass filtering to 0.01–0.1Hz12. We registered subjects’ data onto the MNI152 normalized brain atlas13 and performed group ICA with FSL’s MELODIC function (https://fsl.fmrib.ox.ac.uk/fsl/fslwiki/MELODIC) to compute RSNs. The DMN was visually identified among the generated components.
We used the Craddock RS-fMRI atlas to define nodes within the DMN. The Craddock atlas is an MNI152 normalised whole-brain atlas of clusters of 200 spatially distinct and functionally homogenous brain areas14. Clusters of the Craddock atlas that fell within the DMN binarized mask, or portions of clusters that overlapped by 10 or more voxels with the mask, were defined as nodes (Figure 1). Edge weights between every pair of nodes were defined as the functional connectivity (FC) computed as the Pearson correlation coefficient (r) between the mean time series of the nodal pair. The number of edges per participant were compared across groups for different FC thresholds. For graph analyses, we used the Fisher Z transform of the absolute value of r as edge weights.
We used each subject’s graph to calculate nodal measures including nodal strength which corresponds to the weight of connections, nodal transitivity which corresponds to the degree of clustering or segregation of the node with its direct neighbours, and nodal efficiency which corresponds to the degree of integration the node has to other nodes in the entire network9,15.
We compared these graph measures between the post-acute-COVID-19 and non-COVID-19 groups, controlling for potential confounding by age of participants.
Results
9 participants (5 post-acute-COVID-19 and 4 non-COVID-19 controls) were excluded due to not meeting motion inclusion criteria. Here we present results from 48 participants (32 post-COVID-19; Table 1). In total the DMN had 106 nodes. The number of edges were distributed similarly across groups for different functional connectivity thresholds (Figure 2), except that only 56% of the post-acute-COVID-19 group had more than 2,500 edges with r>0.3, compared to 69% of the non-COVID-19 group. We found lower nodal transitivity and efficiency in the post-COVID-19 group compared to the uninfected group in 3 and 4 nodes, respectively. Affected nodes were in frontal and parietal regions. Figure 3 shows affected nodes and their corresponding statistics can be found in Table 2.Discussion
Brain fog, poor concentration and executive dysfunction are commonly reported post-acute infection with COVID-1916. Reduced nodal efficiency in frontal and parietal regions suggests low integration in these brain areas within the network in participants experiencing post-acute infection symptoms. In addition, reduced nodal transitivity in posterior parietal and inferior frontal regions points to lower local clustering of connectivity around these nodes. The affected areas are important for cognitive function including both working and episodic memory17,18.Conclusion
The current study demonstrates post-acute-COVID-19 related alterations in memory processing areas. In addition, we demonstrate a method to measure the topological architecture of RSNs.Acknowledgements
The current study was funded by University of Cape Town and the South African National Research Foundation (NRF) (grant 48337).
References
1. Sporns, O. Graph theory methods: Applications in brain networks. Dialogues Clin Neurosci 20, 111–120 (2018).
2. Sporns, O. The Human Connectome. in Diffusion MRI 401–428 (Elsevier, 2014). doi:10.1016/B978-0-12-396460-1.00018-4.
3. Li, Q. et al. Pre-COVID brain network topology prospectively predicts social anxiety alterations during the COVID-19 pandemic. Neurobiol Stress 27, 100578 (2023).
4. Prasad, K., AlOmar, S. Y., Alqahtani, S. A. M., Malik, M. Z. & Kumar, V. Brain Disease Network Analysis to Elucidate the Neurological Manifestations of COVID-19. Mol Neurobiol 58, 1875–1893 (2021).
5. Esposito, F. et al. Olfactory loss and brain connectivity after COVID-19. (2021) doi:10.1002/hbm.25741.
6. Friston, K. J., Frith, C. D. & Frackowiak, R. S. J. Time-dependent changes in effective connectivity measured with PET. Hum Brain Mapp 1, 69–79 (1993).
7. Fox, M. D. et al. The human brain is intrinsically organized into dynamic, anticorrelated functional networks. PNAS July 5, 9673–9678 (2005).
8. Bullmore, E. & Sporns, O. Complex brain networks: Graph theoretical analysis of structural and functional systems. Nat Rev Neurosci 10, 186–198 (2009).
9. Fornito, A., Zalesky, A. & Bullmore, E. T. Fundamentals of brain network analysis. (2016).
10. Smallwood, J. et al. The default mode network in cognition: a topographical perspective. Nature Reviews Neuroscience 2021 22:8 22, 503–513 (2021).
11. Menon, V. 20 years of the default mode network: A review and synthesis. Neuron 111, 2469–2487 (2023).
12. Cordes, D. et al. Frequencies Contributing to Functional Connectivity in the Cerebral Cortex in “Resting-state” Data. AJNR Am J Neuroradiol 22, 1326 (2001).
13. Fonov, V., Evans, A., McKinstry, R., Almli, C. & Collins, D. Unbiased nonlinear average age-appropriate brain templates from birth to adulthood. Neuroimage 47, S102 (2009).
14. Craddock, R. C., James, G. A., Holtzheimer, P. E., Hu, X. P. & Mayberg, H. S. A whole brain fMRI atlas generated via spatially constrained spectral clustering. Hum Brain Mapp 33, 1914–1928 (2012).
15. Rubinov, M. & Sporns, O. Complex network measures of brain connectivity: Uses and interpretations. Neuroimage 52, 1059–1069 (2010).
16. Peghin, M. et al. Post-COVID-19 symptoms 6 months after acute infection among hospitalized and non-hospitalized patients. Clinical Microbiology and Infection 27, 1507–1513 (2021).
17. Yu, S., Mückschel, M. & Beste, C. Superior frontal regions reflect the dynamics of task engagement and theta band-related control processes in time-on task effects. Sci Rep 12, (2022).
18. Vuilleumier, P. Mapping the functional neuroanatomy of spatial neglect and human parietal lobe functions: progress and challenges. Ann N Y Acad Sci 1296, 50–74 (2013).
Figures
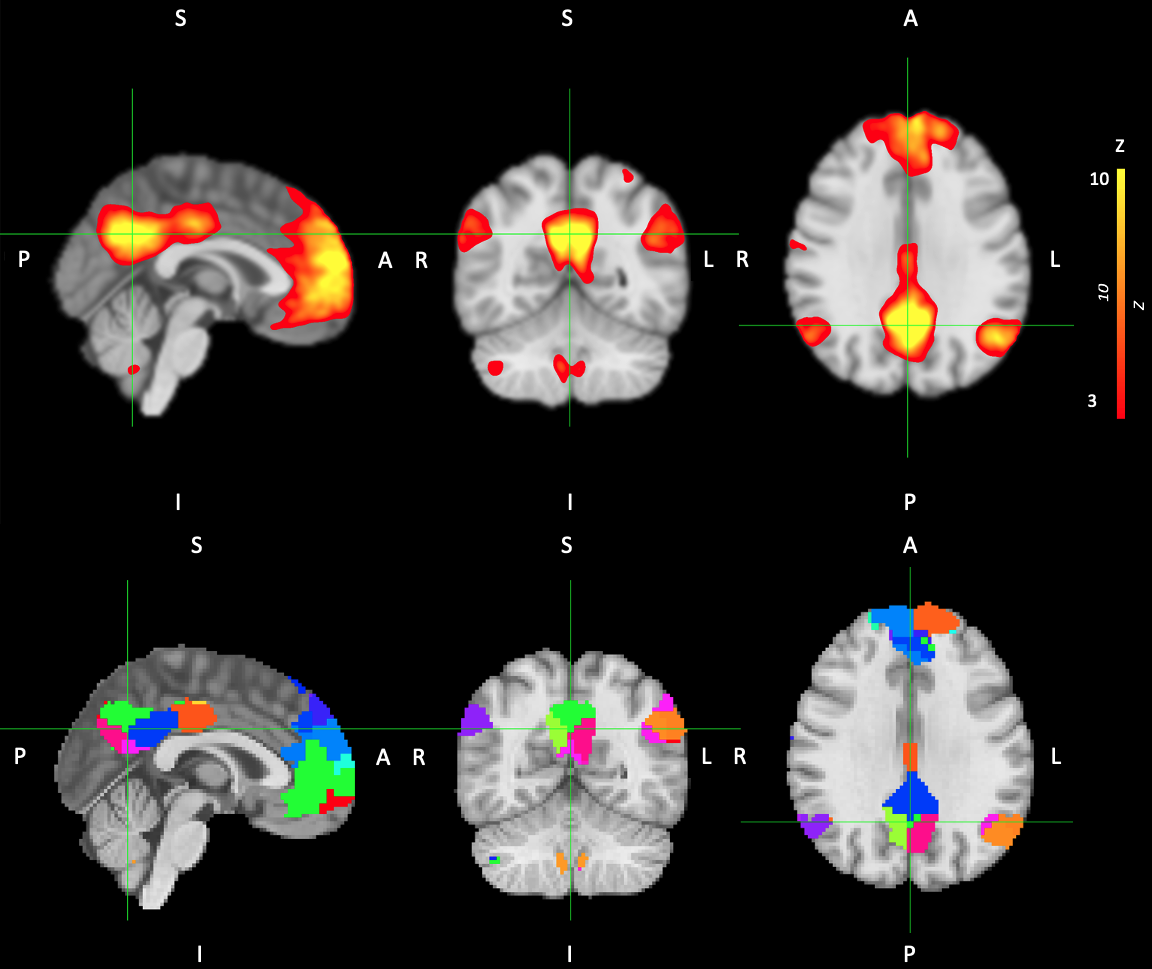
Figure 1: (Top row) Default Mode Network (DMN) map (thresholded at Z>3) generated using group Independent Component Analysis. Map is overlaid on the standard MNI152 T1-weighted image. (Bottom row) Craddock atlas clusters, or portions of clusters, that overlap with the Default Mode Network.
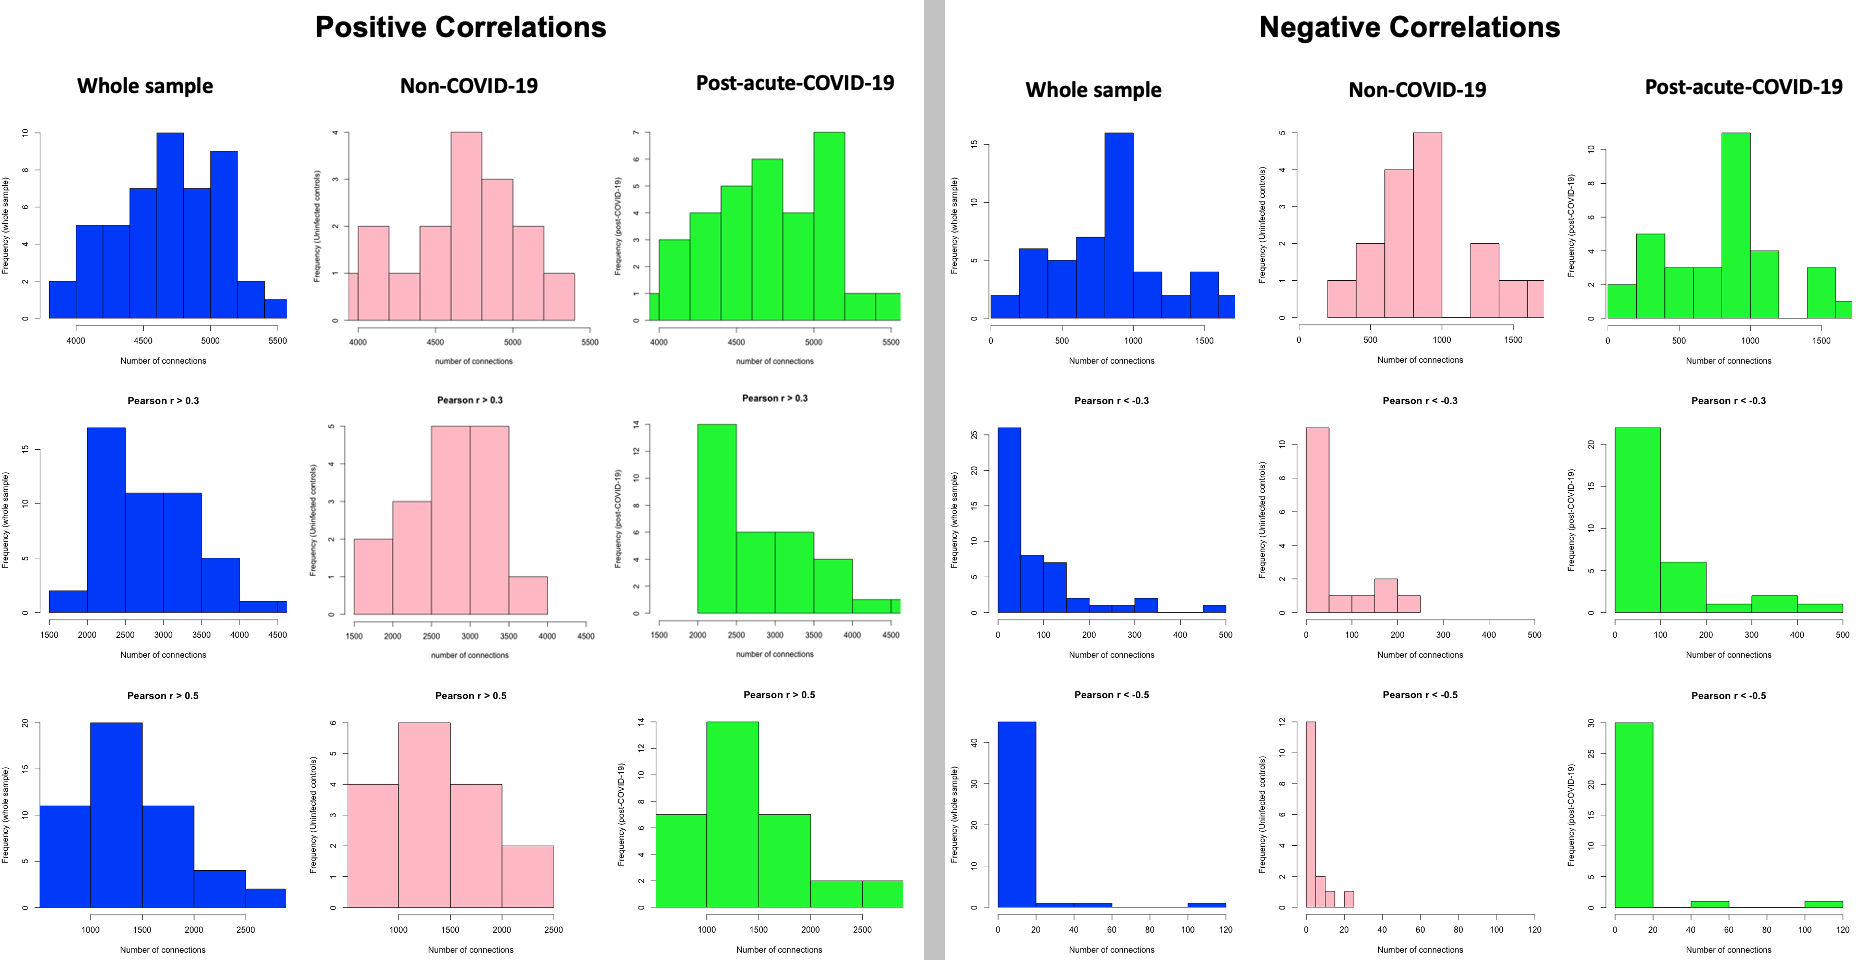
Figure 2: Distributions of the number of edges across the whole sample (blue), in the non-COVID-19 group (pink) and in the post-acute-COVID-19 group (green). The distributions are shown separately for edges with positive (left) and negative (right) correlations and for 3 different functional connectivity thresholds: (top row) all positive and negative non-zero Pearson correlations, (middle row) Pearson r > 0.3 or < -0.3, and (bottom row) Pearson r > 0.5 or < -0.5.
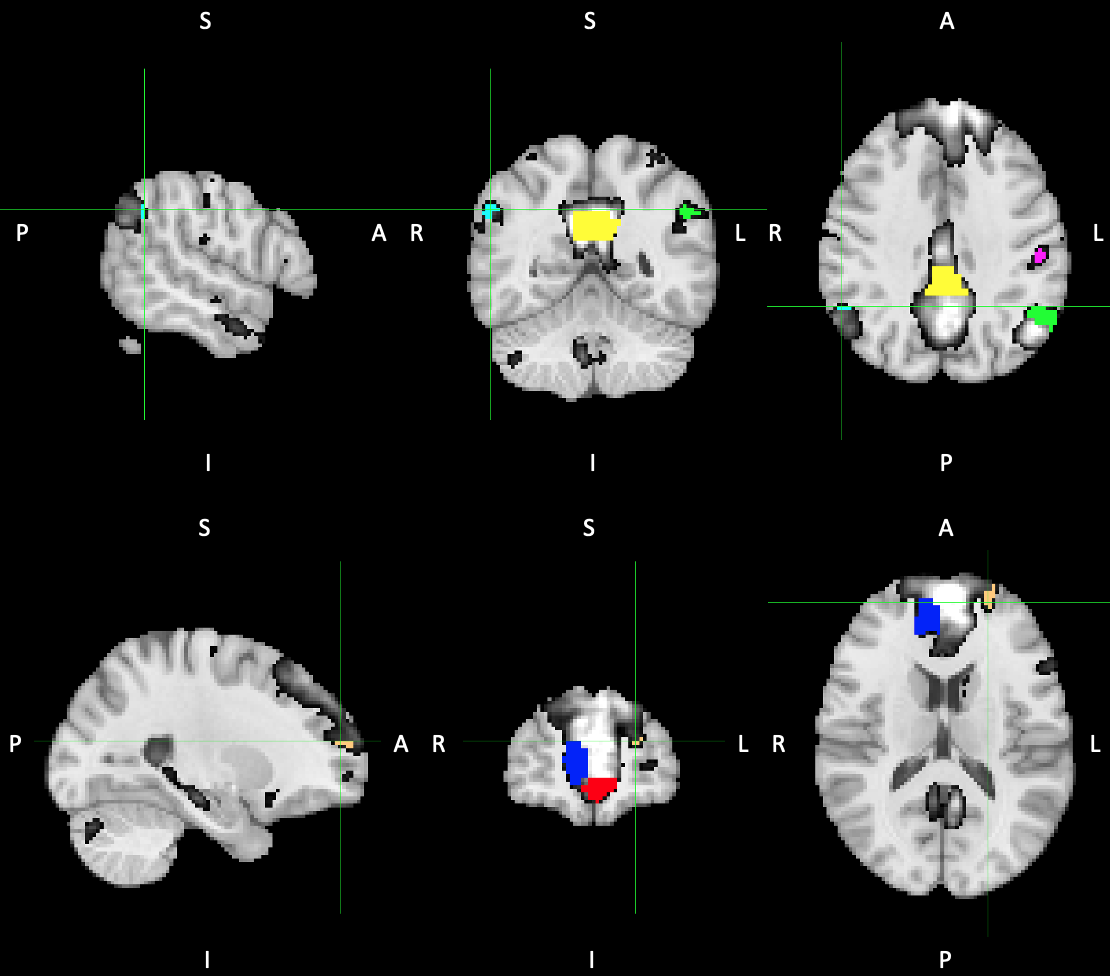
Figure 3: Nodes showing lower nodal integrity in the post-acute-COVID-19 group compared to non-COVID-19. Yellow – lh medial parietal, Cyan – rh posterior parietal, Green – lh posterior parietal, Pink – lh superior parietal, Cream – lh superior frontal, Red – lh inferior frontal and Blue - rh inferior frontal. Nodes are overlaid on the Default Mode Network map (black&white). lh/rh – left/right hemisphere.
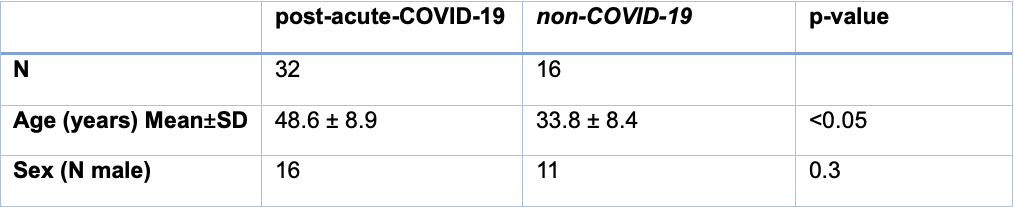
Table 1: Sample characteristics of adults 6-12 months after being hospitalized due to COVID-19 pneumonia and uninfected controls.
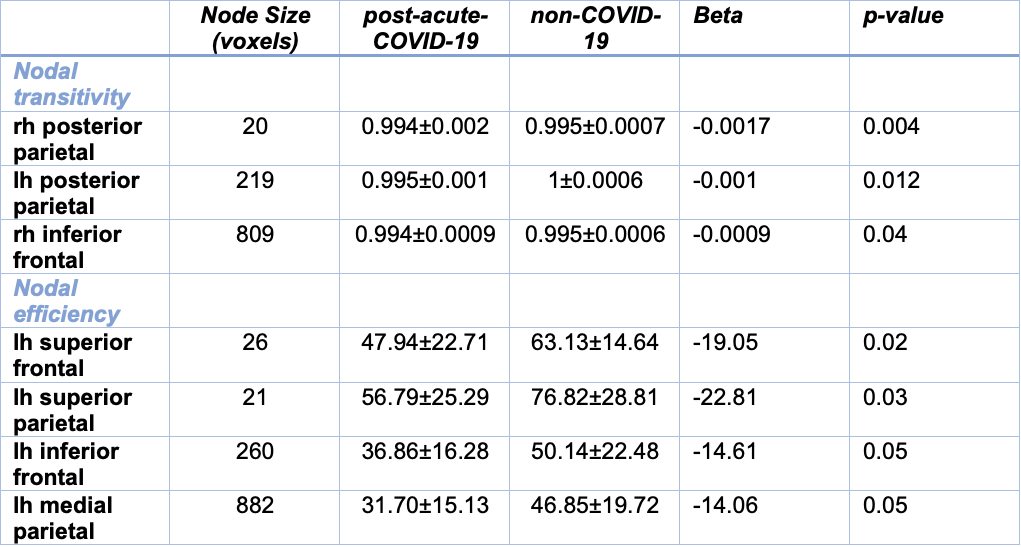
Table 2: Nodes showing lower nodal integrity in the post-acute-COVID-19 group compared to non-COVID-19 controls. lh/rh - left/right hemisphere. Values are mean ± SD. Voxel size 2.43 mm3.