2082
Post-COVID Fatigue Relates to Bioenergetic Dysfunctions in the Posterior Cingulate Gyrus1Department of Brain and Cognitive Sciences, Seoul National University, Seoul, Korea, Republic of, 2METLiT Inc., Seoul, Korea, Republic of, 3Division of Rehabilitation Medicine, National University Hospital, Singapore, Singapore, 4Department of Medicine, National University of Singapore, Singapore, Singapore
Synopsis
Keywords: Infectious Disease, Brain, COVID-19, Biomarkers, Fatigue, Spectroscopy
Motivation: Persistent fatigue after recovery from SARS-CoV-2 shows pathologies comparable to chronic fatigue syndrome or myalgic encephalomyelitis (CFS/ME). It is unknown if disruptions in mitochondrial functions caused by SARS-CoV-2 persists in post COVID fatigue as dysregulated mitochondrial homeostasis.
Goal(s): We aim to investigate if post-COVID fatigue relates to perturbations of mitochondrial function in the brain representing signs of neuroinflammation, redox imbalance, and neuronal dysfunctions.
Approach: Proton MR spectroscopy was performed on post-COVID fatigue patients targeting at posterior cingulate gyrus (PCG), one of the most metabolically active regions.
Results: We found reduced level of antioxidants and neuronal activity in post-COVID fatigue patients.
Impact: Proton MR spectroscopy in PCG of post-COVID fatigue patients shows signs of redox imbalance and reduced neuronal activity, suggesting of long-term dysregulations in mitochondrial homeostasis persisting after SARS-CoV-2 infection. SARS-CoV-2 infection may lead to further neurodegenerations post-recovery.
Introduction
SARS-CoV-2 may induce mitochondrial dysfunction through direct ACE2 receptor infection, leading to persistent redox imbalance1. Persistent degradation of mitochondrial oxidative phosphorylation may cause bioenergetic inefficiency2. A post-COVID subset faces analogous CFS/ME-like fatigue, hinting at dysregulated mitochondrial homeostasis. This study explores whether post-COVID fatigue relates to brain mitochondrial dysfunction, probing signs of inflammation, redox imbalance, and neuronal dysfunctions via proton MR spectroscopy on PCG, a metabolically active and neurodegeneration-prone region. We applied deep learning-aided methods for metabolite quantification3-5.Methods
Data acquisition: This study was approved by Singapore National Health Group IRB. An experimental group (post-COVID fatigue) experiencing persistent fatigue for more than four weeks post SARS-CoV-2 recovery, demonstrating a Chalder Fatigue Score (CFQ) ≥ 19 (n = 18, mean age = 44.7 ± 17.3 years, 10 men, CFQ = 23.2 ± 3.2); and a control group (CON) without fatigue complaints, showing CFQ ≤ 11 (n = 15, 37.5 ± 9.0 years, 2 men, CFQ = 9.4 ± 7.3). Single voxel MR spectra from all participants were acquired from the PCG region (voxel size 8cm3) using PRESS6 at 3.0T (Siemens Prisma; TR/TE = 2000/30ms, SW = 1.5 kHz, 2048 points, 128 averages for water suppressed and 16 for water unsuppressed).Metabolite quantification: After correcting for eddy current effects, phase distortion, and frequency offset, a pre-trained Bayesian deep neural network (BDNN) was used to quantify a total of 17 metabolites from the collected MR spectra based on previous studies. In the training and validation phase of BDNN, 10 million synthetic brain MR spectra were utilized3-5.
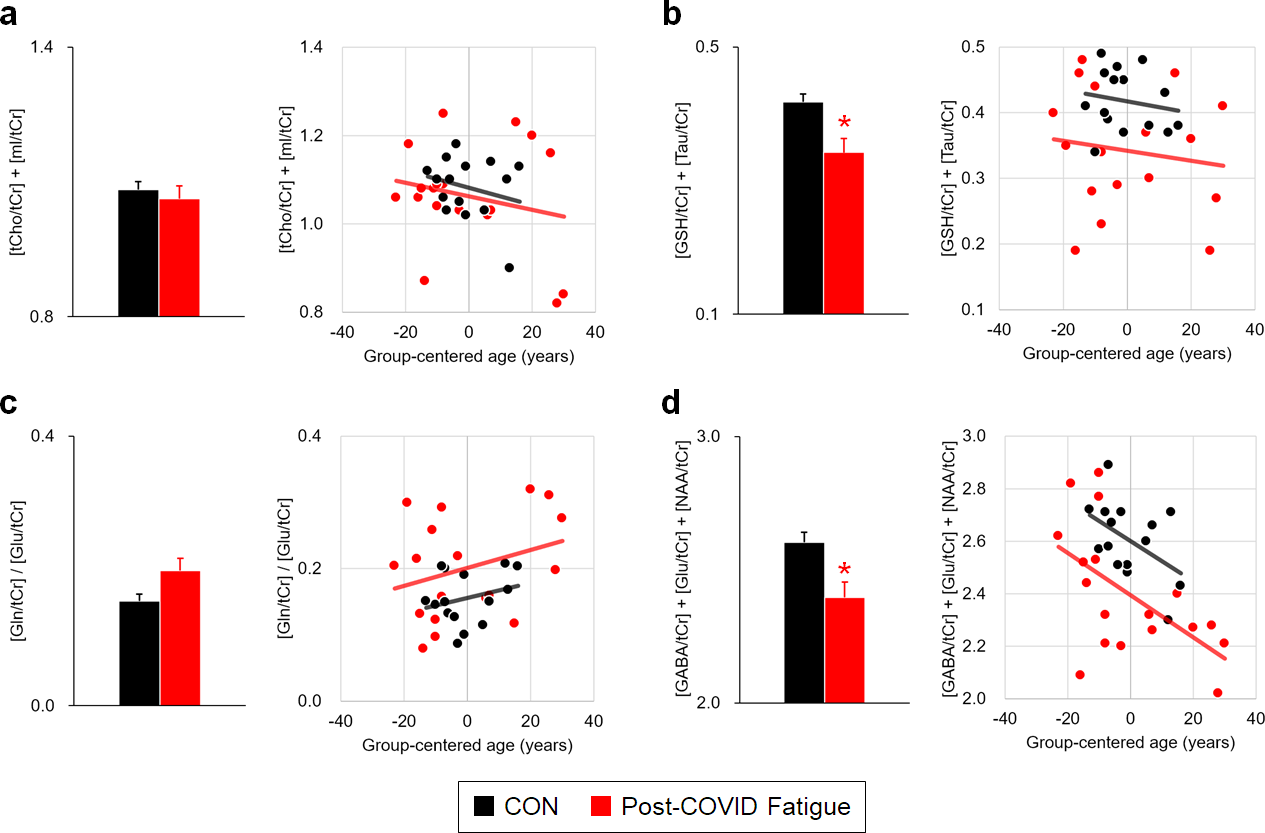
Measures of interest: We quantified four combinations of metabolites normalized by total creatine concentration: 1) [tCho + mI], which are known to be elevated in neuroinflammatory responses7; 2) [GSH + Tau], which perform antioxidative roles during mitochondrial metabolism8; 3) [Gln / Glu], which relate to altered bioenergetic metabolism9, and; 4) [GABA + Glu + NAA], which collectively represent the overall neuronal activity level. We aimed to evaluate mitochondrial dysfunctions in post-COVID fatigue compared to controls.
Statistical analysis: Between-group statistical analyses were conducted using multivariate ANOVA with four measures of interest as dependent variables, with the statistical model “Metabolites ~ Group + Age + Gender:Age + 1.” We further calculated the Pearson’s bivariate correlation of metabolites to age and CFQ, whose correlation coefficients were compared between groups (Z-test). To account for the effect of age in bioenergetic metabolism, we subtracted within-group mean age for each subject before MANOVA. We confirmed if the MANOVA results hold counting female subjects only, because of the significant sample imbalance in gender between groups (χ2 = 6.303, p = 0.012). Multiple comparisons were Bonferroni-corrected for four cases.
Results and Discussion
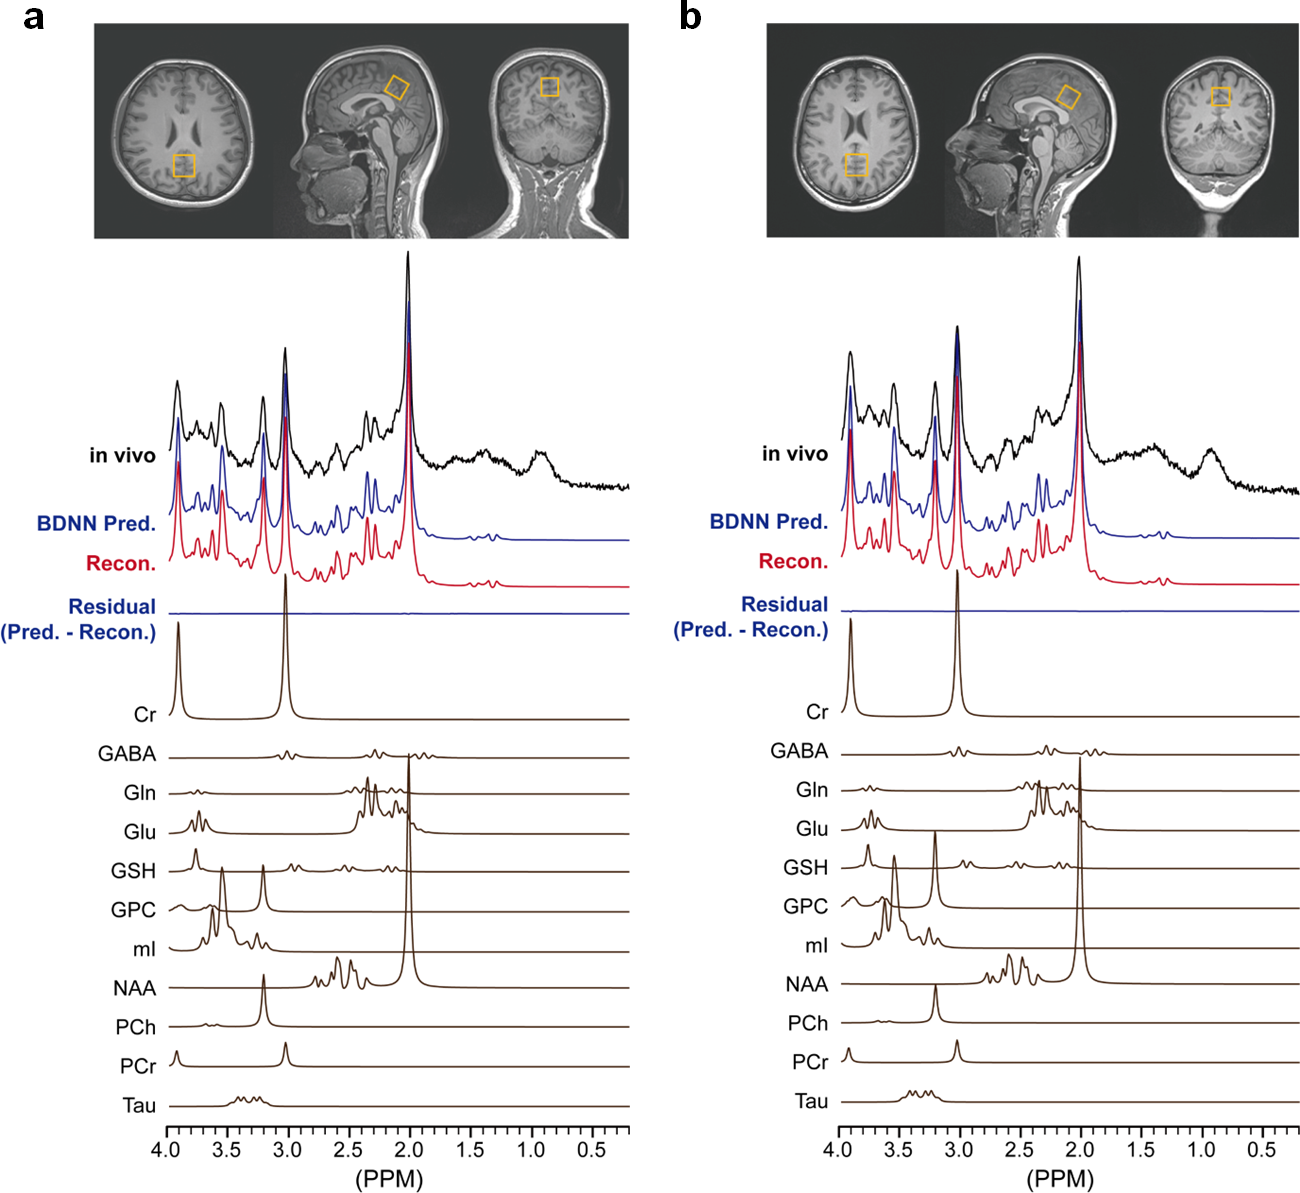
The representative acquired MR spectra and analyzed through BDNN for each group are presented in Figure 1. Multivariate test found the significant main effect of post-COVID fatigue versus CON [F(4, 26) = 4.790, p = 0.005, Cohen’s f = 0.858]. The group effect was significant only selecting female subjects [F(4, 15) = 4.601, p = 0.013, Cohen’s f = 1.108]. After correction for multiple comparison (p < 0.050/4), the group effect was significant for [GSH + Tau] and [GABA + Glu + NAA] with p < 0.002 (Figure 2b, 2d), but not for [tCho + mI] and [Gln / Glu] with p > 0.033 (Figure 2a, 2c). Bivariate correlation of age was only significant for overall neuronal activity after correction (rho = -0.490, p = 0.004), but the correlation coefficients were not different between groups. CFQ was not significantly correlated with metabolite measures (p > 0.477).The results align with prior reports on prolonged SARS-CoV-2 symptoms10,11. Post-COVID fatigue is associated with a likelihood of redox imbalance and reduced neuronal activity, rather than neuroinflammation itself. According to our findings, post-COVID fatigue is more closely linked to mitochondrial dysfunctions and inefficient energy metabolism than to SARS-CoV-2-related neuroinflammation. Decreased neuronal activity may be a consequence of heightened oxidative stress from lower antioxidant levels. Thus, an effective post-COVID fatigue treatment may prioritize addressing the redox imbalance influenced by SARS-CoV-2 infection11. Our results additionally highlight a potential connection between SARS-CoV-2 and neurodegenerative conditions like Alzheimer’s disease, which also reduces neuronal activity (NAA and Glu) in the PCG area12.
Conclusion
Proton MR spectroscopy provided insight that impaired bioenergetic metabolism, entailed by mitochondrial dysfunction in the brain subsequent to SARS-CoV-2 disease, would be the mainstay of post-COVID fatigue. A large-scale multimodal investigation using other biomarkers would be warranted to affirm the quantitative imaging findings.Acknowledgements
This research was funded by National University Health System-Seed Fund grant number (NR21MRF268).
This work was supported by the LAMP Program of the National Research Foundation of Korea (NRF) grant funded by the Ministry of Education (No. RS-2023-00301976).
References
1. Singh KK, Chaubey G, Chen JY, Suravajhala P. Decoding SARS-CoV-2 hijacking of host mitochondria in COVID-19 pathogenesis. Am J Physiol Cell Physiol. Aug 1 2020;319(2):C258-C267. doi:10.1152/ajpcell.00224.2020
2. Saleh J, Peyssonnaux C, Singh KK, Edeas M. Mitochondria and microbiota dysfunction in COVID-19 pathogenesis. Mitochondrion. Sep 2020;54:1-7. doi:10.1016/j.mito.2020.06.008
3. Lee HH, Kim H. Bayesian deep learning-based (1) H-MRS of the brain: Metabolite quantification with uncertainty estimation using Monte Carlo dropout. Magn Reson Med. Jul 2022;88(1):38-52. doi:10.1002/mrm.29214
4. Lee HH, Kim H. Deep learning-based target metabolite isolation and big data-driven measurement uncertainty estimation in proton magnetic resonance spectroscopy of the brain. Magn Reson Med. Oct 2020;84(4):1689-1706. doi:10.1002/mrm.28234
5. Lee HH, Kim H. Intact metabolite spectrum mining by deep learning in proton magnetic resonance spectroscopy of the brain. Magn Reson Med. Jul 2019;82(1):33-48. doi:10.1002/mrm.27727
6. Bottomley PA. Spatial localization in NMR spectroscopy in vivo. Ann N Y Acad Sci. 1987;508(1):333-48. doi:10.1111/j.1749-6632.1987.tb32915.x
7. Mueller C, Lin JC, Sheriff S, Maudsley AA, Younger JW. Evidence of widespread metabolite abnormalities in Myalgic encephalomyelitis/chronic fatigue syndrome: assessment with whole-brain magnetic resonance spectroscopy. Brain Imaging Behav. Apr 2020;14(2):562-572. doi:10.1007/s11682-018-0029-4
8. Wood E, Hall KH, Tate W. Role of mitochondria, oxidative stress and the response to antioxidants in myalgic encephalomyelitis/chronic fatigue syndrome: A possible approach to SARS-CoV-2 'long-haulers'? Chronic Dis Transl Med. Mar 2021;7(1):14-26. doi:10.1016/j.cdtm.2020.11.002
9. Paez-Franco JC, Torres-Ruiz J, Sosa-Hernandez VA, et al. Metabolomics analysis reveals a modified amino acid metabolism that correlates with altered oxygen homeostasis in COVID-19 patients. Sci Rep. Mar 18 2021;11(1):6350. doi:10.1038/s41598-021-85788-0
10. Ernst T, Ryan MC, Liang HJ, et al. Neuronal and Glial Metabolite Abnormalities in Participants with Persistent Neuropsychiatric Symptoms After COVID-19: A Brain Proton MR Spectroscopy Study. J Infect Dis. Aug 4 2023:jiad309. doi:10.1093/infdis/jiad309
11. Saleh MG, Chang L, Liang H, et al. Ongoing oxidative stress in individuals with post-acute sequelae of COVID-19. NeuroImmune Pharm Ther. Jun 2023;2(2):89-94. doi:10.1515/nipt-2022-0006
12. Fayed N, Modrego PJ, Rojas-Salinas G, Aguilar K. Brain glutamate levels are decreased in Alzheimer's disease: a magnetic resonance spectroscopy study. Am J Alzheimers Dis Other Demen. Sep 2011;26(6):450-6. doi:10.1177/1533317511421780
Figures