2074
Structural and Oxygen Metabolic Magnetic Resonance Imaging of long-COVID and ME/CFS1BioMedical Engineering and Imaging Institute, Icahn School of Medicine at Mount Sinai, New York, NY, United States, 2Department of Radiology, Icahn School of Medicine at Mount Sinai, New York, NY, United States, 3Department of Radiology, Johns Hopkins University, Baltimore, MD, United States, 4Department of Neurology, Icahn School of Medicine at Mount Sinai, New York, NY, United States
Synopsis
Keywords: Infectious Disease, Metabolism
Motivation: Many long-COVID patients experience fatigue and post exertional malaise which are primary symptoms of Myalgic Encephalomyelitis/Chronic Fatigue Syndrome (ME/CFS). Understanding the similarities and differences between long-COVID and classic ME/CFS could provide insights into the disease mechanisms.
Goal(s): To measure brain anatomy and oxygen metabolism between the two groups.
Approach: Clinical standard and advanced MRI techniques measuring the venous oxygenation were applied. The fatigue level was assessed by questionnaires.
Results: No differences in brain anatomy were observed between the groups, but the long-COVID group had significant lower venous oxygenation than the healthy control group and the classic CFS group.
Impact: Many long-COVID patients fulfill diagnostic criteria for Myalgic Encephalomyelitis/Chronic Fatigue Syndrome (ME/CFS). Compared to structural changes, metabolism-related parameters, such as venous oxygenation of the brain, may be more sensitive to changes related to long-COVID and CFS disease mechanisms.
Introduction
Many patients who have recovered from SARS-CoV-2, the virus that causes COVID-19, continue to experience a constellation of symptoms long after the initial illness.1,2 Known as “long-COVID”, or Post-Acute Sequelae of SARS-Cov-2 infection (PASC), the most frequently reported symptoms are fatigue, post exertional malaise and cognitive dysfunction, which are also the primary symptoms of Myalgic Encephalomyelitis/Chronic Fatigue Syndrome (ME/CFS). Many PASC patients fulfill the diagnostic criteria for ME/CFS, 3,4 but differ from non-PASC ME/CFS patients in that they share a common infectious trigger and have a shorter duration of illness, which reduces disease heterogeneity.4 The underlying mechanism responsible for the genesis of ME/CFS remains elusive, and no imaging biomarker has been identified. Understanding whether PASC ME/CFS shares overlapping mechanisms with non-PASC ME/CFS is critical, as this could provide insights into the disease mechanisms and inform treatment strategies of ME/CFS in general. In this project, we conducted comprehensive MRI to determine similarities or differences in brain anatomy and oxygen metabolism between PASC and non-PASC ME/CFS patients, as well as healthy individuals.Methods
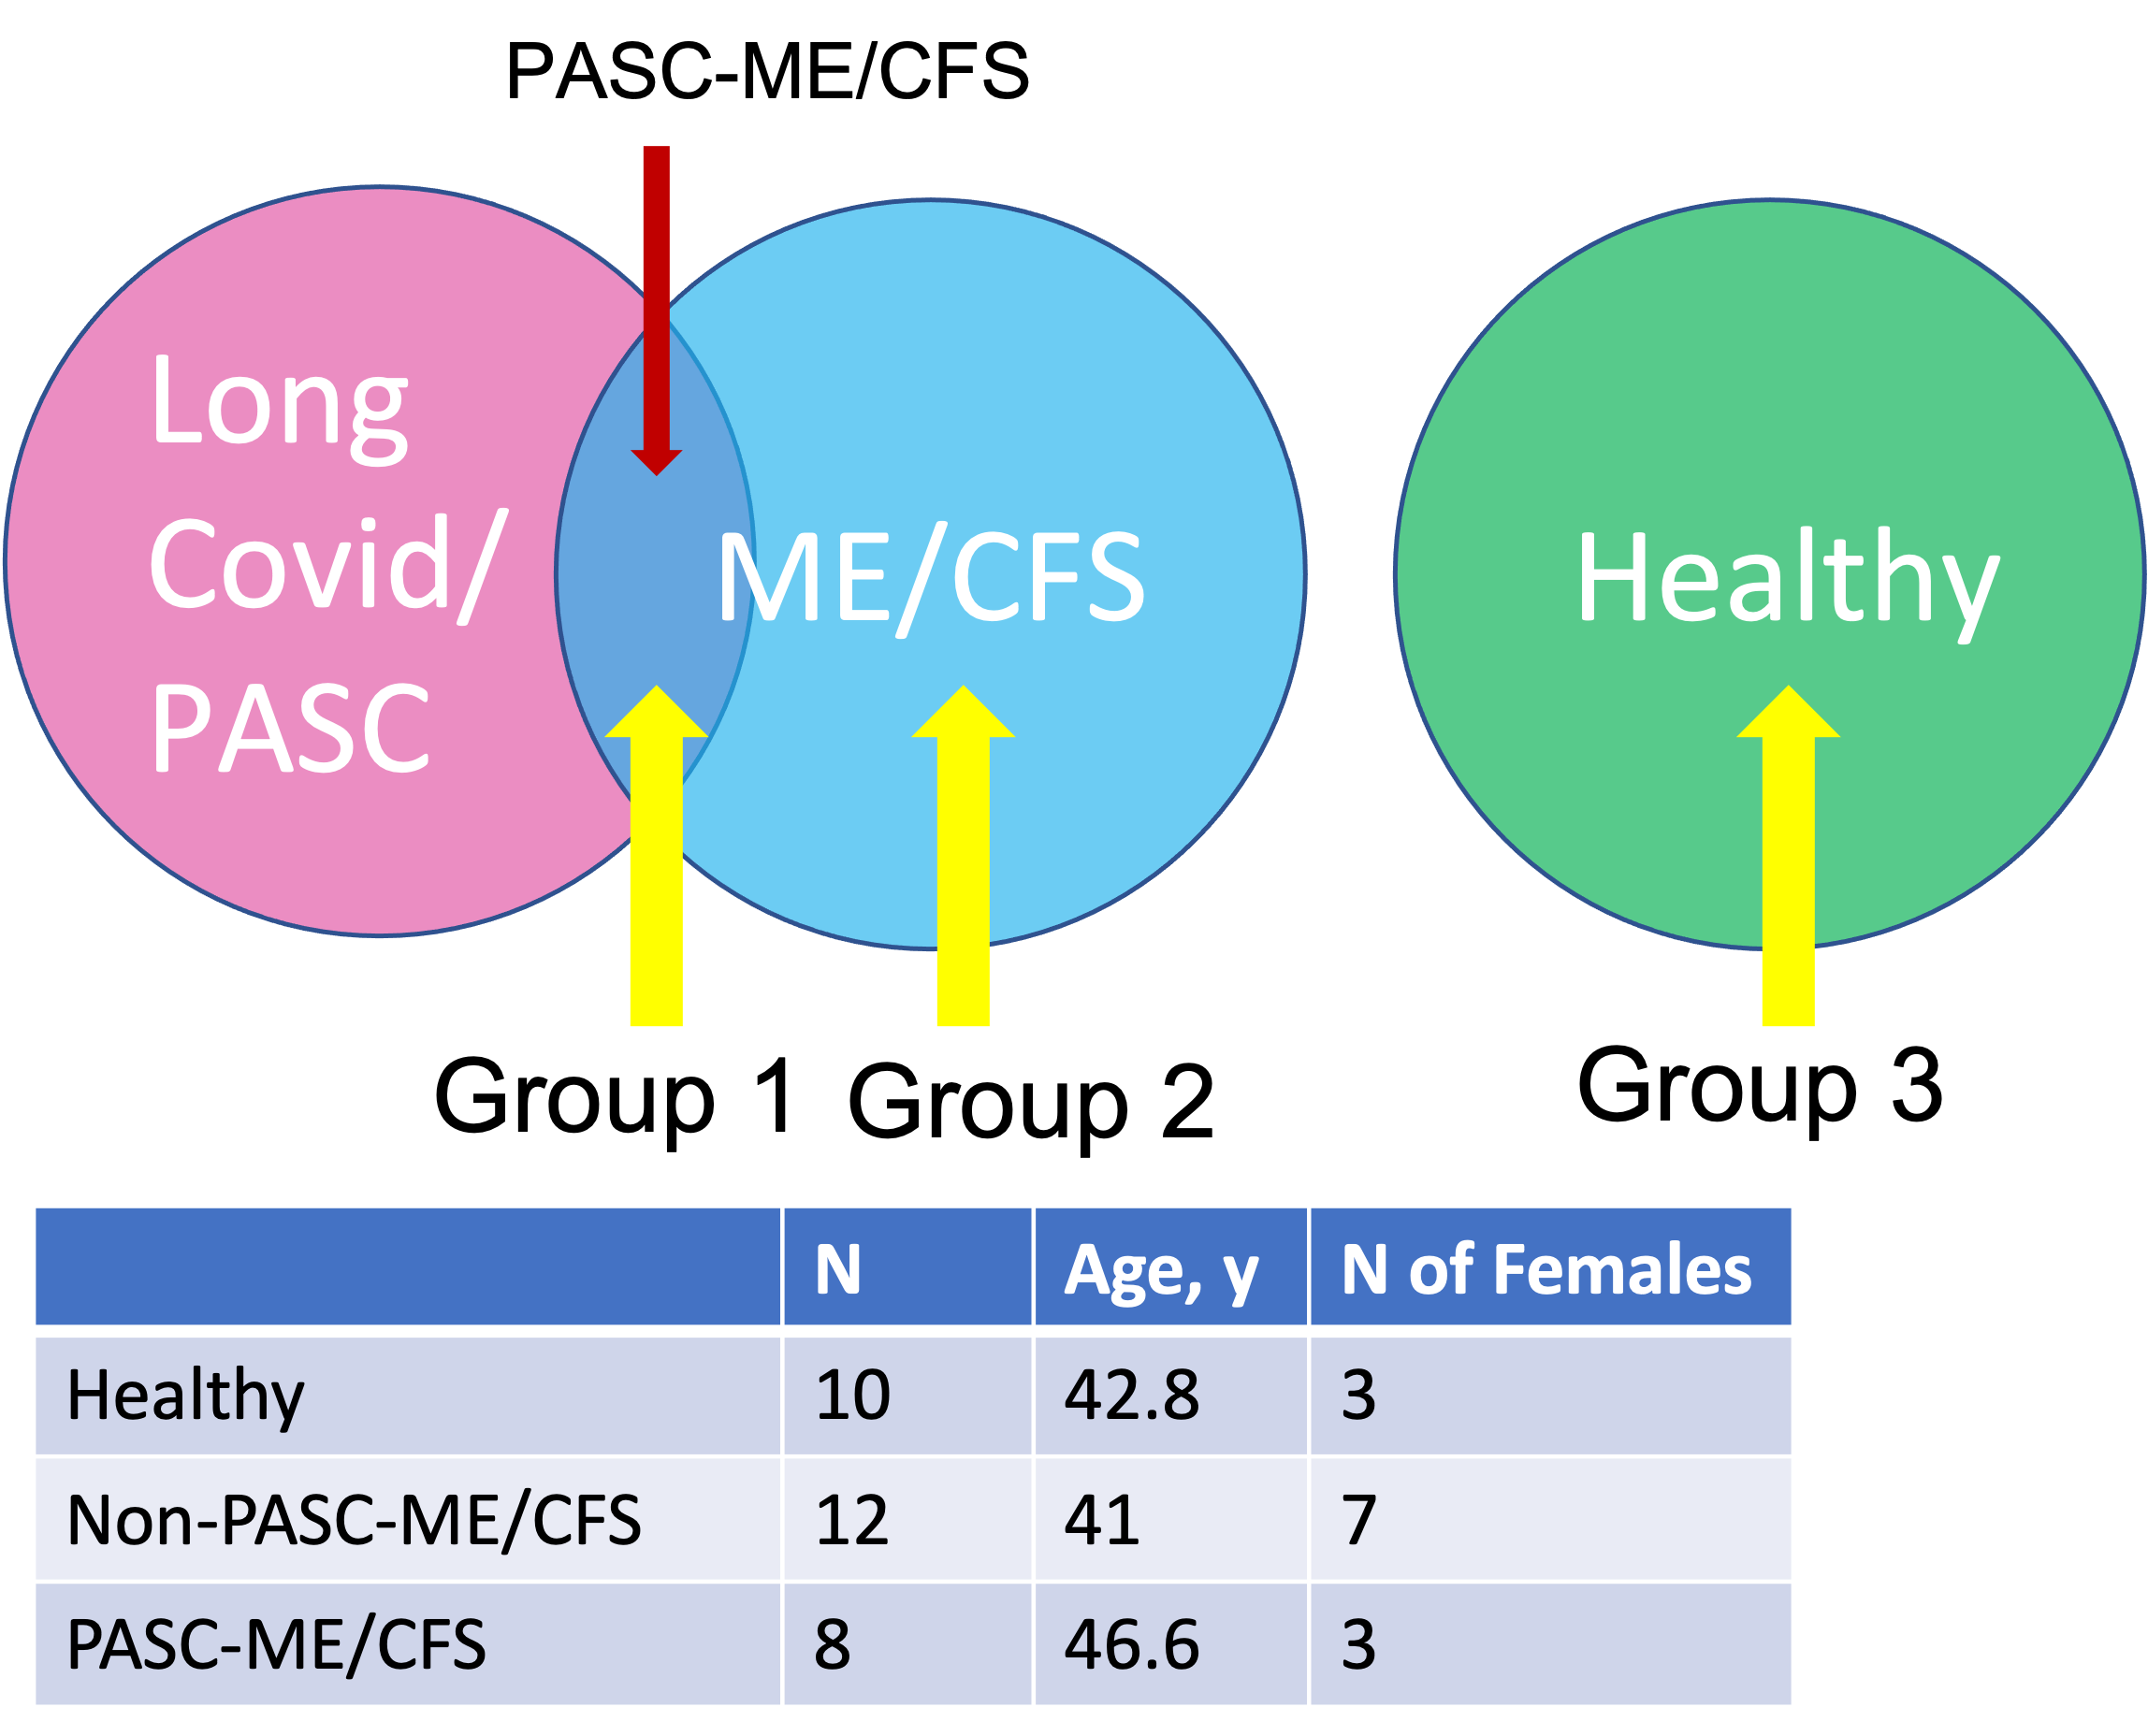
The study was conducted on of PASC ME/CFS patients, classic ME/CFS patients and healthy controls (Fig. 1). All imaging studies were conducted on a 3T Siemens Skyra system. Structural MRI: clinical standard MRI sequences were applied which include T1 weighted MPRAGE, T2 FLAIR and SWI. Physiological MRI: Venous oxygenation Yv, was measured through T2 relaxation time of the sagittal sinus using the T2-Relaxation-Under-Spin-Tagging (TRUST) MRI technique.5-7 The imaging plane was selected to go through the superior sagittal sinus approximately 20 mm above the sinus congruence. A single-shot gradient-echo EPI was used for image acquisition. Imaging parameters: voxel size 3.44×3.44×5 mm3, TR=3000 ms, TI=1022 ms, four eTEs: 1, 40, 80 and 160 ms, labeling thickness 100 mm, gap 22.5 mm, scan duration 1.2 min. Venous T2 signal was converted to Yv using a calibration plot. For global cerebral blood flow (CBF), the flux in the 4 major feeding vessels (internal carotid and vertebral arteries) of the brain were measured individually using phase contrast MRI. Then the CBF were calculated by normalizing the flux over the brain volumes that were measured using T1w MPRAGE images. Saturation pressure of oxygen (SPO2 or Ya) were measured during the MRI scan using a pulse oximeter. Oxygen extraction fraction (OEF) was calculated as Ya-Yv, where Ya and Yv are arterial and venous blood oxygenation fractions. CMRO2 were calculated using CMRO2 = Ca·CBF·(Ya-Yv).8 Fatigue level measurement: Fatigue level was evaluated using the Multidimensional Fatigue Inventory and the Physical Functioning Scale (PFS) of the Short Form 36.Results and Discussions
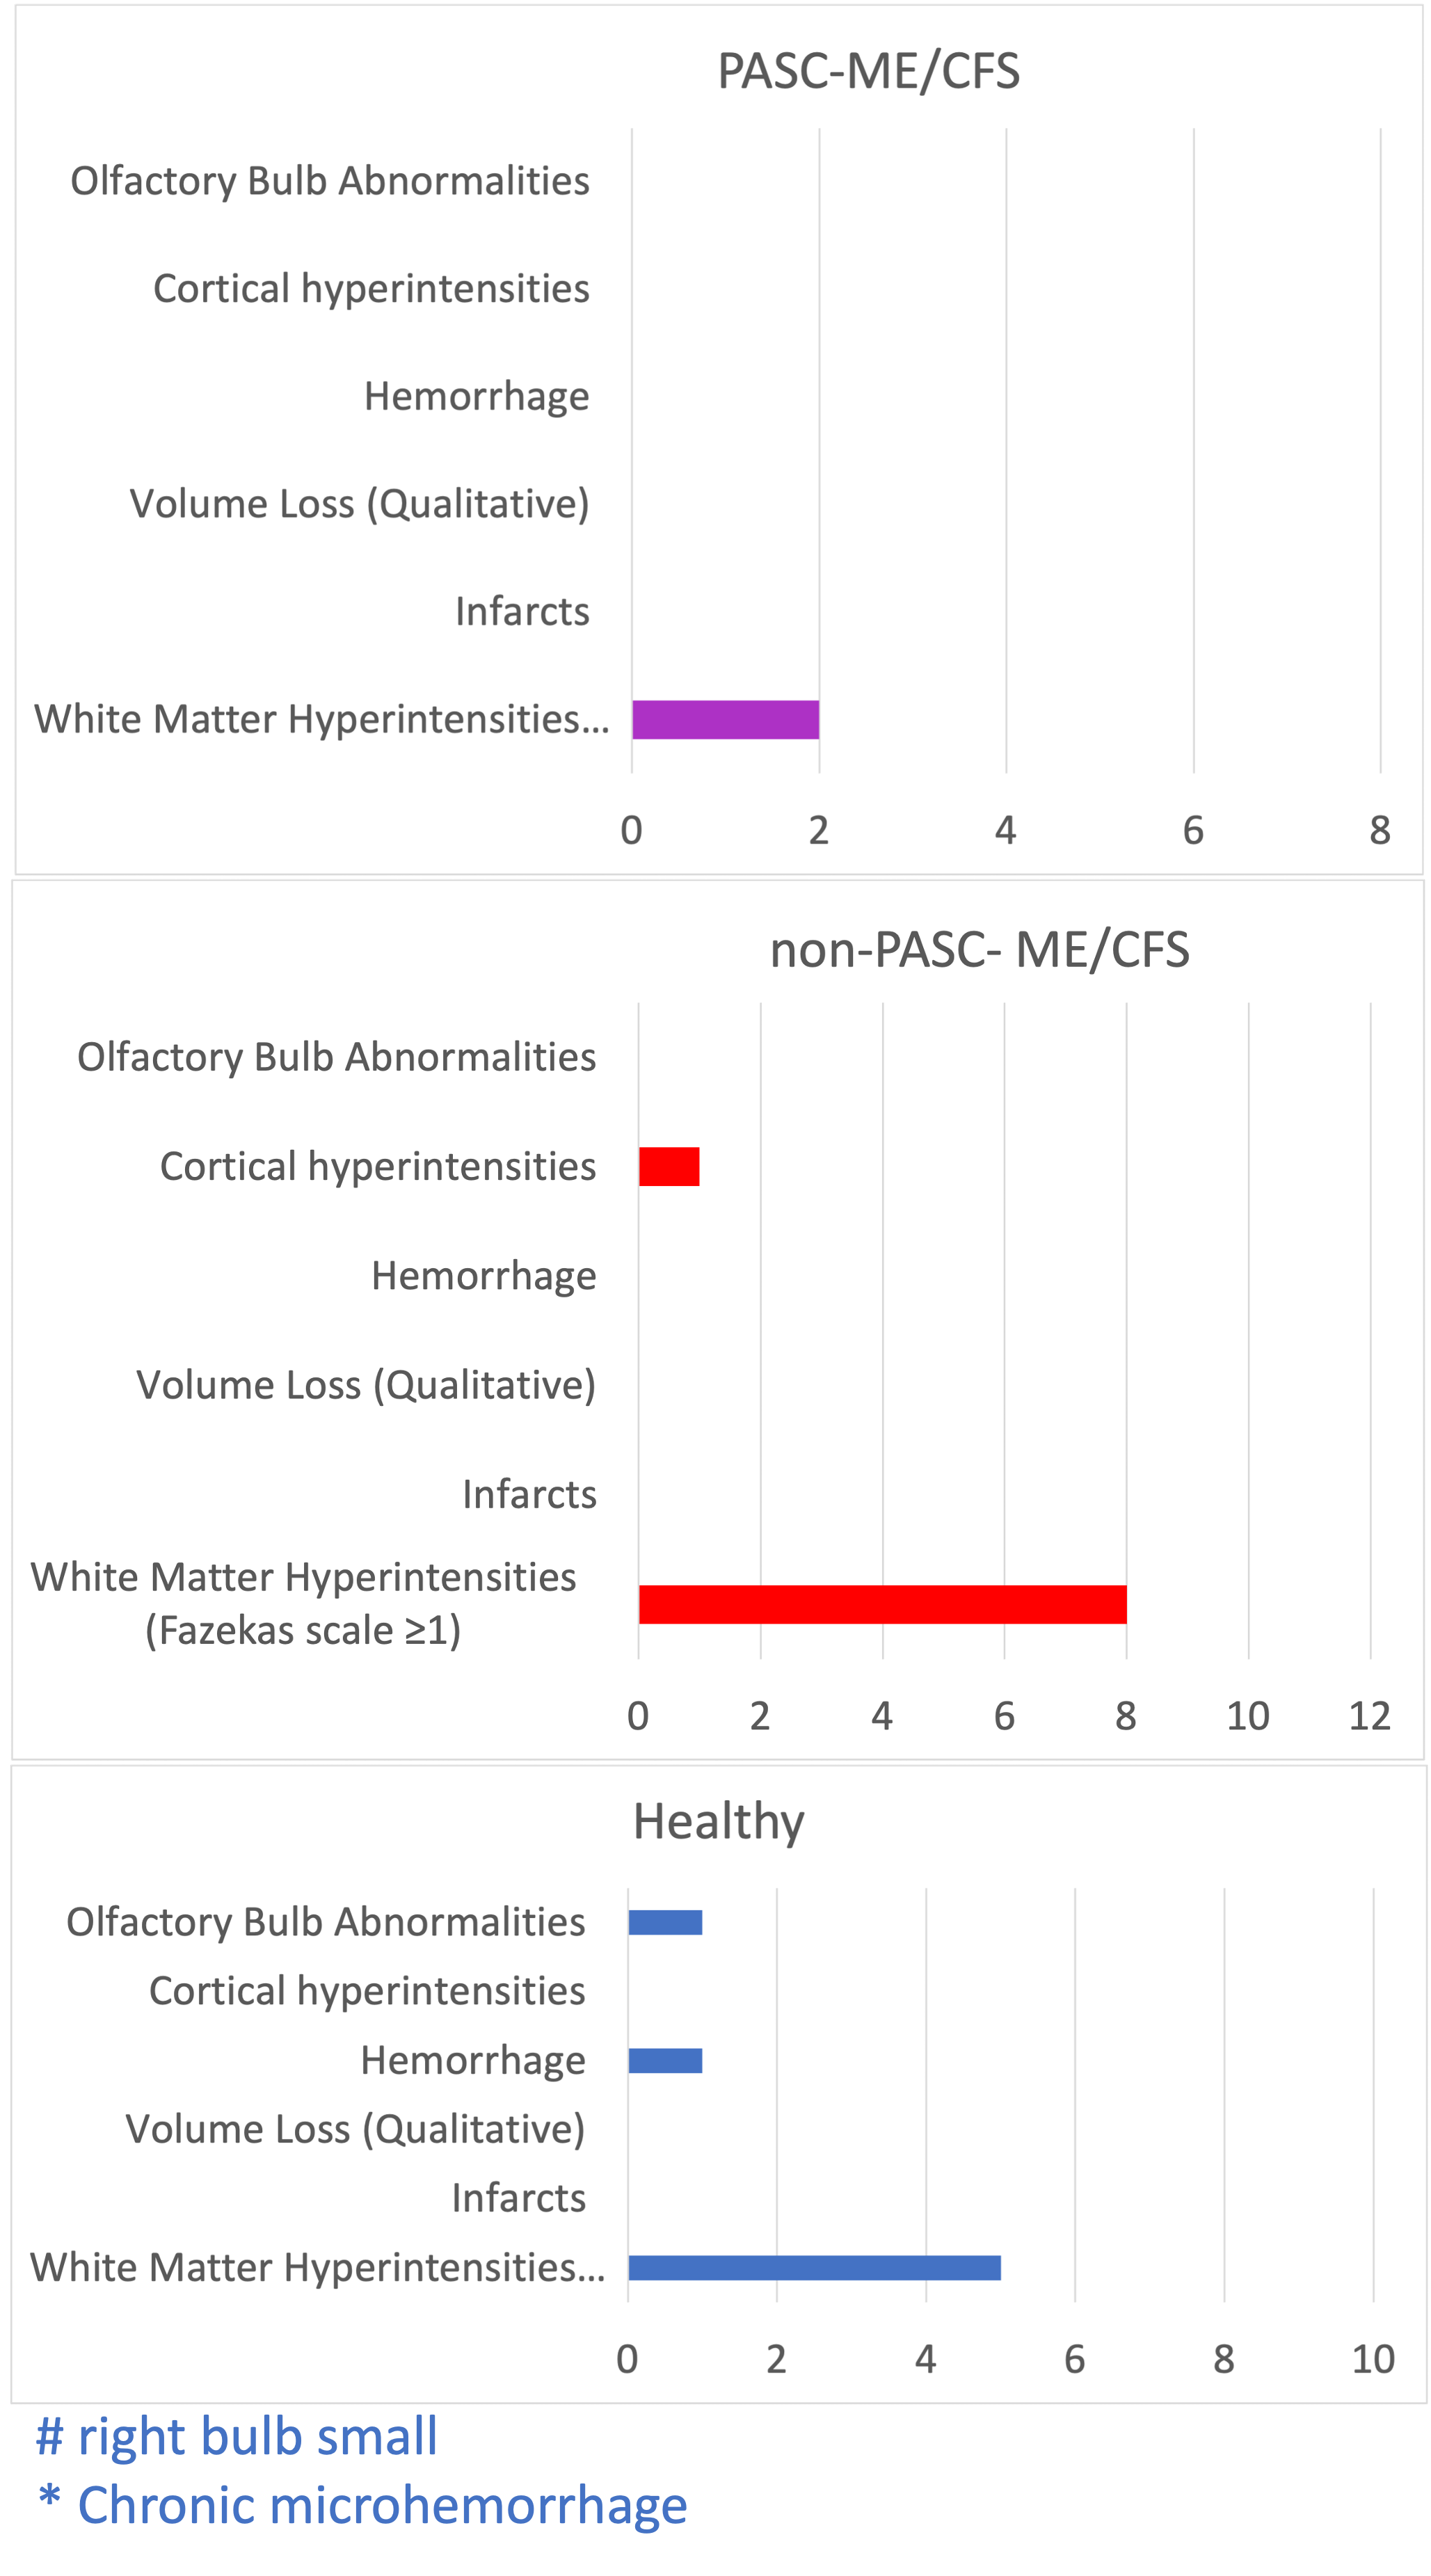
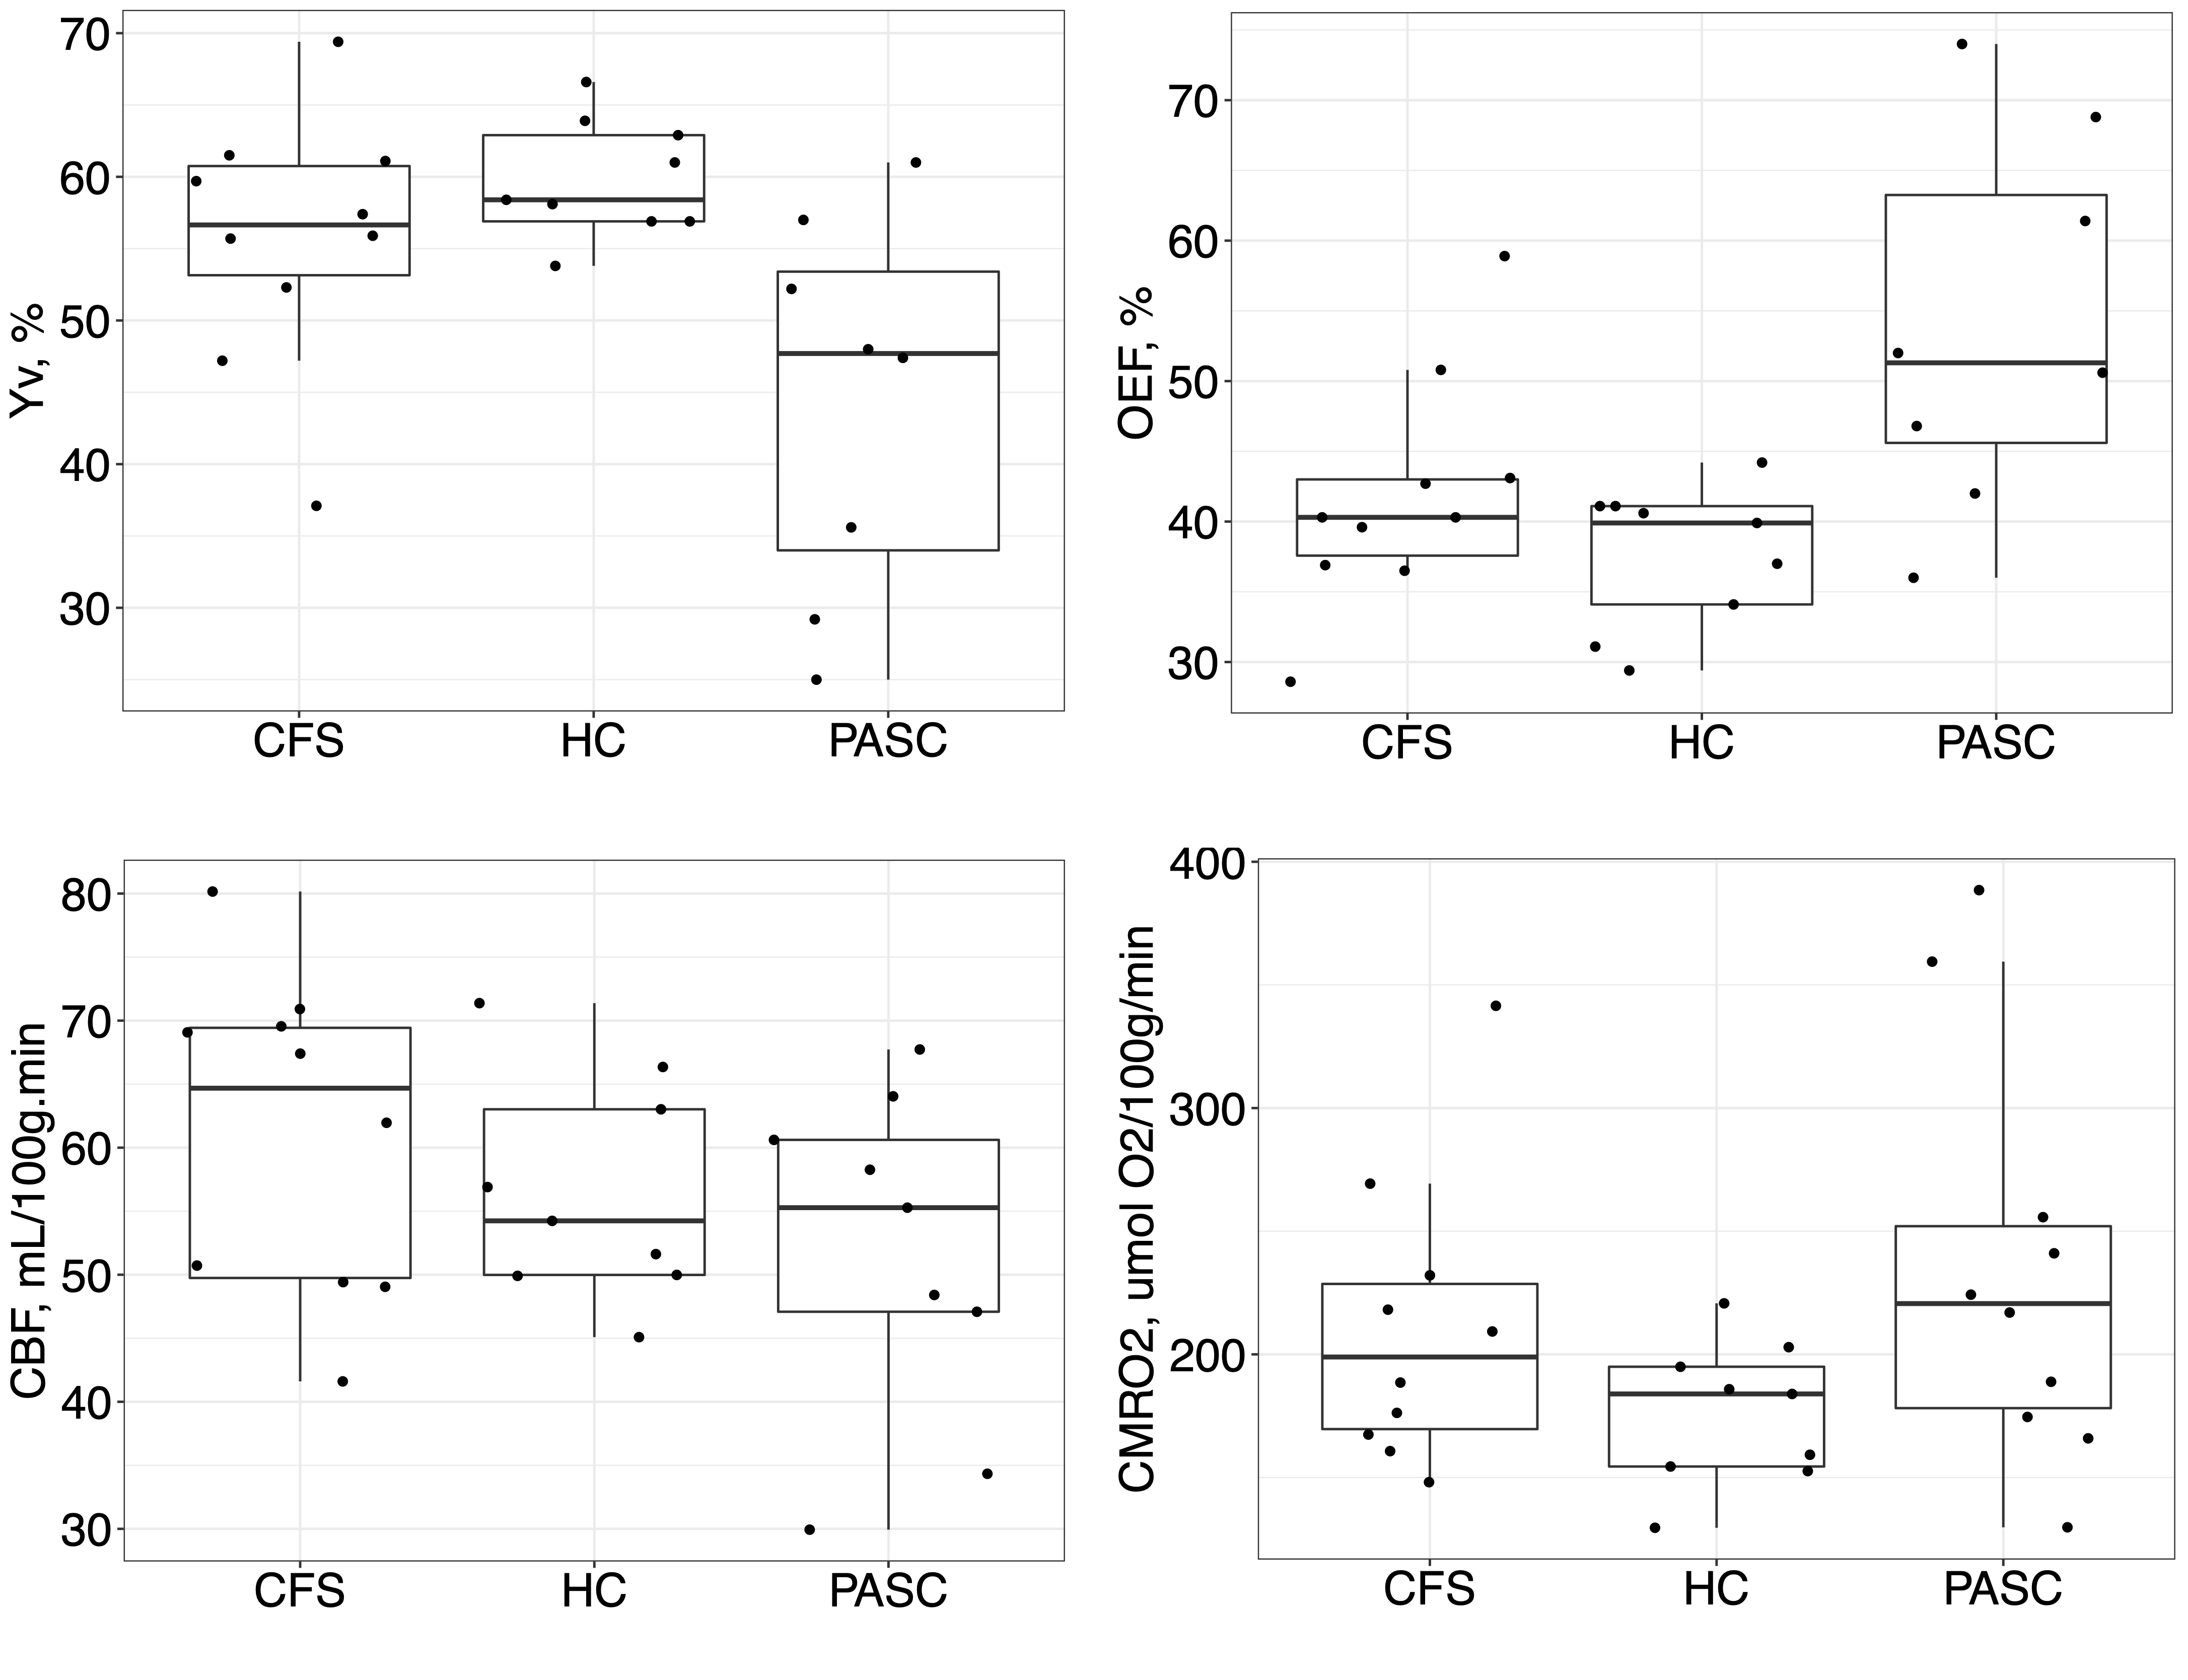
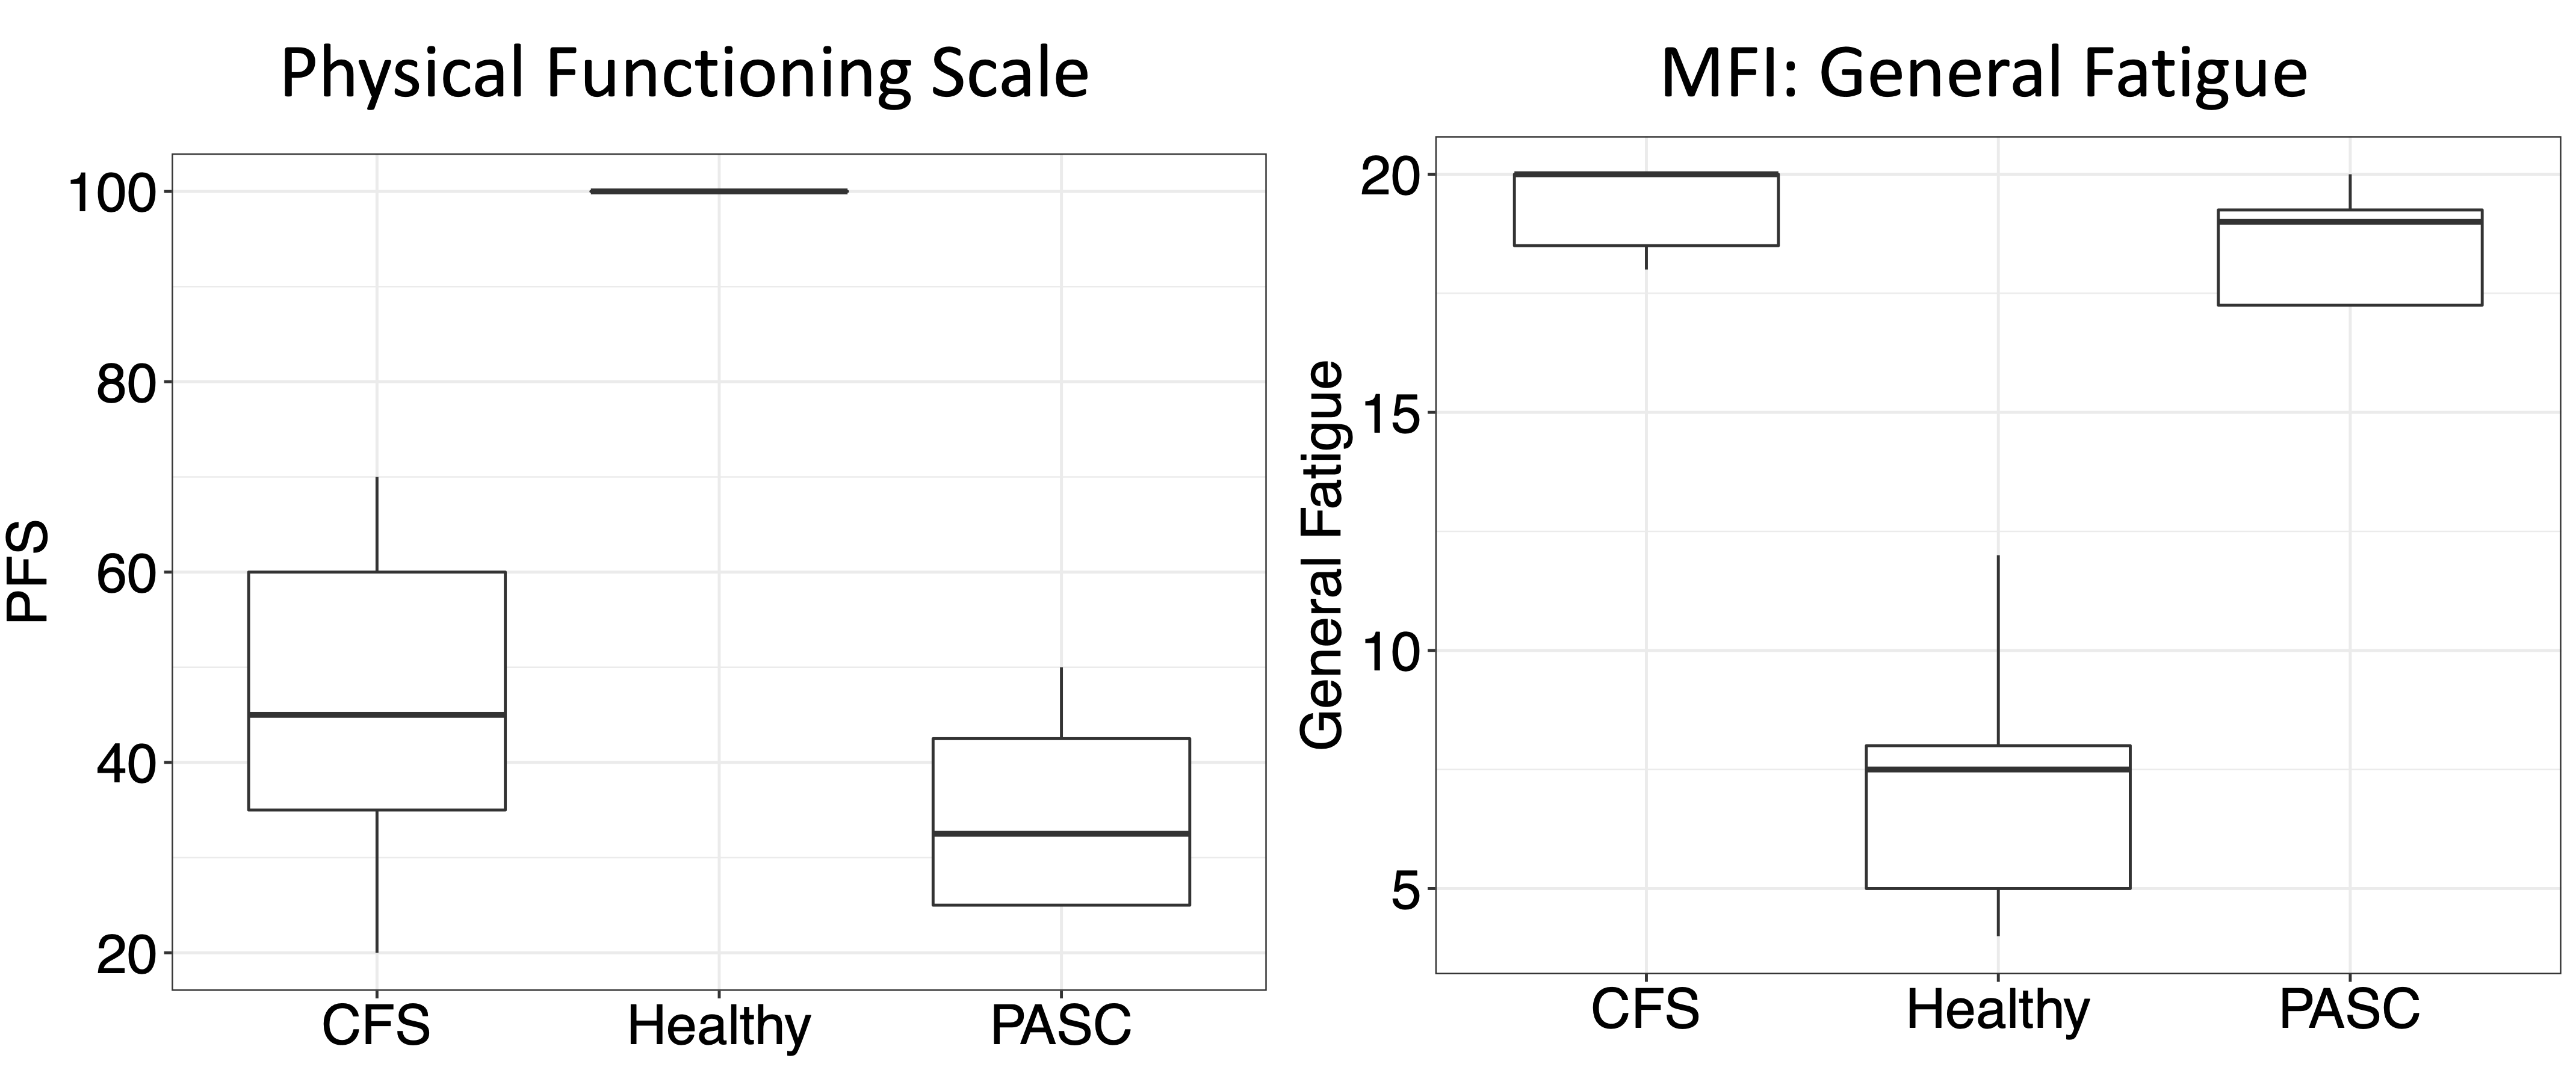
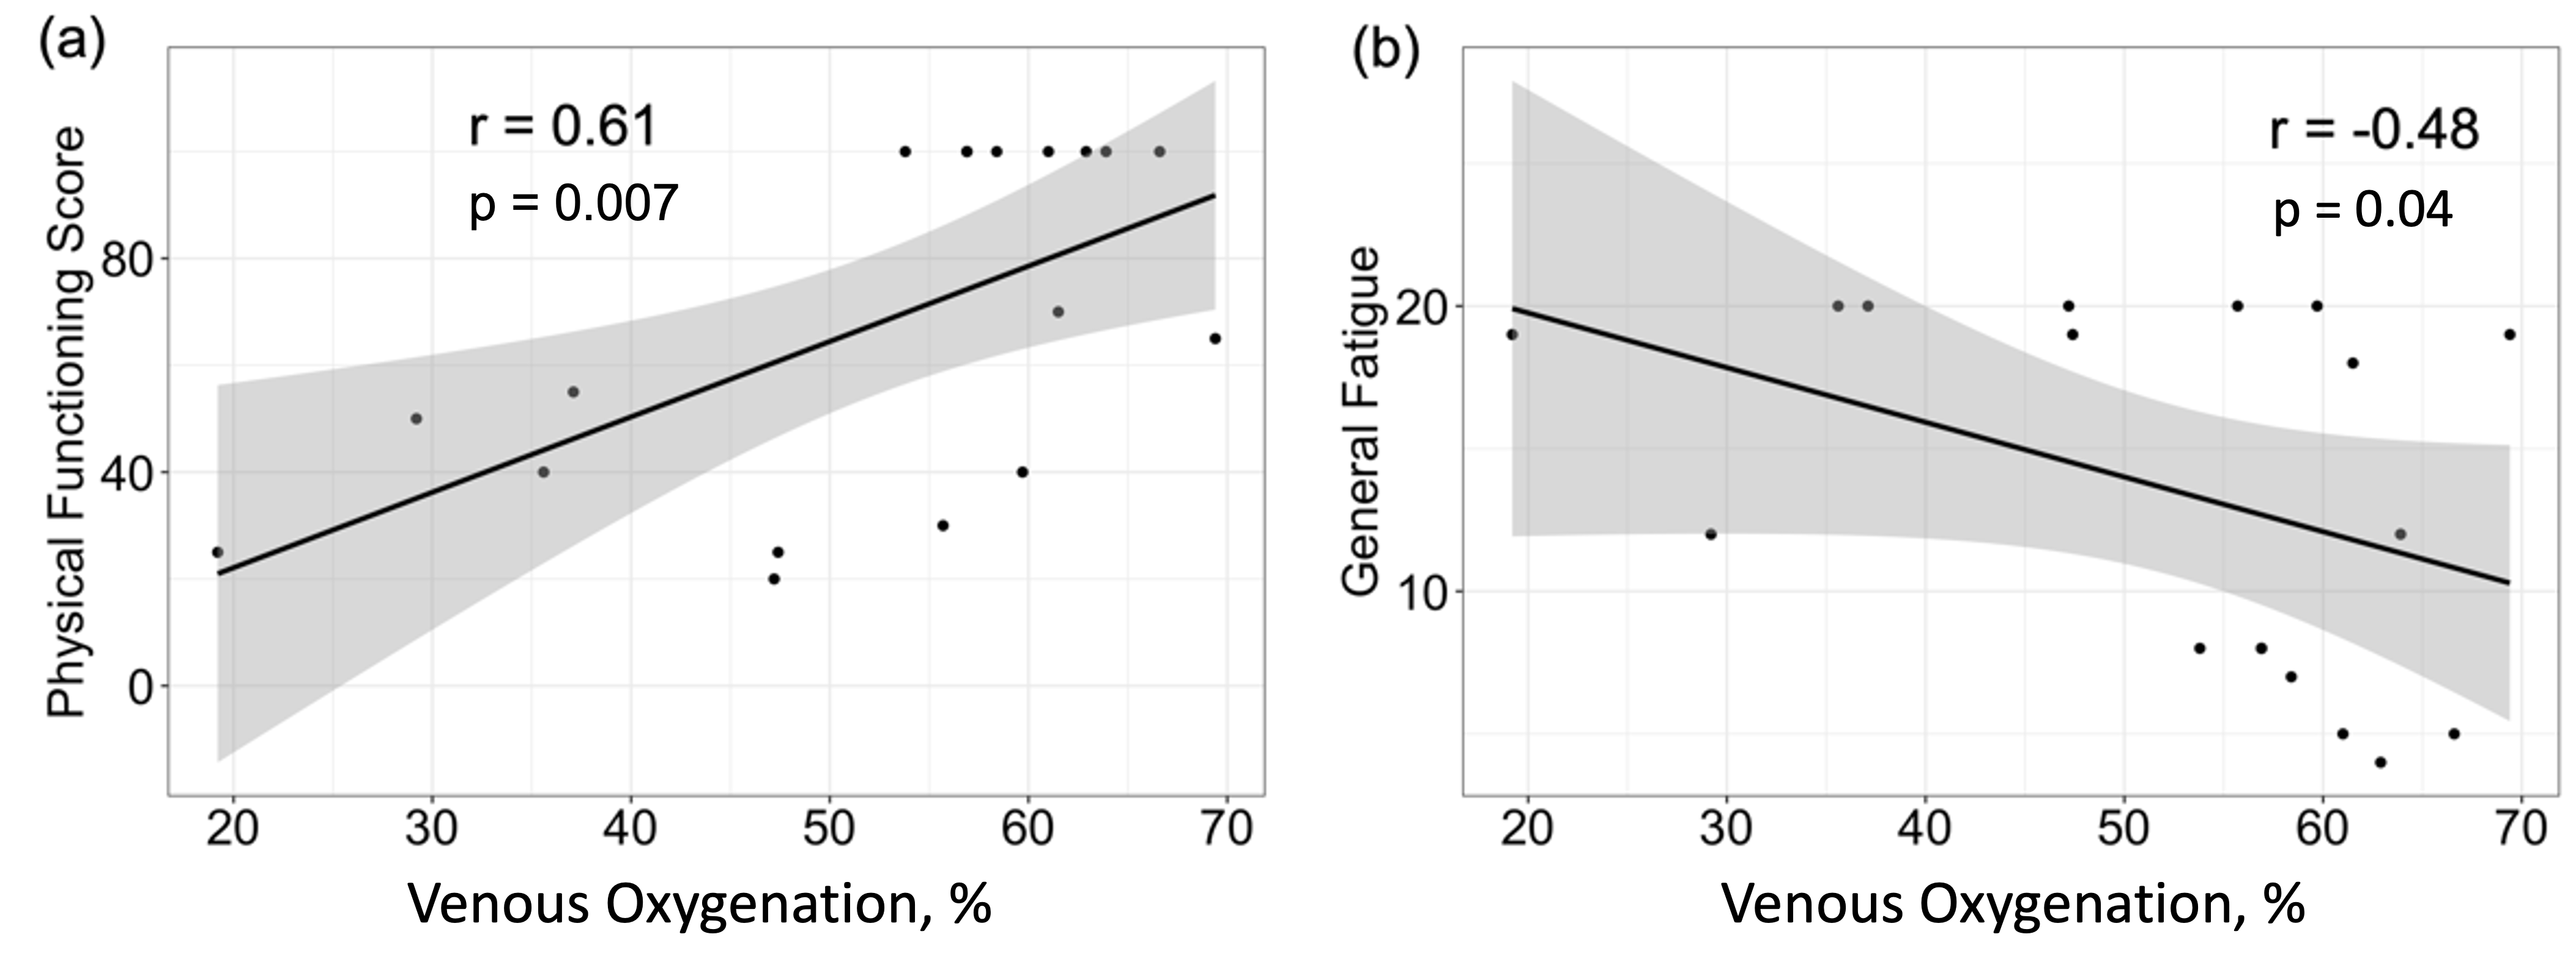
As shown in Fig. 2, white matter hyperintensities were identified in a few participants in each group. This is a common finding, and it is related to aging, hypertension, and other cardiovascular risk factors. Fig. 3 shows the Yv, OEF, CBF, and CMRO2 of the three groups. Pair-wise comparison showed that the PASC group had significant lower Yv than both the healthy control group and the non-PASC CFS group (p = 0.004 and 0.017, respectively). The Yv of of the non-PASC CFS group did not differ significantly from healthy controls. Normal SpO2 was observed in all three groups. Significant elevation of OEF were found in the PASC CFS than other groups. No significance between groups were observed for CBF. Elevated CMRO2 were observed in PASC compared to the HC group with trending significance (p=0.065). Fig. 4 shows the PFS and general fatigue score. Profound difference can be observed between both CFS groups compared to healthy controls, but no significant difference is found between the CFS groups, potentially due to the ceiling effect encountered when using these tests. Plotted in Fig. 5, Spearman correlations revealed that the PFS is strongly correlated with Yv (ρ = 0.61, p = 0.007) and the general fatigue level is inversely correlated with Yv (ρ= -0.48, p = 0.04).Conclusion
Based on the current limited data size, we conclude that structural changes are likely non-specific to ME/CFS with or without PASC. Parameters related to oxygen metabolism, such as Yv and OEF, were significantly different between PASC CFS patients compared to classic CFS patients or healthy controls. Yv was also correlated with physical function and fatigue levels. These results demonstrate that PASC patients are characterized by lower venous oxygenation and higher oxygen extraction fraction in their brain, and this physiological abnormality is due to their elevated brain oxygen consumption rather than due to lower blood supply. Compared to structural changes, metabolism-related parameters may be more sensitive to changes related to long-COVID and CFS disease mechanisms.Acknowledgements
We thank Ms. Sera Saju, Ms. Michelle Blate, Ms. Tiffany Soto and Ms. Rachel (Yijuan) Zhu, whose dedication and efforts in recruiting participants were vital to this study.
Grant support: R21NS129120
References
1. Jason LA, Islam MF, Conroy K, Cotler J, Torres C, Johnson M, Mabie B. COVID-19 symptoms over time: comparing long-haulers to ME/CFS. Fatigue: Biomedicine, Health & Behavior. 2021:1-10.
2. Logue JK, Franko NM, McCulloch DJ, McDonald D, Magedson A, Wolf CR, Chu HY. Sequelae in Adults at 6 Months After COVID-19 Infection. JAMA Network Open. 2021;4:e210830-e210830.
3. Fukuda K, Straus SE, Hickie I, Sharpe MC, Dobbins JG, Komaroff A. The chronic fatigue syndrome: a comprehensive approach to its definition and study. International Chronic Fatigue Syndrome Study Group. Ann Intern Med. 1994;121:953-959.
4. Wong TL, Weitzer DJ. Long COVID and Myalgic Encephalomyelitis/Chronic Fatigue Syndrome (ME/CFS)-A Systemic Review and Comparison of Clinical Presentation and Symptomatology. Medicina (Kaunas). 2021;57.
5. Lu H, Xu F, Grgac K, Liu P, Qin Q, van Zijl P. Calibration and validation of TRUST MRI for the estimation of cerebral blood oxygenation. Magn Reson Med. 2012;67:42-49.
6. Xu F, Ge Y, Lu H. Noninvasive quantification of whole-brain cerebral metabolic rate of oxygen (CMRO2) by MRI. Magn Reson Med. 2009;62:141-148.
7. Lu H, Ge Y. Quantitative evaluation of oxygenation in venous vessels using T2-Relaxation-Under-Spin-Tagging MRI. Magnetic resonance in medicine : official journal of the Society of Magnetic Resonance in Medicine / Society of Magnetic Resonance in Medicine. 2008;60:357-363.
8. Kety SS, Schmidt CF. The effects of altered arterial tensions of carbon dioxide and oxygen on cerebral blood flow and cerebral oxygen consumption of normal young men. The Journal of clinical investigation. 1948;27:484-492.
Figures