2073
Changes in Brain Metabolites in People with HIV Before and After ART Treatment Using Whole-Brain MRSI1University of Miami, Miami, FL, United States, 22Postgraduate Institute for Medical Education & Research, Chandigarh, India, 3Postgraduate Institute of Medical Education and Research, Chandigarh, India
Synopsis
Keywords: Infectious Disease, Spectroscopy, HIV, metabolites
Motivation: Chronic HIV infection is associated with widespread brain metabolite imbalance. However, few studies attempted to quantitate changes in brain metabolites in people with HIV (PWH) before and after initiating antiretroviral therapy (ART) treatment.
Goal(s): the aim of this study is to evaluate changes in brain metabolites in PWH, before and after initiating ART, at the whole-brain level using MRSI spectroscopic imaging (MRSI).
Approach: In this longitudinal study, changes in MRSI derived metabolite are evaluated before and after ART treatment using an atlas-based approach.
Results: Our results showed persistent neuro-inflammation in HIV subjects post-ART despite maintaining viral suppression.
Impact: This study advocates the need for continued monitoring of their brain health of PWH even after starting ART.
Introduction
Chronic HIV infection is associated with widespread brain metabolite imbalance. Results have shown higher choline (Cho) and myo-inositol (m-Ins) as evidence of inflammation and glial activation, lower N-acetyl aspartate (NAA) as evidence of decrease neuronal viability,1 and increased glutamate+glutamine (Glx) associated with HIV infection,2 although some also reported reduced Glx.3 However, most studies investigating brain metabolite in HIV used single-voxel MRS,4 and to our best knowledge, none have attempted to map these metabolite changes at the whole-brain. In addition, few attempted to quantitate changes in brain metabolites in people with HIV (PWH) before and after initiating antiretroviral therapy (ART) treatment, which also used single-voxel MRS.5 Therefore, the aim of this study is to evaluate changes in brain metabolites in PWH, before and after initiating ART, at the whole-brain level using MRSI spectroscopic imaging (MRSI).Methods
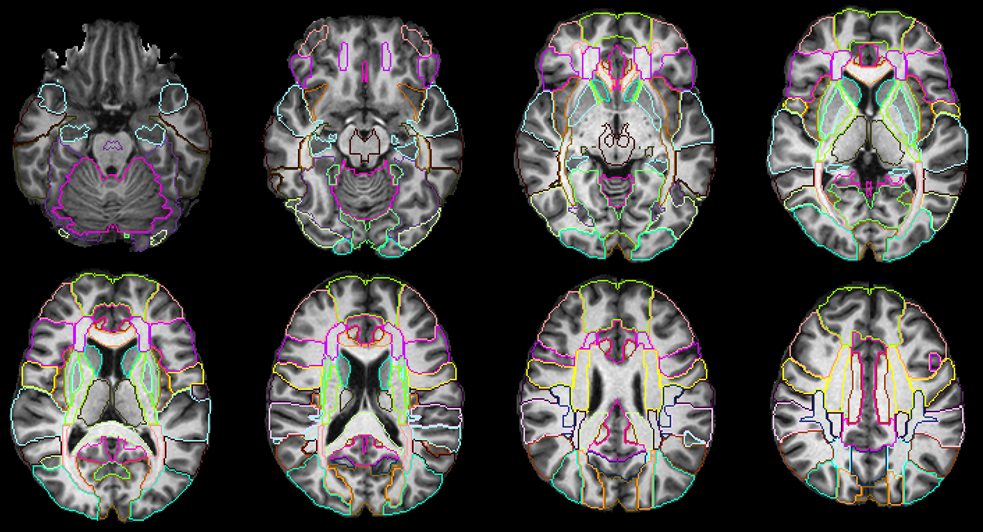
Data Acquisition: MRSI data were collected on a 3T Siemens scanner at the Postgraduate Institute of Medical Education & Research from 19 untreated HIV+ subjects(HIV+ART-; 12/7 male/female; age: 32.2±6.9) and 19 age-matched healthy controls (12/7 male/female; age: 32.1±6.8). All HIV subjects started ART at baseline and a performed second MRI at the same facility and scanner (HIV+ART+; 12/7 male/female; age: 35.1±6.9). The duration of ART treatment varied between 7-54 months (3 years on average). The protocol included: (a) T1-weighted MPRAGE image (TR/TE: 2300/2.42 ms; 1.0×1.0×1.0 mm; 160 axial slices); (b) whole-brain MRSI sequence with a 3-dimensional EPSI spin-echo sequence (TR/TE/TI = 1,551/17.6/198 ms, 50×50 matrix size, 18 slices, FOV = 280×280×180 mm).Processing: MRSI data were processed using the Metabolite Imaging and Data Analysis System (MIDAS) software.6,7 MIDAS’s Map-INTegrated (MINT) module integrates spectra from voxels within an atlas defined ROI to create a single integrated spectrum and perform spectral fitting. This results in higher SNR and more accurate fitting compared to individual voxel fitting. MINT includes filters for rejecting poor-quality data on a voxel-by-voxel basis. We used a modified JHU-MNI-SS-type2 atlas8 with 107 delineated ROIs covering the whole brain from which we obtain metabolite values. Spectral results were corrected for CSF partial volumes obtained from T1 images and normalized to the non-suppressed water reference data from the same ROI. ROIs with less than 10 voxels were removed. Finally, by merging data from contralateral brain ROIs we obtained data from 38 unique ROIs (Figure 1).
Analysis: Comparisons of metabolite levels-by-ROI were performed between the control, HIV+ART- and HIV+ART+ groups using ANCOVA (controlled for age). We also performed a regression analysis for HIV subjects only to evaluate the changes in metabolite with respect to changes in clinical measures, CD4 count and viral load (VL), and to ART duration. Statistical tests were performed using R (significance at p<0.05, FDR corrected).
Results
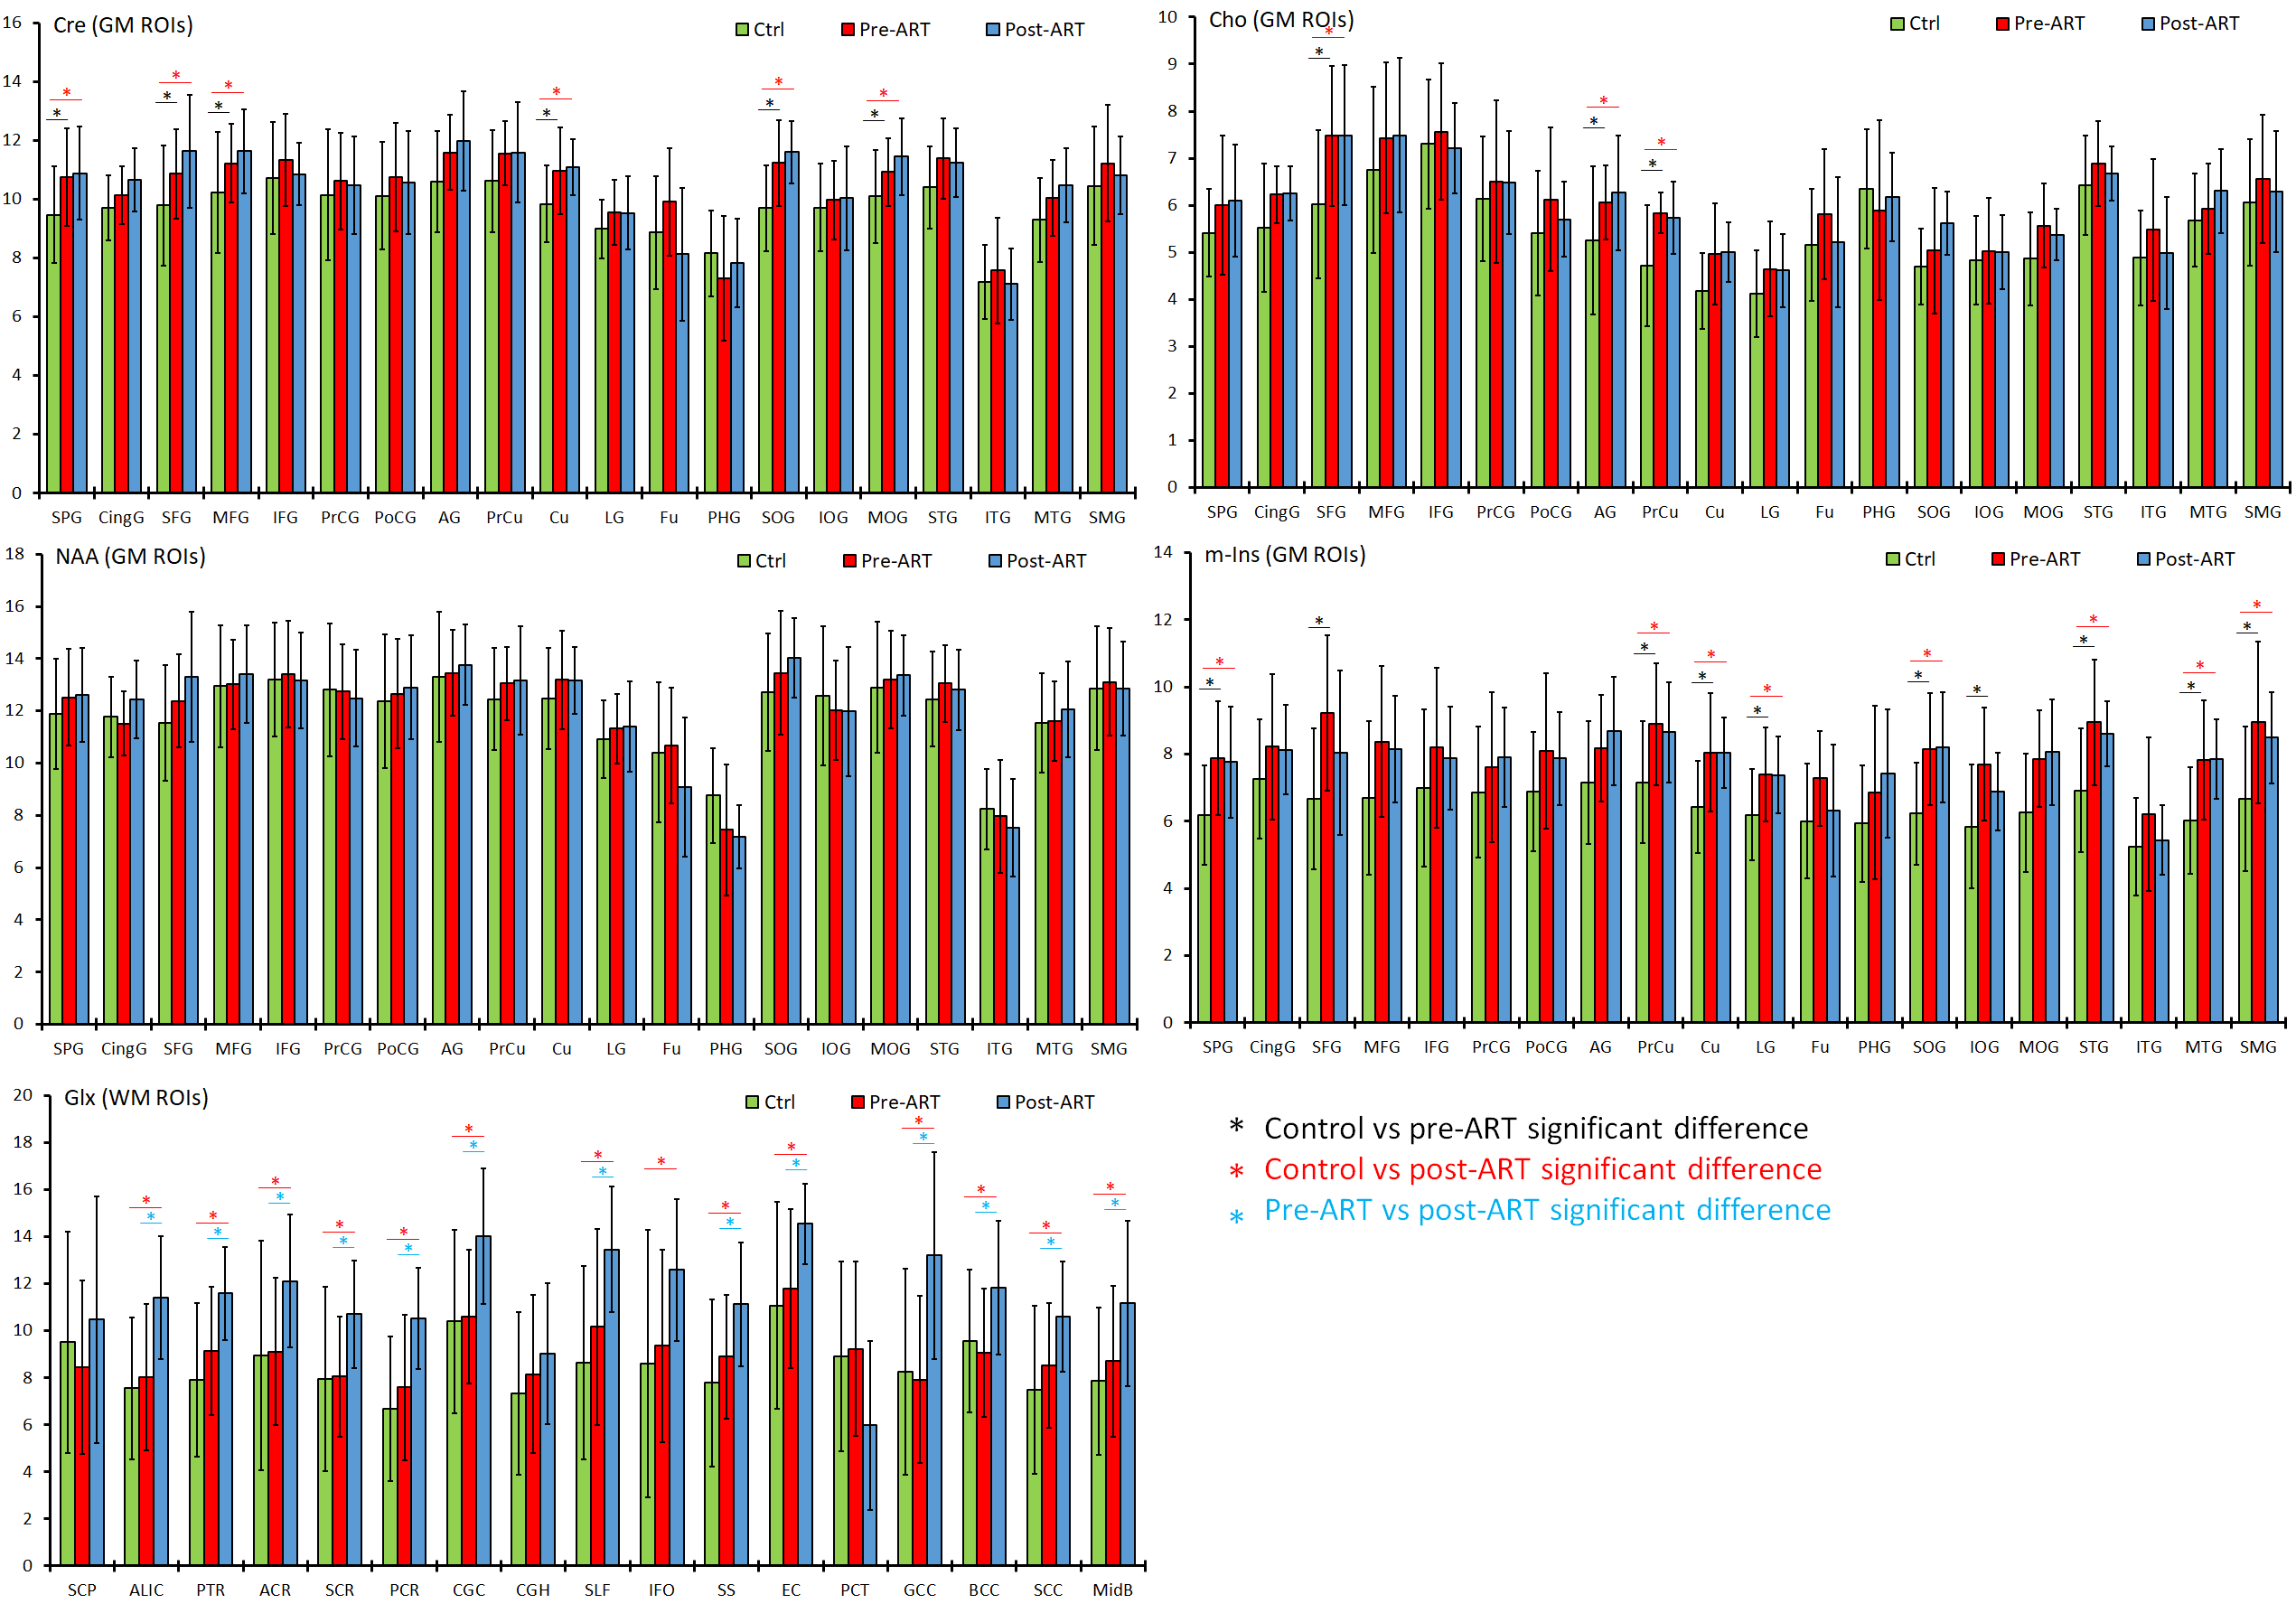
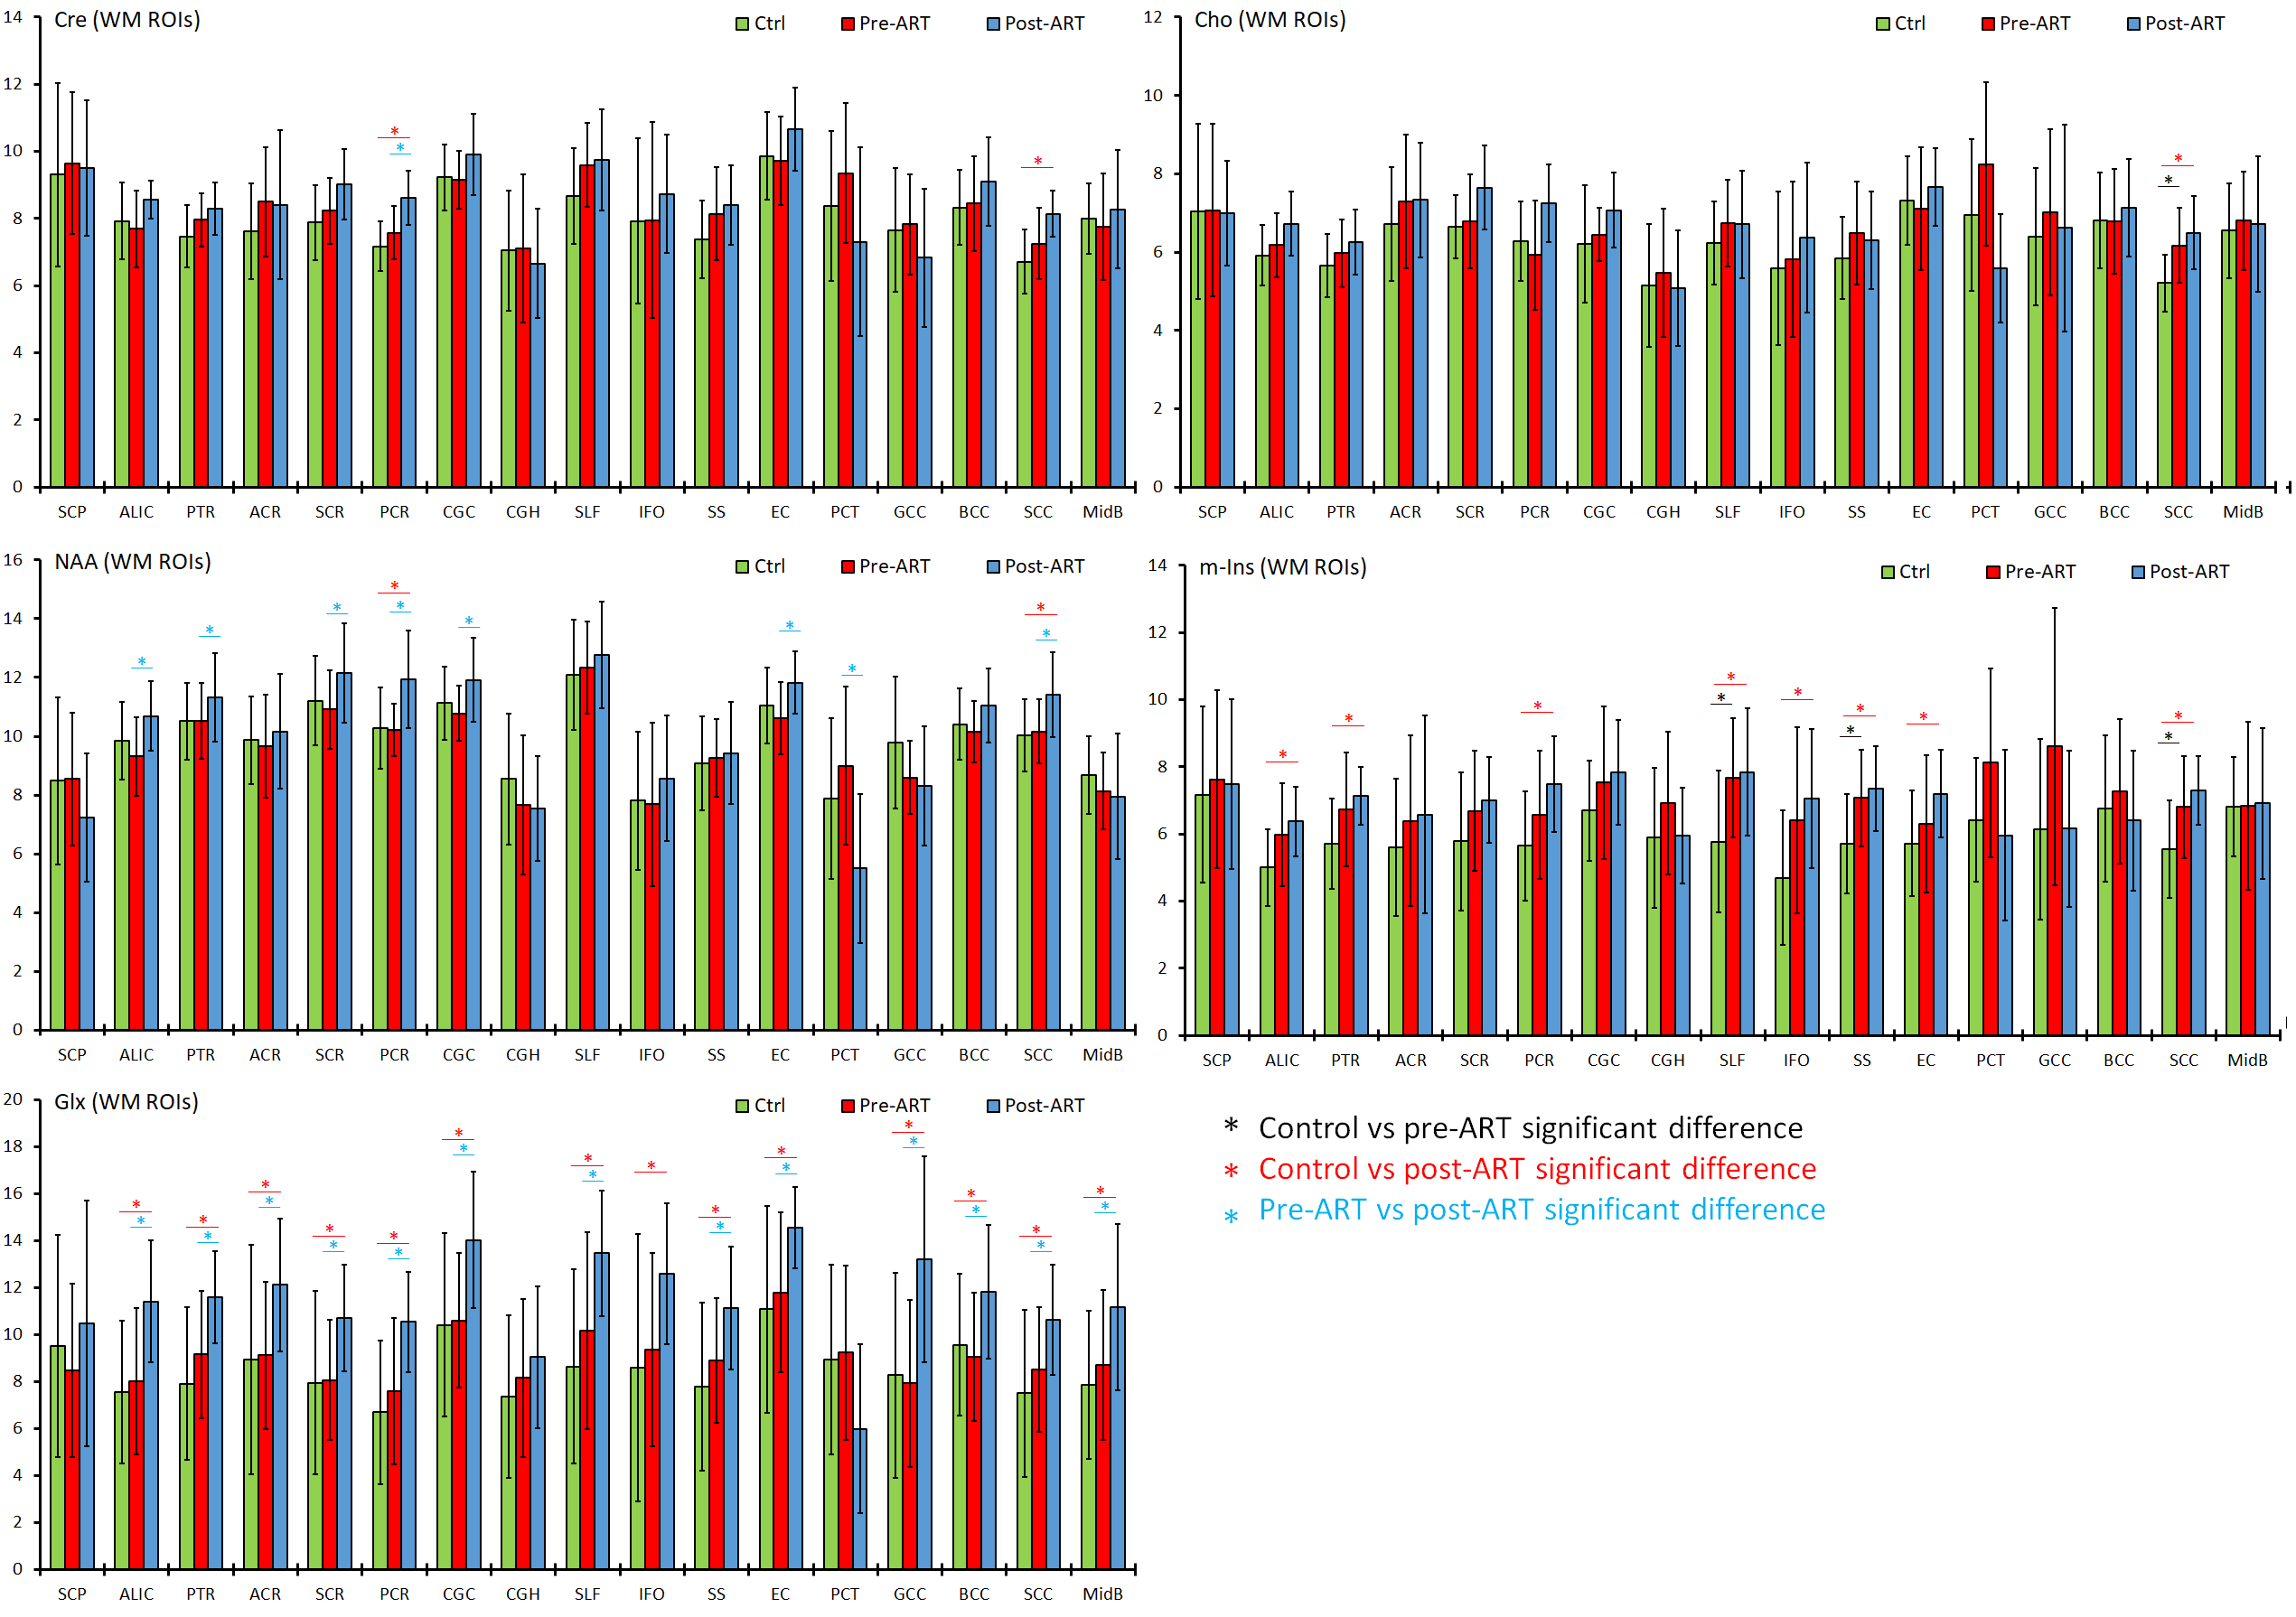
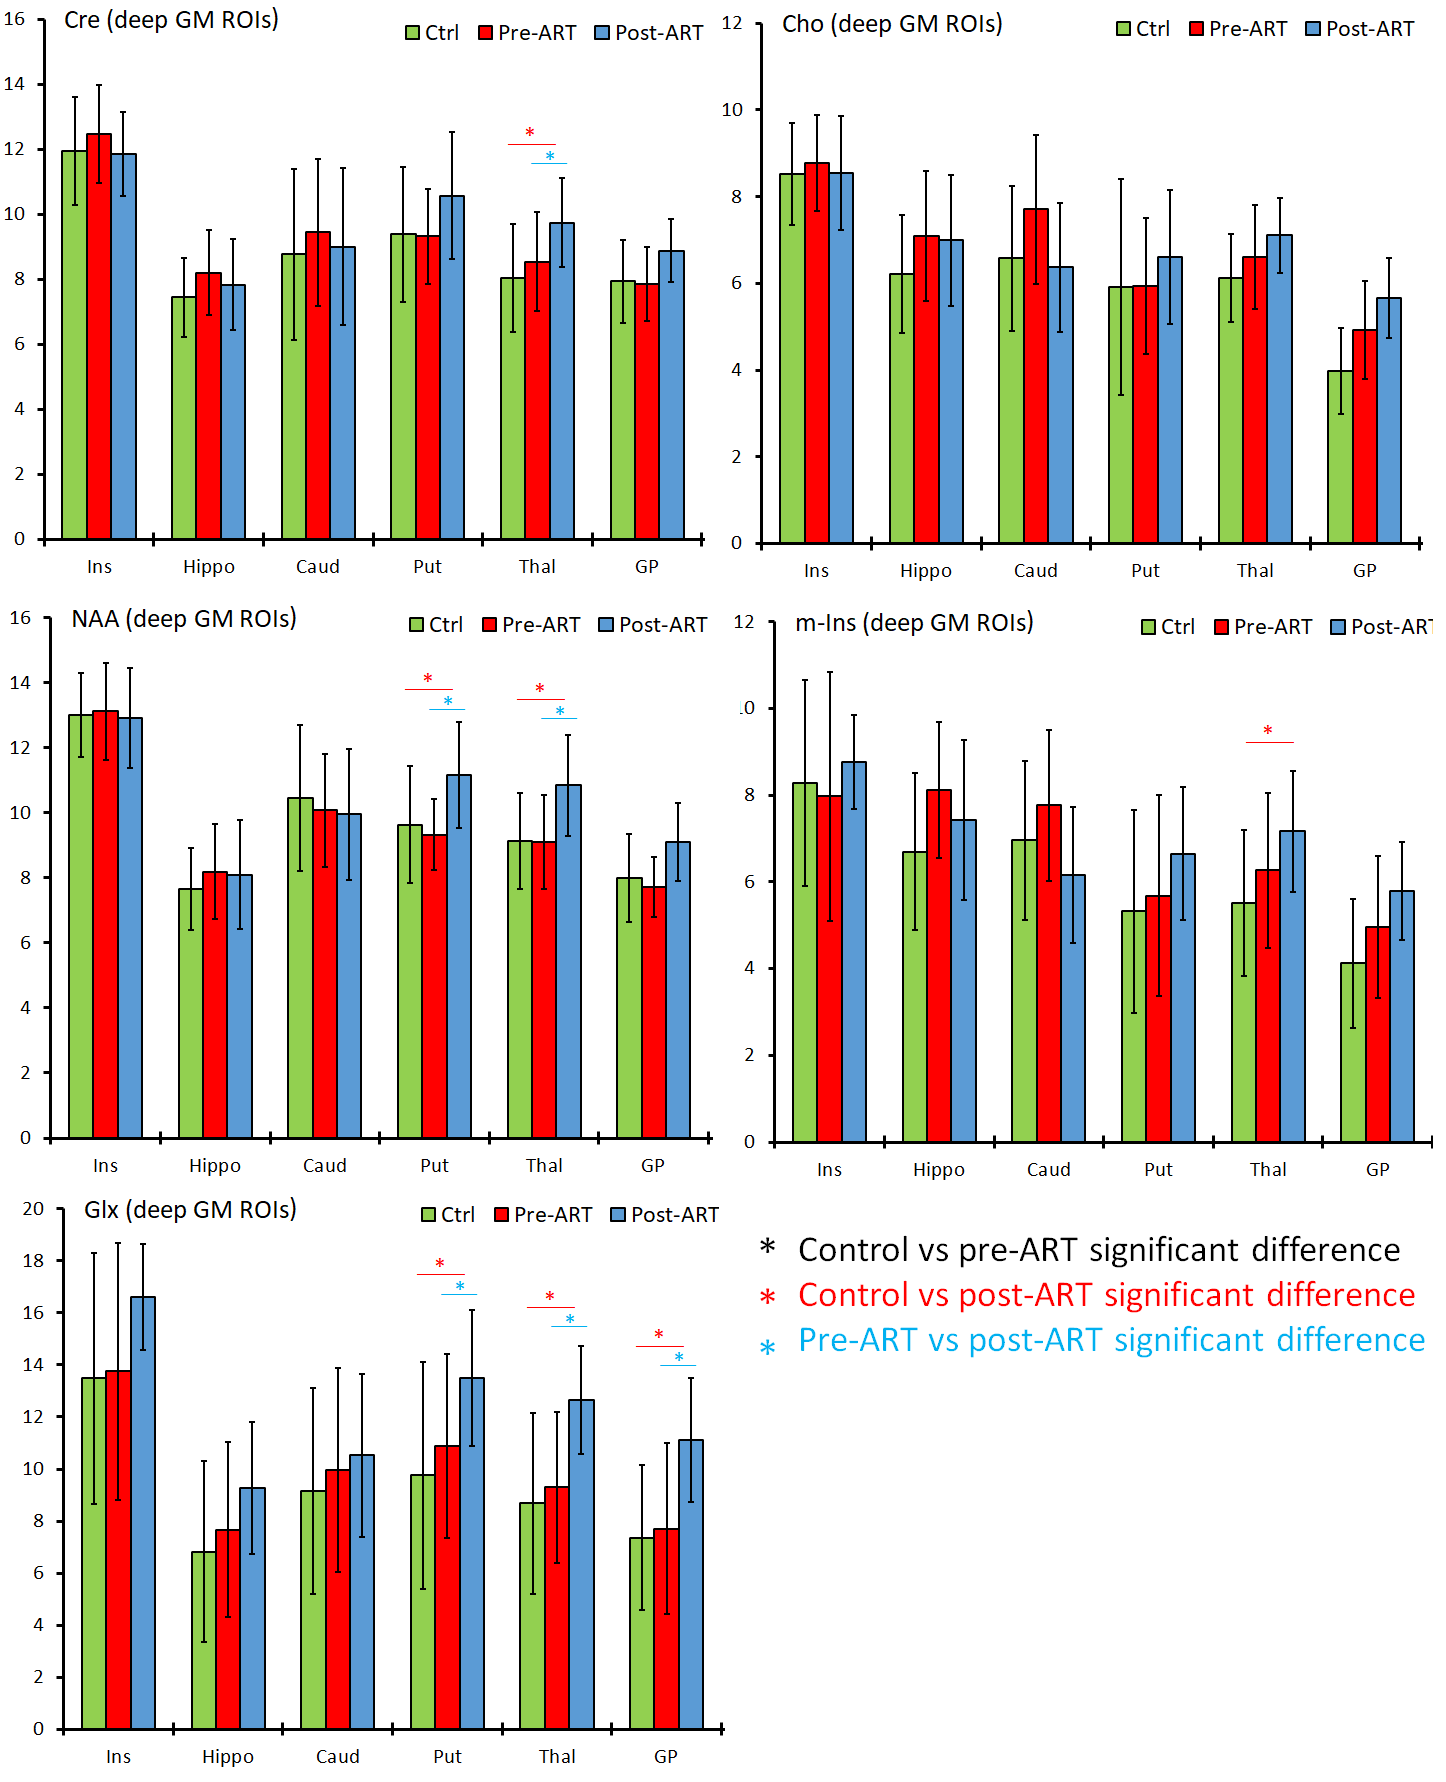
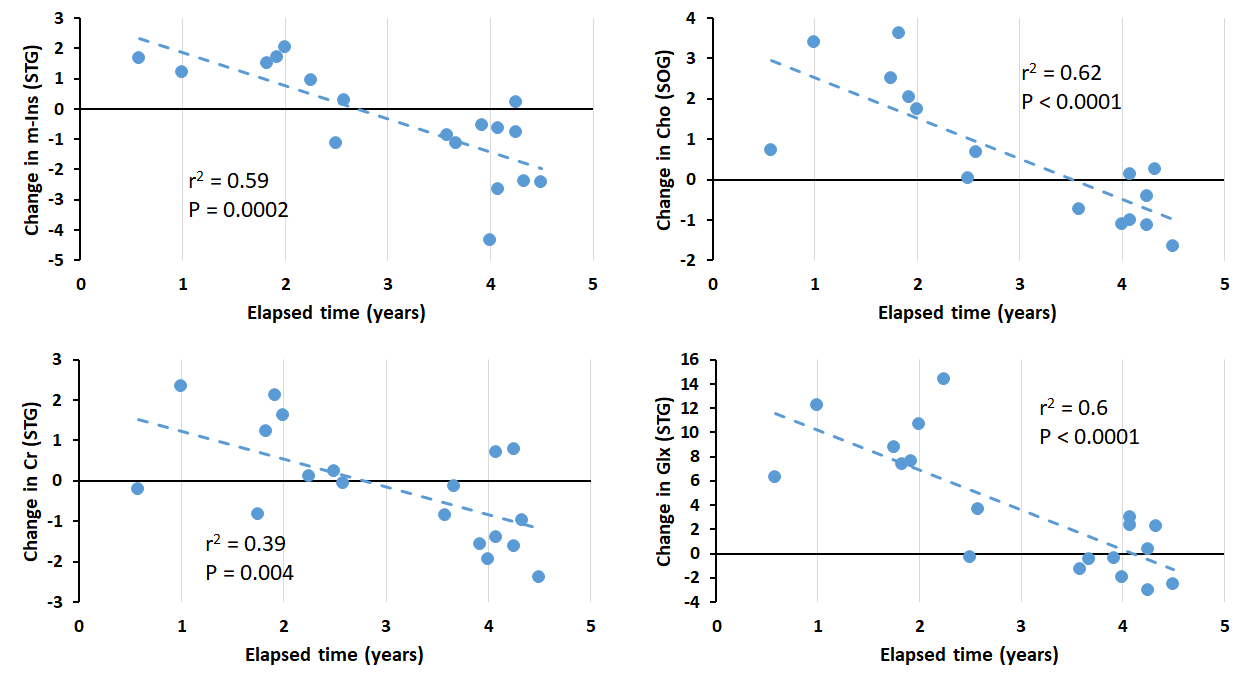
HIV subjects maintained ART adherence and were virally suppressed (VL<200) at follow-up with a significant improvement in CD4. In cortical grey matter (GM) ROIs, levels of Cr, Cho and m-Ins were elevated at baseline for HIV+ART- group and continued to increase after ART treatment (Figure 2). No significant changes in NAA were observed. Conversely, NAA in white matter (WM) ROIs increased for the HIV+ART+ group compared to both controls and to HIV+ART-, and m-Ins concentrations were elevated both at baseline and follow-up for HIV subjects (Figure 3). The same trend was observed in deep GM regions particularly in the thalamus, putamen and globus pallidus (Figure 4). Changes in Glx were the same across all tissue types such that HIV+ART- had comparable Glx levels to controls, followed by a significant increase after treatment. Regression analyses were not significant with changes in VL and CD4, but several regions showed that m-Ins, Cho, Cr, and Glx decrease the longer patients were on ART (Figure 5).Discussion
Our results showed that HIV subject had persistently elevated neuro-inflammation and microglial proliferation (m-Ins, Cho) post-ART despite maintaining viral suppression, particularly in GM ROIs. There was also an increase in NAA in WM post-ART, reflecting an increased neuronal viability. Elevated Glx in HIV subjects compared to baseline and controls throughout the brain may signal excitotoxicity due to ART treatment. Although markers of inflammation remained high after ART, the regression results show that concentration of m-Ins, Cho, Cr and Glx decrease the longer subjects are on ART. This show that brain metabolic abnormalities in PWH will take time to return to levels comparable to healthy controls after initiating ART.Conclusion
Our whole-brain MRSI approach using ROI-based analysis showed that metabolite changes in untreated PWH may not directly normalize after starting ART, although increases in WM NAA may indicate a normalization of axonal functions.Acknowledgements
Funding from NIH grant, R01 NS094043.References
1. Chelala L, O’Connor EE, Barker PB et al. Meta-analysis of brain metabolite differences in HIV infection. Neuroimage Clin. 2020;28:102436.
2. Bairwa D, Kumar V, Vyas S, et al. Case control study: magnetic resonance spectroscopy of brain in HIV infected patients. BMC Neurol. 2016;16(99).
3. Ernst T, Jiang CS, Nakama H, et al. Lower brain glutamate is associated with cognitive deficits in HIV patients: A new mechanism for HIV-associated neurocognitive disorder. J Magn Reson Imaging. 2010;32(5):1045–53.
4. Boban J, Thurnher MM, Brkic S, et al. Neurometabolic Remodeling in Chronic Hiv Infection: a Five-Year Follow-up Multi-Voxel Mrs Study. Scientific Reports. 2019;9:19799.
5. Young AC, Yiannoutsos CT, Hegde M, et al. Cerebral metabolite changes prior to and after antiretroviral therapy in primary HIV infection. Neurology. 2014;83(18):1592-1600.
6. Maudsley AA, Darkazanli A, Alger JR, et al. Comprehensive processing, display and analysis for in vivo MR spectroscopic imaging. NMR in biomedicine. 2006;19(4):492-503.
7. Maudsley AA, Domenig C, Govind V, et al. Mapping of brain metabolite distributions by volumetric proton MR spectroscopic imaging (MRSI). Magnetic resonance in medicine: official journal of the Society of Magnetic Resonance in Medicine/Society of Magnetic Resonance in Medicine. 2009;61(3):548-559.
8. Oishi K, Faria A, Jiang H, et al. Atlas-based whole brain white matter analysis using large deformation diffeomorphic metric mapping: application to normal elderly and Alzheimer's disease participants. Neuroimage. 2009;46(2):486-99.
Figures