2070
Separation of vascular and nonvascular components in the white matter lesion in cerebral small vessel disease1Medical Imaging, National Taiwan University Hospital, Taipei, Taiwan, 2Neurology, National Taiwan University Hospital, Taipei, Taiwan, 3Institute of Medical Device and Imaging, National Taiwan University, Taipei, Taiwan
Synopsis
Keywords: White Matter, White Matter
Motivation: White matter lesion (WML) is a neuroimaging signature of cerebral small vessel disease (CSVD), commonly comprising both vascular and nonvascular components for which assessment methods remain to be developed.
Goal(s): To investigate the feasibility of using multimodal MR imaging to separate vascular and nonvascular components in WML.
Approach: Twelve patients with CSVD were prospectively included and underwent 3T MR imaging. Magnetization transfer ratio (MTR) was derived from magnetization transfer imaging. Apparent diffusion coefficient (ADC) and fractional anisotropy (FA) were derived from diffusion tensor imaging.
Results: MTR was found to correlate with ADC and FA differently in WML as compared to normal-appearing white matter.
Impact: Appropriate separation of vascular/nonvascular components in WML can help differential diagnosis and treatment formation of CSVD. The sensitivity of combined MTR/FA/ADC can be further verified by comparing CSVD with other neurological diseases that present WML but have nonvascular pathogenesis.
Introduction
White matter lesion (WML) is a common neuroradiological finding in the elderly and has been considered a signature of cerebral small vessel disease (CSVD) (1). Although still unclear, the pathogenesis of WML has been assumed to be primarily vascular (2) but also have nonvascular components such as myelin damage and gliosis (3). The formulation of medical management may benefit from proper separation of vascular and nonvascular components for which there are currently no differential diagnostics in clinical settings. Here, we proposed combining magnetization transfer imaging and diffusion imaging to assess the nonvascular effect in the WML in CSVD.Materials and Methods
Twelve patients (age = 56-72 years) with CSVD were prospectively included in this study approved by the institutional review board, and all provided written informed consent. MR exams were performed on a 3T clinical system, including three-dimensional T1-weighted gradient echo (T1W), T2-weighted turbo spin echo (T2W), fluid-attenuated inversion recovery (FLAIR), magnetization transfer imaging, and diffusion tensor imaging (b-value = 0 and 1000 s/mm2; diffusion encoding along 20 directions).The following parametric maps were generated: magnetization transfer rate (MTR), apparent diffusion coefficient (ADC), and fractional anisotropy (FA). All parametric maps were coregistered to T1W. Two regions of interest (ROIs) were created: WML was extracted by using the lesion prediction algorithm (4); normal appearing white matter (NAWM) was semi-automatically determined (within the T1W-derived white matter mask with no visually discernible abnormalities in diffusion-weighed images, T2W and T1W). The mean and distribution of MTR, FA, and ADC were compared between WML and NAWM. For each subject, the association between the parameters was assessed in terms of the Pearson’s correlation coefficient which was z-transformed for group comparisons. A p-value below 0.05 was considered to be statistical significant after the Benjamini-Hochberg correction for multiple comparisons.
Results
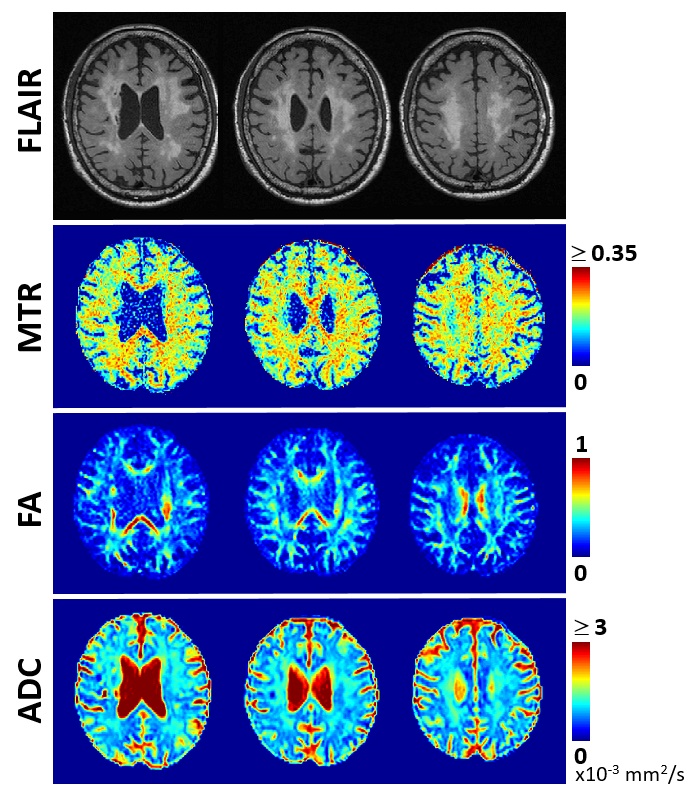
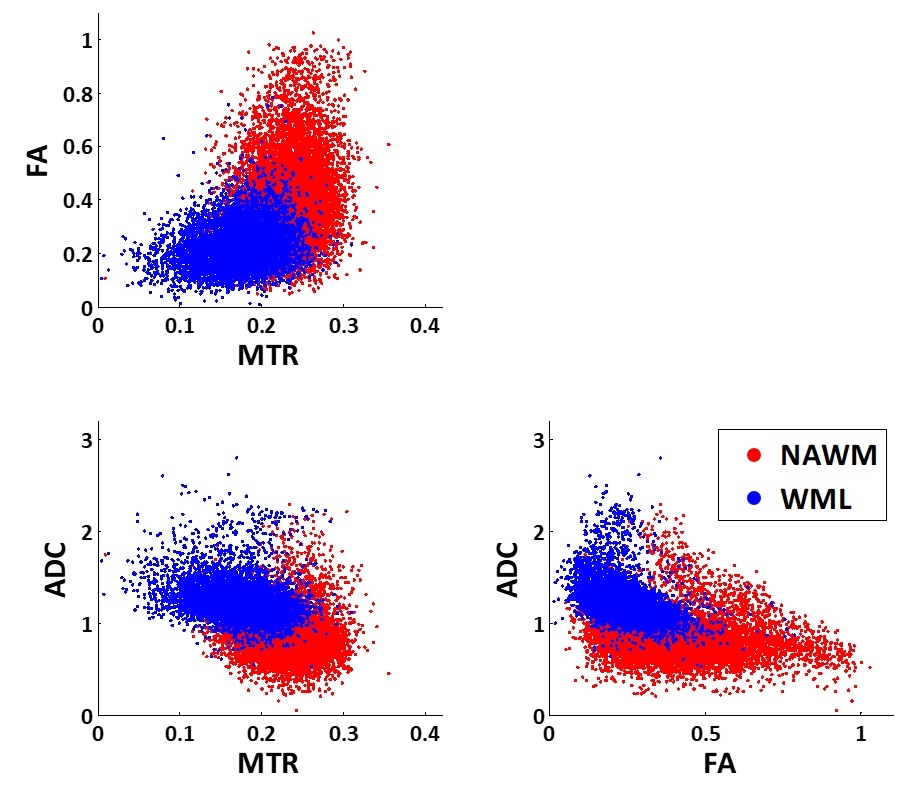
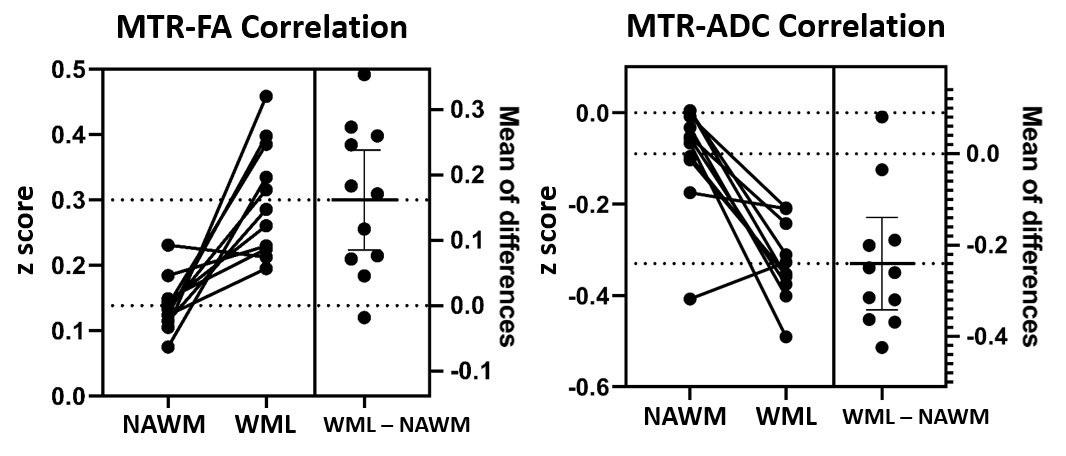
Figure 1 shows the parametric maps obtained from a representative subject. Figure 2 is the scatter plot of the parameters from the same subject. As compared with NAWM, WMLs present lower MTR, lower FA, and higher ADC although there is noticeable overlap between the two ROIs. In addition, the parameters correlate differently with each other in NAWM and WML. As shown in Figure 3, the correlation is more noticeable in WML than NAWM between MTR and FA (paired Student's t test, p = 0.0008), MTR and ADC (p = 0.0004), but not between FA and ADC.Discussion
This study was based on the hypothesis that magnetization transfer imaging and diffusion imaging have different sensitivities to vascular and nonvascular components in WML. Specifically, the vascular pathology predominantly associates with ischemia and/or disrupted blood-brain-barrier and increased interstitial fluid, in which myelin damage is secondary. FA and ADC are both derived from the diffusivity of water molecules. By contrast, MTR is based on the magnetization exchange with the protons bound to the macromolecules in myelin, while the nonvascular pathology of WML has been thought to include demyelination and gliosis. Indeed, our results showed that MTR and FA/ADC are correlated differently in NAWM and WML (i.e., the two regions were chosen for their different composition/status of blood-brain-barrier, interstitial water content, and myelin). The sensitivity of combined MTR/FA/ADC can be further verified by comparing CSVD with other neurological diseases that present WML but have nonvascular pathogenesis (e.g., multiple sclerosis).Acknowledgements
This work was supported by grant 109-2314-B-002-031-MY3 (National Science and Technology Council, Taiwan).References
1. Wardlaw JM, Smith EE, Biessels GJ, et al. Neuroimaging standards for research into small vessel disease and its contribution to ageing and neurodegeneration. Lancet Neurol. 2013;12:822-838.
2. Gallisaya ML, Beare R, Phan T, et al. Progression of white matter hyperintensities of presumed vascular origin increases the risk of falls in older people. J Gerontol A Biol Sci Med Sci. 2015;70:360-366.
3. Fazekas F, Schmidt R, Scheltens P. Pathophysiologic mechanisms in the development of age-related white matter changes of the brain. Dementia and Geriatric Cognitive Disorders. 1998;9:2-5.
4. Schmidt P, Gaser C, Arsic M, Buck D, Förschler A, Berthele A, Hoshi M, Ilg R, Schmid VJ, Zimmer C. An automated tool for detection of FLAIR-hyperintense white-matter lesions in multiple sclerosis. Neuroimage. 2012;59:3774-3783.
Figures