2068
White matter microstructure alterations in systemic lupus erythematosus patients: A Quantitative synthetic MRI Study1Department of Radiology, The First Affiliated Hospital of Guangxi Medical University, Nanning, China, 2GE Healthcare, MR Research China, Beijing, China
Synopsis
Keywords: Neurotransmission, Quantitative Imaging, systemic lupus erythematosus; quantitative MRI; white matter microstructure
Motivation: Neuropsychiatric disorders are common symptoms in systemic lupus erythematosus (SLE) patients. However, investigations into altered white matter (WM) microstructure caused by SLE were insufficient.
Goal(s): Investigate WM microstructure alterations and their association with anxiety and depression in SLE patients using synthetic MRI (SyMRI) technique.
Approach: T1, T2 and myelin content, acquired by SyMRI, were compared between 52 SLE patients and 24 health controls.
Results: Longer T1 relaxation time and lower myelin content were found in several WM regions, and anxiety in SLE patients was found to be correlated with a decrease in myelin content in the fornix.
Impact: The demyelination of the fornix may be a significant factor leading to anxiety in patients with systemic lupus erythematosus.
Introduction
Systemic lupus erythematosus (SLE) a chronic inflammatory, immune-mediated disease leading to diverse clinical manifestations, including neuropsychiatric symptoms1. Several studies have reported alterations in white matter (WM) volume and microstructure, which are associated with neuropsychiatric disorders, using structural and diffusion MRI techniques2, 3. However, there has been a lack of investigations into WM microstructure alterations revealed by quantitative MRI parameters (T1, T2, myelin content, etc.) in SLE patients. Previous research introduced a novel technique called synthetic MRI (SyMRI), which allows the acquisition of T1, T2, and myelin content mapping images in a single scanning session4. Therefore, the present study aimed to quantify T1, T2, and myelin content values of brain WM in SLE patients using the SyMRI technique.Methods
Fifty-two patients with SLE (age: 16 to 56 years; gender: 2 males and 50 females) and 24 healthy control (HC) subjects (age: 21 to 49 years; gender: 0 males and 24 females) were recruited from First Affiliated Hospital of Guangxi Medical University (Table 1). All SLE patients underwent the Self-Rating Anxiety Scale (SAS) and Self-Rating Depression Scale (SDS) assessments. This study received approval from the local ethics committee, and all participants signed informed consent forms before the study.MRI data were obtained using a 3.0T scanner (SIGNA Premier GE Healthcare, WI, USA). T1-weighted (T1w) images of each participant were acquired using a 1-mm isotropic sagittal 3D magnetization prepared rapid gradient echo sequence. Quantitative MRI parameters were obtained using the SyMRI technique, which is based on an axial 2D multiple-dynamic multiple-echo (MDME) sequence4. The key parameters of the MDME sequence included: image resolution=2.0mm×2.0mm; and slice thickness/gap=2/0mm.
The T1, T2 and myelin volume content maps (T1m, T2m and MYC) were generated using postprocessing software (SyntheticMR). Then, the T1m, T2m and MYC images were normalized to Montreal Neurological Institute (MNI) space as follow: (1) bias fields of T1w images were removed using the Advanced Normalization Tools (ANTs). (2) Brain masks for T1w images were calculated using SynthStrip algorithm embedded in Freesurfer. (3) The rigid transformation matrix between T1m and T1w images, as well as non-linear warped images between T1w images and T1w template images in MNI space, were computed using ANTs. (4) The above transformation matrix and warped images were utilized to transform T1m, T2m, and MYC images into MNI space. (5) All images in MNI space were masked with a MNI WM mask and subsequently smoothed using an isotropic Gaussian kernel (3-mm FWHM). Then, the general linear model (GLM) was used to calculate voxel-based differences of T1m, T2m and MYC in WM with controlling the age and gender as covariates. For multiple comparison correction, the voxel-wise comparison across the WM was initially performed using an uncorrected p-value threshold of < 0.001, followed by cluster-level correction using family-wise error correction (p<0.05). Finally, T1, T2, and MYC values from each independent cluster in the group difference maps were extracted, and the correlation between these values and SAS and SDS scores were assessed.
Results
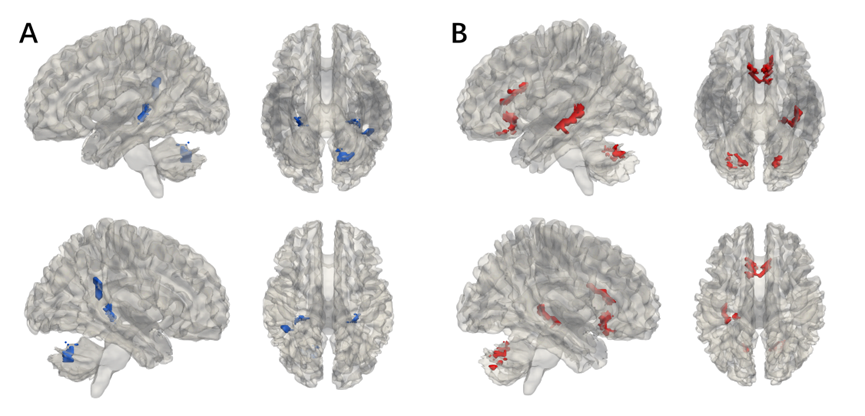
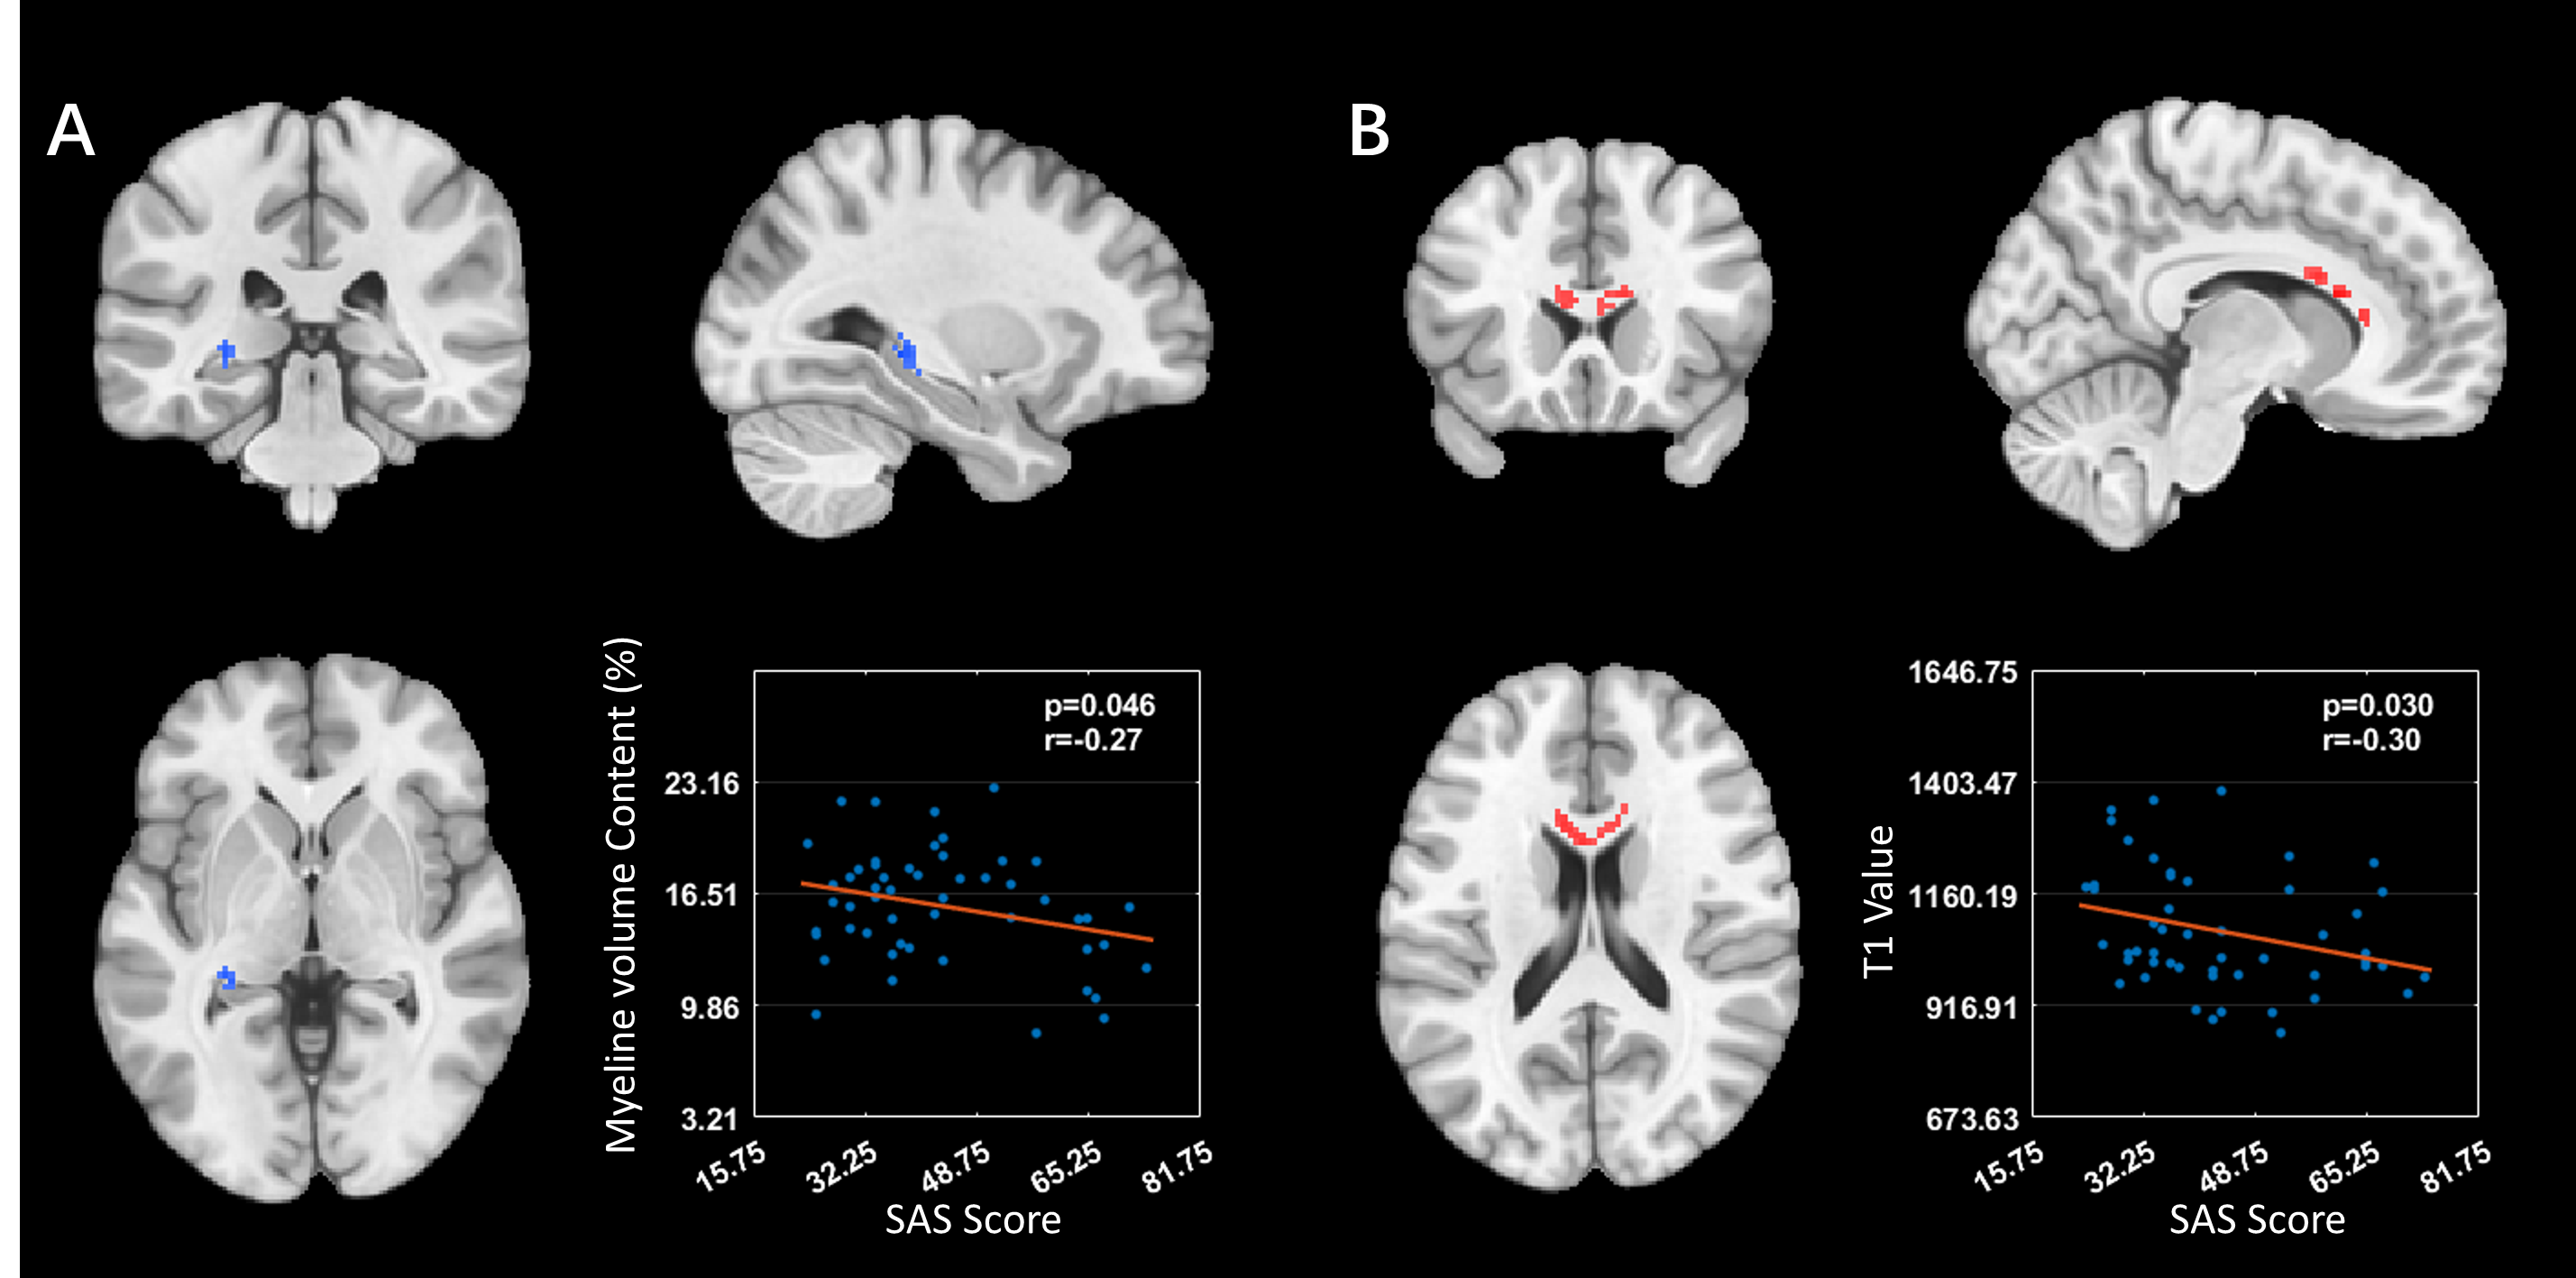
The difference in quantitative MRI parameters between SLE and HC groups were showed in Table 2 and Fig. 1. Compared with HC groups, SLE patients showed increased T1 relaxation time in several WM regions, including the corpus callosum, cerebellar WM, and temporal WM. Additionally, lower myelin content was found in right superior longitudinal fasciculus, right cerebellar WM and bilateral fornix in the SLE group. There was no WM area with altered T2 values. Furthermore, myeline content in fornix and T1 value in corpus callosum were negatively correlate with SAS scores in SLE patients (Fig. 2).Discussion
In the present study, we found several WM regions showing increased T1 values and decreased myelin content in SLE patients. Previous research has indicated that SLE patients experience WM atrophy in the corpus callosum region, which may be associated with axonal injury2. The study using diffusion tensor imaging technique have revealed reduced FA in the corpus callosum area, indicating alterations in axonal integrity3. Therefore, the increased T1 values observed in the corpus callosum region in this study may be related to the WM neural loss. Additionally, anxiety in SLE patients were correlated with myelin content decrease in fornix. The fornix serves as the primary axonal output pathway from the hippocampus to the mammillary bodies, and the anterior hippocampus has also been implicated in anxiety-related behavior5. Thus, demyelination of fornix could be a critical factor result in anxiety in SLE patients.Conclusion
The quantitative SyMRI technique could reflect the WM microstructure alterations, which can extend our knowledge about brain changes in SLE patients.Acknowledgements
No acknowledgement found.References
1. Hanly J G. Diagnosis and management of neuropsychiatric SLE. Nature Reviews Rheumatology, 2014, 10(6): 338-347.
2. Nystedt J, Nilsson M, Jönsen A, et al. Altered white matter microstructure in lupus patients: a diffusion tensor imaging study. Arthritis research & therapy, 2018, 20: 1-11.
3. Appenzeller S, Bonilha L, Rio P A, et al. Longitudinal analysis of gray and white matter loss in patients with systemic lupus erythematosus. Neuroimage, 2007, 34(2): 694-701.
4. Warntjes J B M, Leinhard O D, West J, et al. Rapid magnetic resonance quantification on the brain: optimization for clinical usage. Magnetic Resonance in Medicine: An Official Journal of the International Society for Magnetic Resonance in Medicine, 2008, 60(2): 320-329.
5. Bannerman D M, Rawlins J N P, McHugh S B, et al. Regional dissociations within the hippocampus—memory and anxiety. Neuroscience & biobehavioral reviews, 2004, 28(3): 273-283.
Figures