2065
The association between cerebral dirty-appearing white matter and progression of small vessel disease in community-dwelling older adults1Radiology, Leiden University Medical Center, Leiden, Netherlands, 2Icelandic Heart Association, Kopavogur, Iceland, 3Leiden University Medical Center, Leiden, Netherlands, 4Laboratory of Epidemiology and Population Science, National Institute on Aging, Bethesda, MD, United States
Synopsis
Keywords: White Matter, White Matter, Aging, Small Vessel Disease, Neurodegeneration
Motivation: Dirty-appearing white matter (DAWM) might be an early marker of cerebral small vessel disease (SVD) progression.
Goal(s): To investigate whether dirty-appearing white matter (DAWM) on brain MRI is related to long-term progression of SVD markers in a cohort of community-dwelling older adults.
Approach: We visually rated DAWM volume fraction on baseline FLAIR images (n=2506) and related this to progression of multiple SVD MRI markers at the 5.2-year follow-up.
Results: Global and occipital DAWM is associated with an increase in global white matter hyperintensity (WMH) volume at follow-up. This suggests that DAWM is an early marker of SVD, preceding WMH.
Impact: The presence of DAWM on MRI might help in early risk stratification of older adults at risk for cognitive decline due to SVD, and in that way allow for selection of individuals for preventive lifestyle interventions and treatment trials.
Relevance
Cerebral small vessel disease (SVD) is a major cause of cognitive decline and dementia, and often co-occurs with Alzheimer’s dementia1,2. Early identification of individuals at increased risk is needed to select individuals for preventative lifestyle interventions and treatment trials. Established brain MRI markers are not sensitive enough for early identification3,4, but dirty-appearing white matter (DAWM) might have potential. DAWM is becoming more apparent with MRI advances in signal-to-noise ratios and possibly represents early-stage subtle white matter (WM) changes of SVD5. On FLAIR MRI it often presents as diffuse periventricular areas with intensities between normal-appearing WM and WM hyperintensities (WMH) of presumed vascular origin6. We previously developed a visual rating scale to estimate DAWM volume in multiple sclerosis7, and we used this scale in the current study to assess if DAWM is associated with progression of cerebral SVD markers in community-dwelling older adults.Methods
Data was obtained from the Age-Gene/Environment Susceptibility (AGES) study cohort8, totaling 4614 brain MRI participants. A 1.5T Signa Twinspeed (GE, USA) was used to acquire anatomical and T2-FLAIR images (fast spin-echo, TE=100ms, TR=8000ms, TI=2000ms, FA=90°, FOV=220x220mm, 0.86x0.86x3mm voxels)9 at baseline and at 5.2±0.2 year follow-up.DAWM was defined as areas of FLAIR signal abnormality of at least 3 mm wide, visible on at least two slices. We distinguished it from diffuse WMH edges based on nearby intensity information (see Figure 1). DAWM was rated as a percentage of WM volume7 of the frontal, temporal, parietal and occipital lobes (0: no DAWM, 1: <10%, 2: 10-25%, 3: 25-50%, 4: 50-75%, 5: 75-100%)7, as delineated by visual landmarks (see Fig.2). Lobar ratings were made bilateral, as pilot ratings showed almost no variance between hemispheres in lobar DAWM scores. Corona radiata and radiata optica hyperintensities can be isointense to DAWM, as they have different MR relaxation properties than normal WM10, and were carefully inspected visually to not rate them as DAWM (see Figure 1). Ratings were discussed with an experienced neuroradiologist (JdB).
Exclusion criteria for DAWM rating (n=182) were: image artefacts or noise (n=112), extreme ventriculomegaly (n=31), large infarcts or hemorrhages (n=33) or extensive atrophy (n=6), leaving 4431 participants. Raters were blinded to any patient characteristics. Intra-rater reliability for the lobar DAWM ratings was good for IE (linear weighted κ=0.72, CI95 [0.60, 0.85], n=70), who rated 3231 images, and excellent for LV (κ=0.91, CI95 [0.83, 0.98], n=24) who rated 1200 images. The inter-rater reliability between IE and LV was good (κ=0.72, CI95 [0.63, 0.82], n=100). Out of the 4431 participants, 2506 underwent both baseline and follow-up scans and were included in the current study (Fig.3).
Statistical analyses were performed using RStudio 1.4.1717. The relation between baseline DAWM score and WMH progression, normalized for intracranial volume, was analyzed using linear regression (see Figure 5). Other cerebral SVD progression markers3,4 (counts of microbleeds, enlarged perivascular spaces, and subcortical infarcts) were scored for all scans after the follow-up period11. They were first binarized to prevent high count skew and entered as dependent variables in logistic regression models. All models were corrected for age and sex.
Results
In total 1739 participants (69%) had cerebral DAWM on the baseline MRI and 1647 participants (66%) had occipital DAWM at baseline. New subcortical infarcts, new microbleeds and new perivascular spaces were found for 585 participants in total (see Table 2 for individual counts). Higher total DAWM (B=2.01, p<.01) and occipital DAWM scores (B=12.51, p<.01) at baseline were associated with an increase in WMH volume at the 5.2-year follow-up (Table 3). DAWM in the parietal lobe was not included due to nonnormal distributions and high outlier counts. DAWM at baseline was also not associated with new microbleeds, new enlarged perivascular spaces or new subcortical infarcts at follow-up.Conclusion and discussion
Higher total and occipital DAWM volume ratings were associated with an increase in WMH volume from baseline to the 5.2-year follow-up, suggesting that presence of DAWM might be an early marker of SVD that precedes occurrence of WMH.DAWM was rarely observed frontotemporally, while parietal and occipital DAWM was common (Table 2). Possible explanations include: (1) a difference between occipitoparietal and frontal watershed areas in susceptibility to ischemia and other vascular dysfunction; (2) periventricular frontal WMH are larger and more common than found occipitally, which have possibly developed from preceding DAWM; (3) difficulty in distinguishing between corona radiata and periventricular DAWM, leading to more conservative ratings frontally; and (4) intensity inhomogeneities that commonly favored occipitoparietal areas, possibly due to inhomogeneous B0 or B1 fields.
Acknowledgements
No acknowledgement found.References
1. Wardlaw, J. M., Smith, C. & Dichgans, M. Mechanisms of sporadic cerebral small vessel disease: Insights from neuroimaging. The Lancet Neurology, 12, 483–497 (2013).2. van Veluw, S. J., Arfanakis, K. & Schneider, J. A. Neuropathology of vascular brain health: insights from ex vivo magnetic resonance imaging-histopathology studies in cerebral small vessel disease. Stroke 53, 404–415 (2022).
3. Wardlaw, J. M. et al. Neuroimaging standards for research into small vessel disease and its contribution to ageing and neurodegeneration. The Lancet Neurology 12, 822–838 (2013).
4. Duering, M. et al. Neuroimaging standards for research into small vessel disease—advances since 2013. The Lancet Neurology 22, 602–618 (2023).
5. Wardlaw, J. M., Valdés Hernández, M. C. & Muñoz-Maniega, S. What are white matter hyperintensities made of? Relevance to vascular cognitive impairment. J Am Heart Assoc 4, e001140 (2015).
6. Valdés Hernández, M. C. et al. Morphologic, distributional, volumetric,and intensity characterization of periventricular hyperintensities. Am J Neuroradiol 35, 55–62 (2014).
7. Nagtegaal, M. A. et al. White matter changes measured by multi-component MR Fingerprinting in multiple sclerosis. Neuroimage Clin 40, (2023).
8. Harris, T. B. et al. Age, Gene/Environment Susceptibility-Reykjavik Study: Multidisciplinary applied phenomics. Am J Epidemiol 165, 1076–1087 (2007).
9. Sveinbjornsdottir, S. et al. Cerebral microbleeds in the population based AGES-Reykjavik study: Prevalence and location. J Neurol Neurosurg Psych 79, 1002–1006 (2008).
10. Russell-Schulz, B., Laule, C., Li, D. K. B. & MacKay, A. L. What causes the hyperintense T2-weighting and increased short T2 signal in the corticospinal tract? Magn Reson Imaging 31, 329–335 (2013).
11. Sigurdsson, S. et al. Incidence of brain infarcts, cognitive change, and risk of dementia in the general population: The AGES-Reykjavik study (Age Gene/Environment Susceptibility-Reykjavik study). Stroke 48, 2353–2360 (2017).
Figures
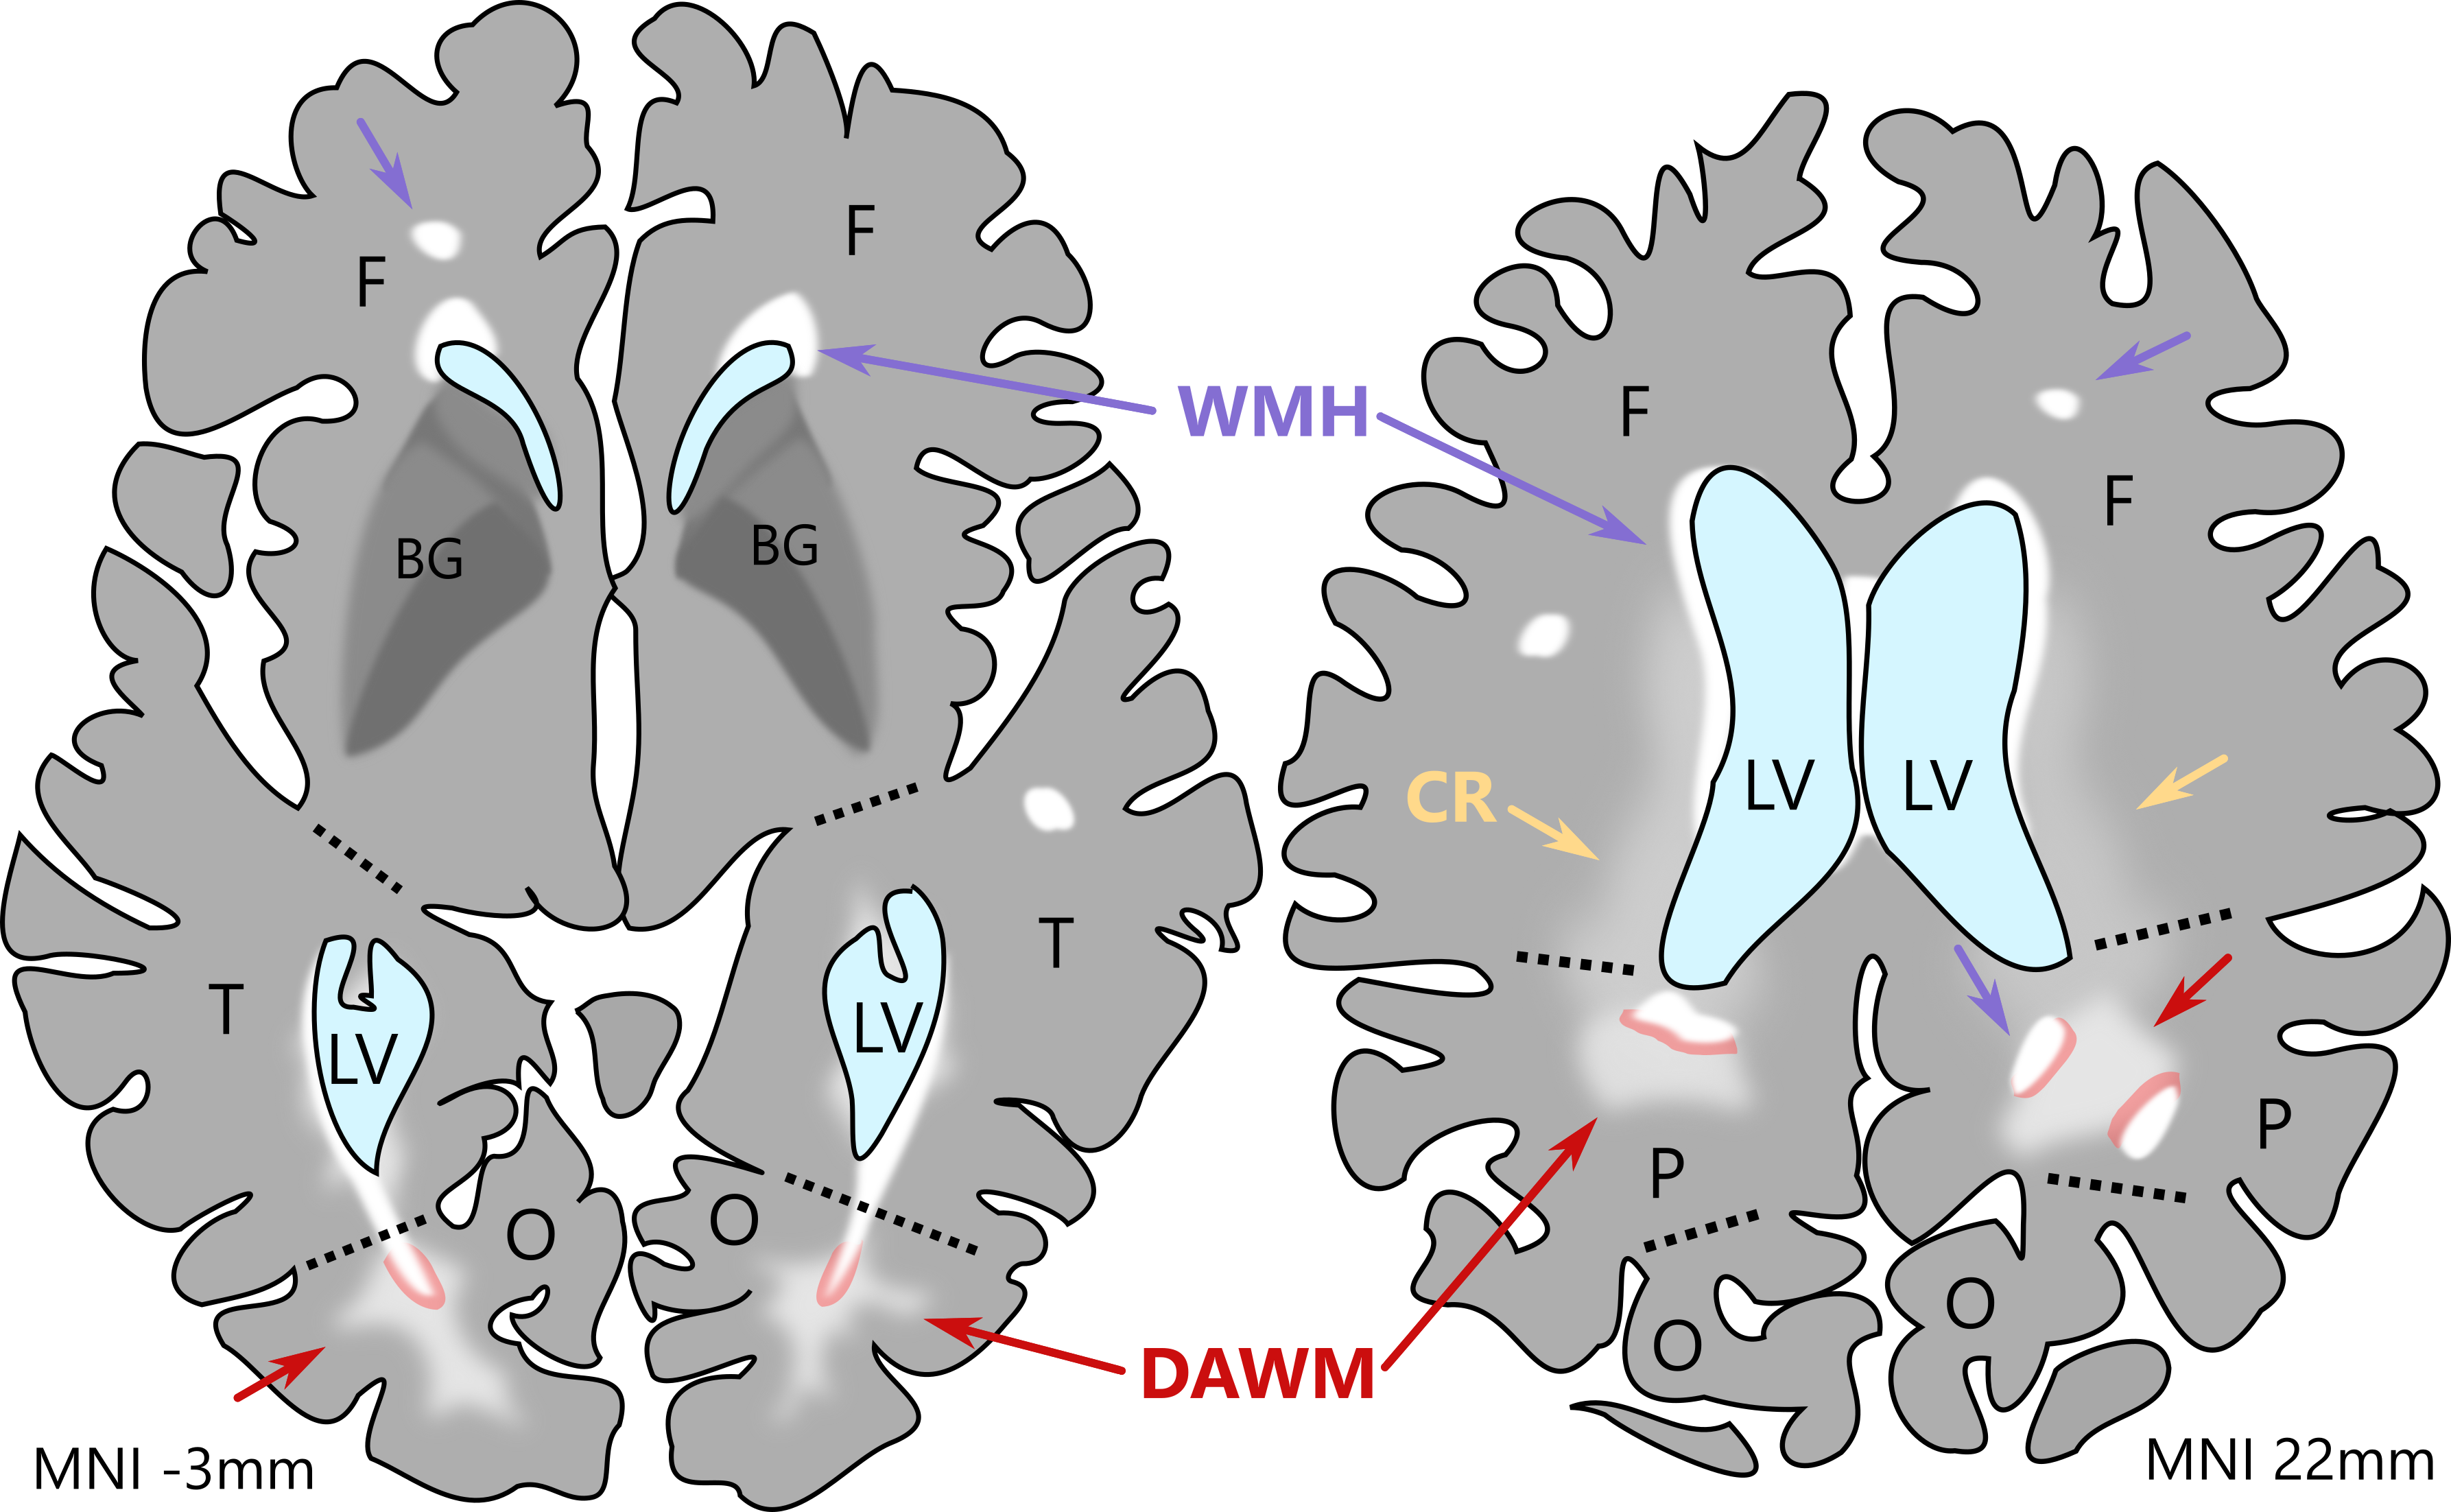
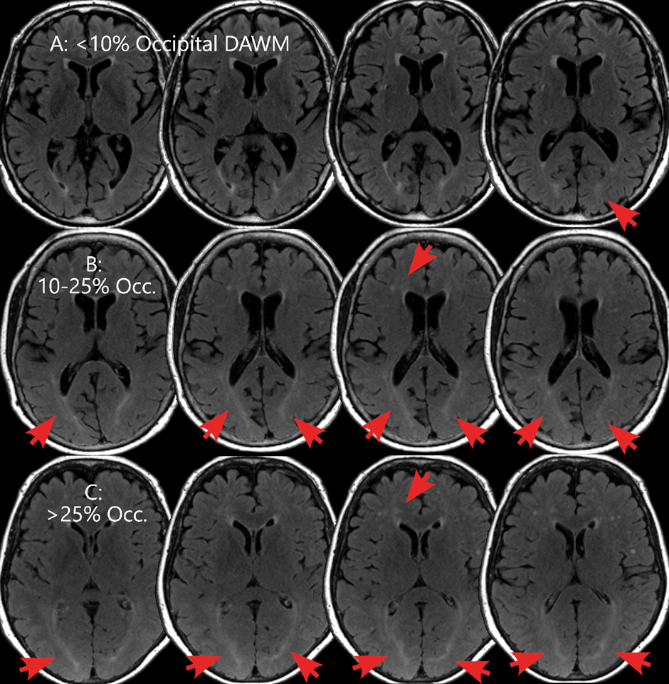
Figure 2. Examples of transversal slices of FLAIR MRI scans of three different older adult participants in left-to-right slice order from lower to higher, with large occipital and small frontal areas of DAWM denoted by red arrows. Common intensity windowing was found to show differences in DAWM volume between the top row (A, <10% DAWM of total occipital WM), where mostly the frontal WMH caps and occipital periventricular WMH and ependymal lining is visible, and row B (10-25%) and C (>25%) where larger, bilateral confluent areas of occipital DAWM can be seen, extending to slices not shown.
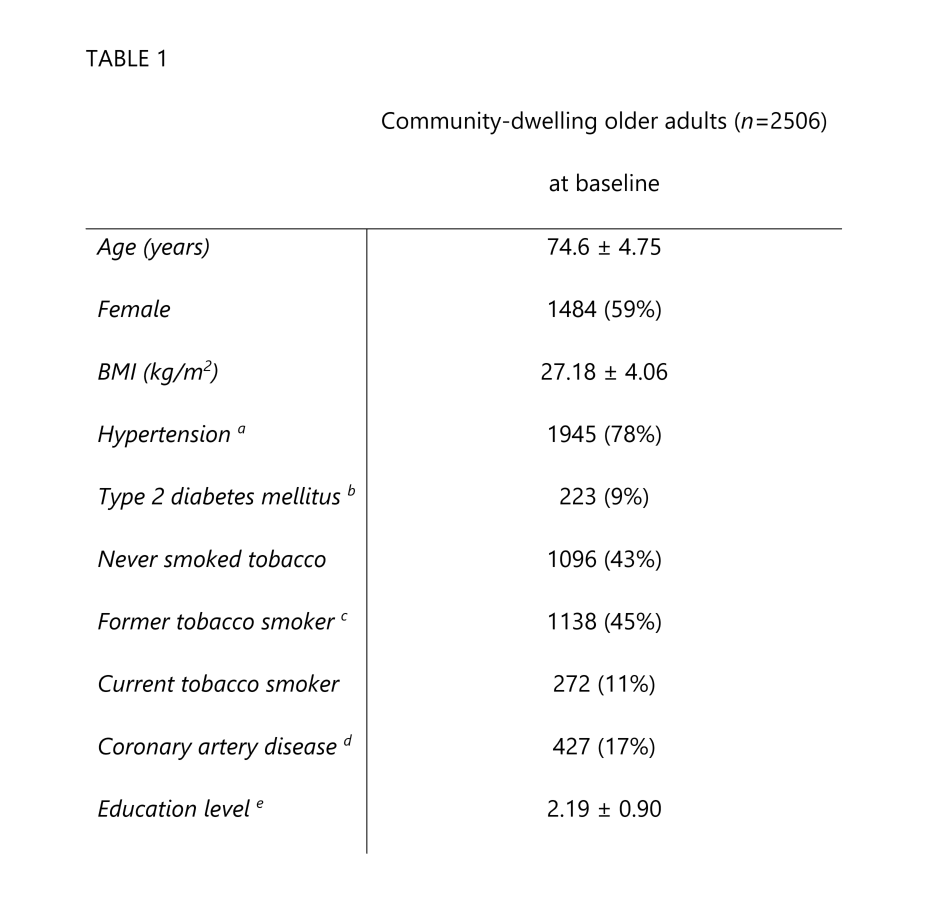
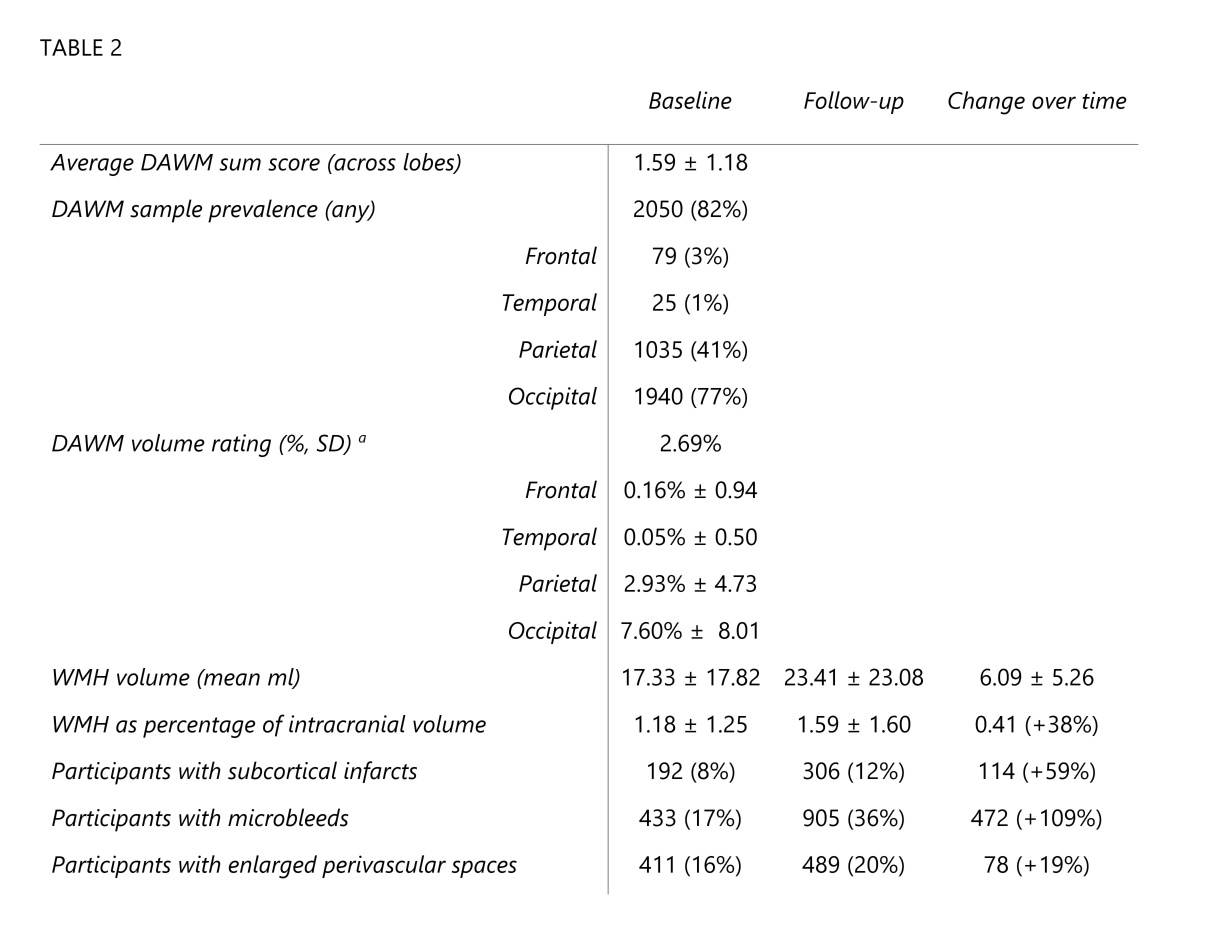
Table 2. Data presented as mean ± standard deviation (SD), or frequency (prevalence %). a Approximation calculated by setting the 0-10% DAWM rating per lobe category as 5% for that lobe, 10-25% rating as 17.5%, and >25% rating as 37.5%, and averaging across lobes and participants. Change percentage calculated using the formula ((new–old)/old)*100. Intracranial volumes were averaged between baseline and follow-up for more accurate normalization.
Table 2.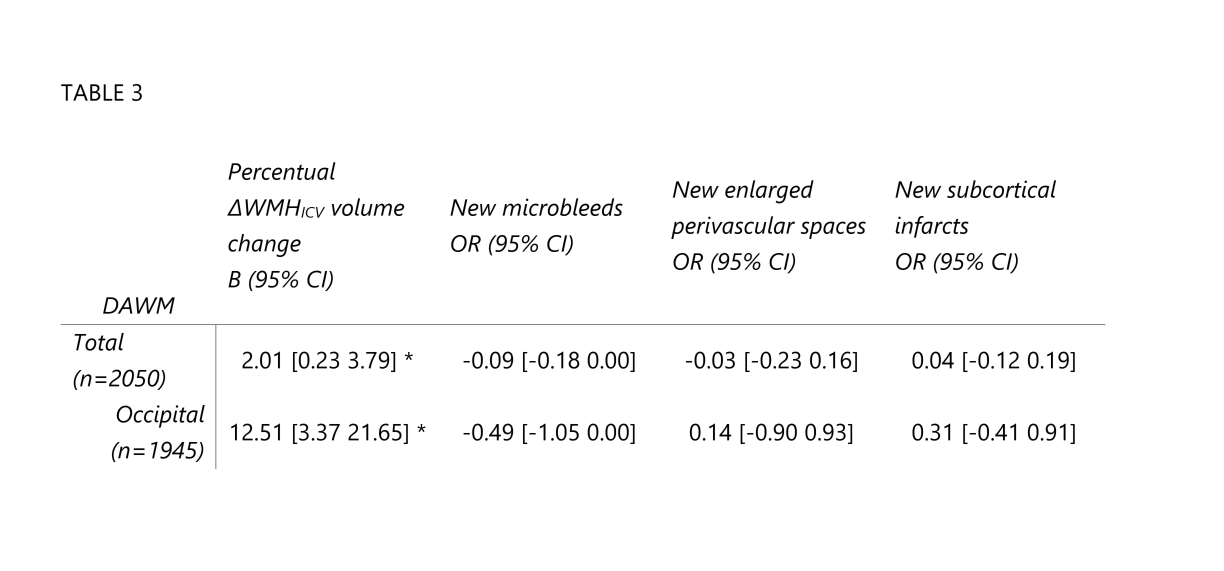
Table 3. The relationship between baseline DAWM and WMH volume change was modelled with linear regression, controlled for age and sex. The association of DAWM scale with new subcortical brain infarcts, microbleeds, and enlarged perivascular spaces at follow-up was modelled using logistic regression, controlled for age and sex. Results are shown as B values (95% CI) or odds ratio (OR) (95% CI). Positive b-values indicate that WMH volume increases with higher baseline DAWM volume ratings. OR above 1 indicate higher odds per DAWM rating increase, and vice versa. * = p<0.01