2064
Iron Deposition Characteristics in Normal-appearing White Matter: A Community Study Using Quantitative Susceptibility Mapping Method1Department of Radiology, Shandong Provincial Hospital Affiliated to Shandong First Medical University, Jinan, China, 2Jena University Hospital, Jena, Germany, 3Department of Radiology, Weill Medical College of Cornell University, New York, NY, United States, 4Department of Radiology, Beijing Tsinghua Changgung Hospital, Beijing, China, 5Department of Radiology and Nuclear medicine, Capital Medical University, Beijing, China
Synopsis
Keywords: White Matter, Neurodegeneration
Motivation: The factors that influence iron deposition in the normal-appearing white matter (NAWM) of the brain have yet to be thoroughly examined.
Goal(s): This study aimed to measure brain iron levels in a community population and identify factors affecting NAWM iron levels.
Approach: Brain iron load was assessed using quantitative susceptibility mapping.
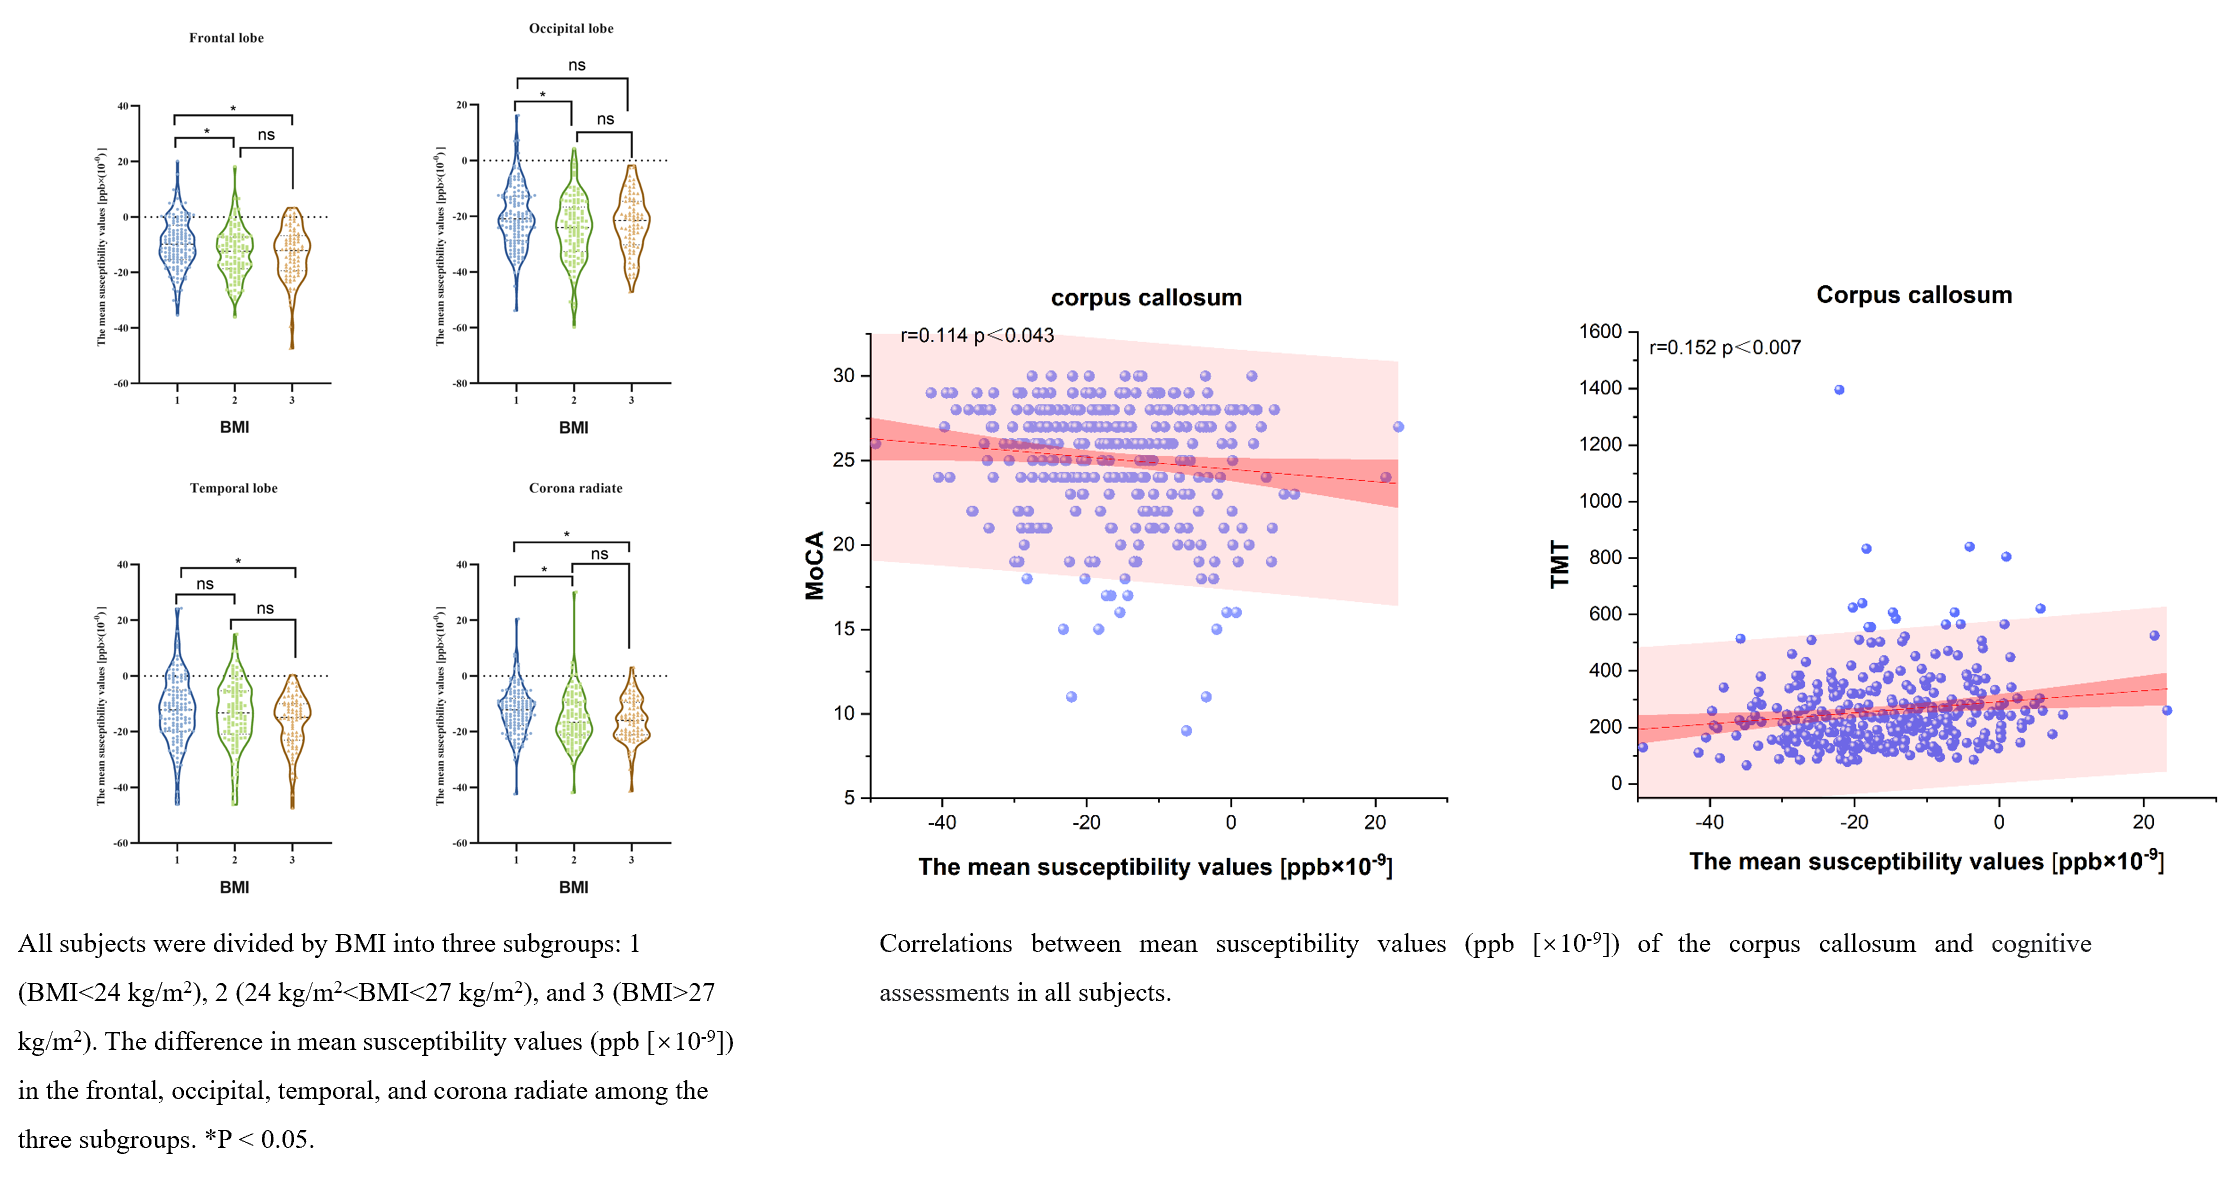
Results: Age, hypertension, T2DM, smoking, BMI, and APOE4 affect iron metabolism in certain NAWM brain regions. Moreover, the mean susceptibility values of the corpus callosum are significantly related to some cognitive tests.
Impact: We could identify the potential factors that could affect iron levels in the white matter and accurately map iron in this part of the brain. This information could help us better control confounding variables in future research.
Introduction
Although iron is essential for the human body, excess iron can harm cell membranes, encourage cell growth, and trigger oxidative stress [1]. Additionally, iron accumulation can negatively impact cognitive function and contribute to neurological disorders [1, 2]. Conversely, iron deficiency can impair the development of neurons and glial cells, ultimately leading to intellectual loss and neurodevelopmental disorders [3, 4]. Abnormal brain iron deposits are commonly found in neurodegenerative diseases such as Parkinson's, multiple sclerosis, and amyotrophic lateral sclerosis [5]. Studies on cerebral small vessel disease (CSVD) have reported an association between CSVD and increased levels of brain iron in certain gray matter regions[6]. Nonetheless, the potential implications of this disease on white matter, despite its crucial role in neural pathways, have not been sufficiently investigated. This study used the quantitative susceptibility mapping (QSM) method to measure brain iron levels in elderly individuals and identify factors affecting normal-appearing white matter (NAWM) iron levels.Methods
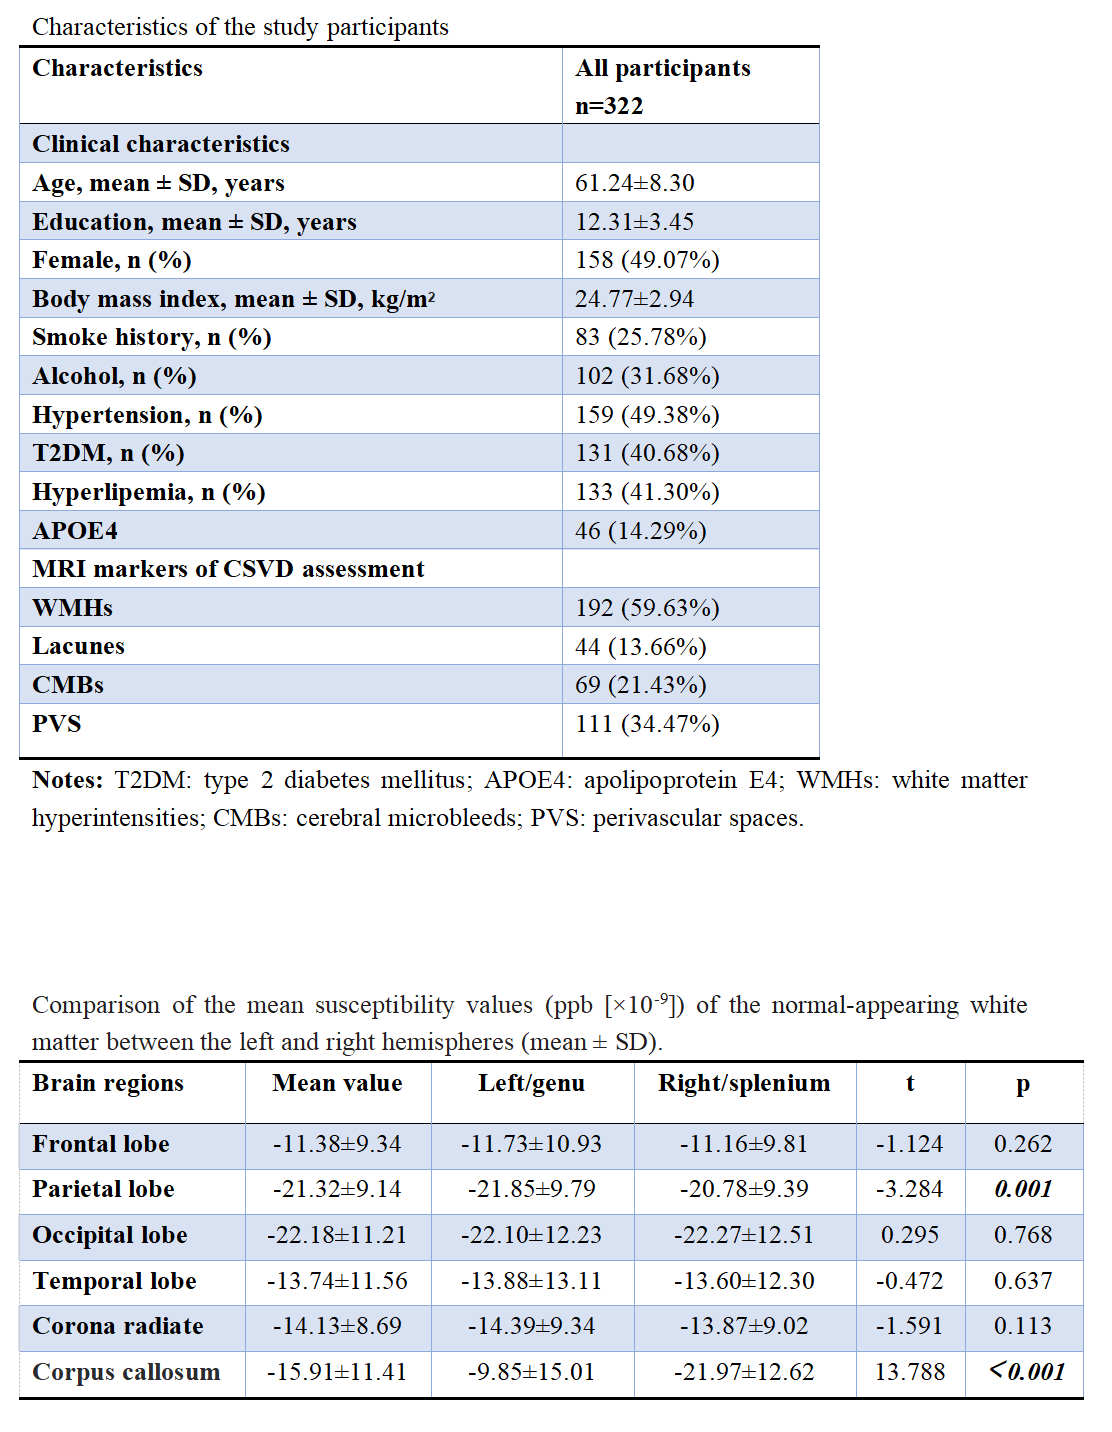
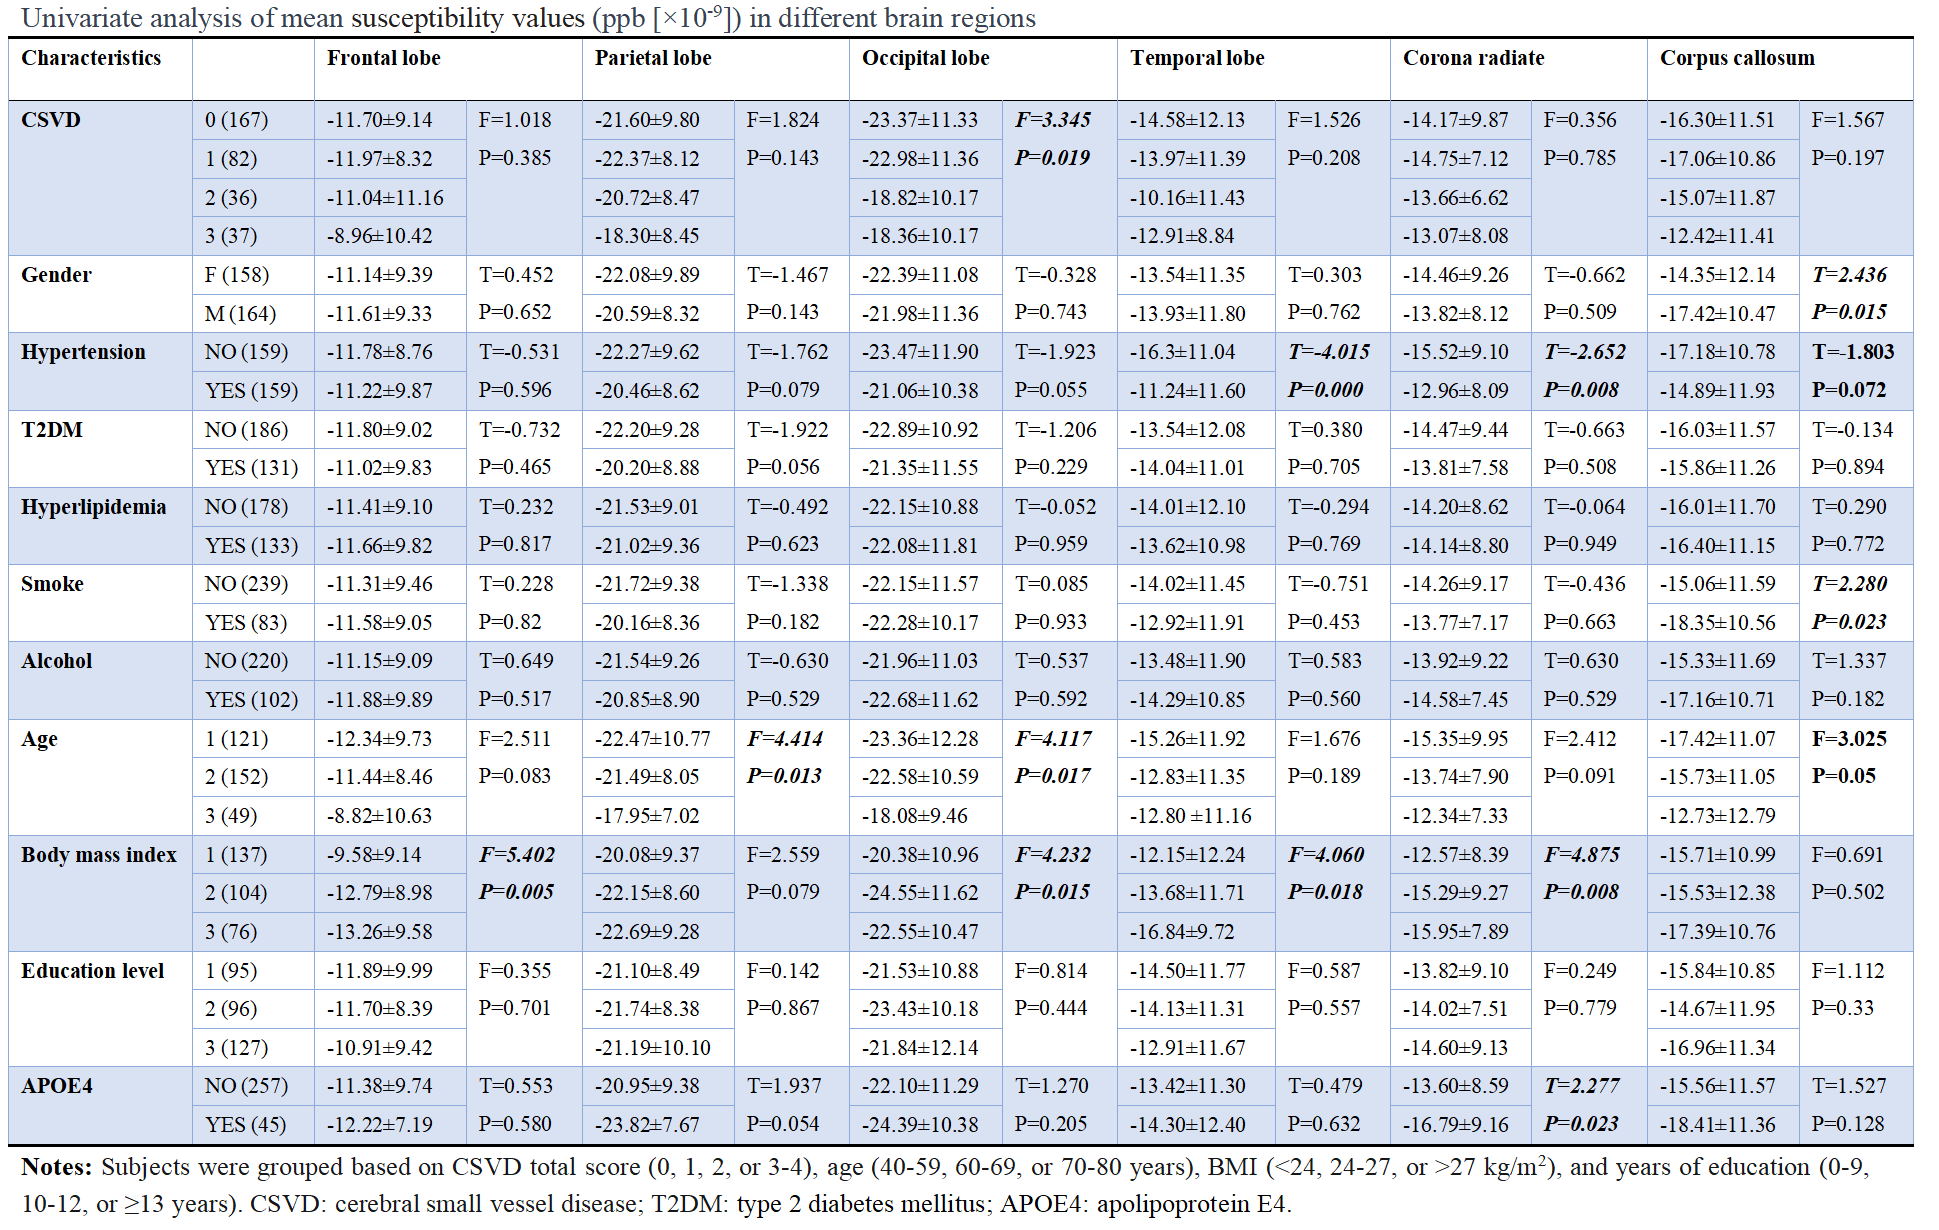
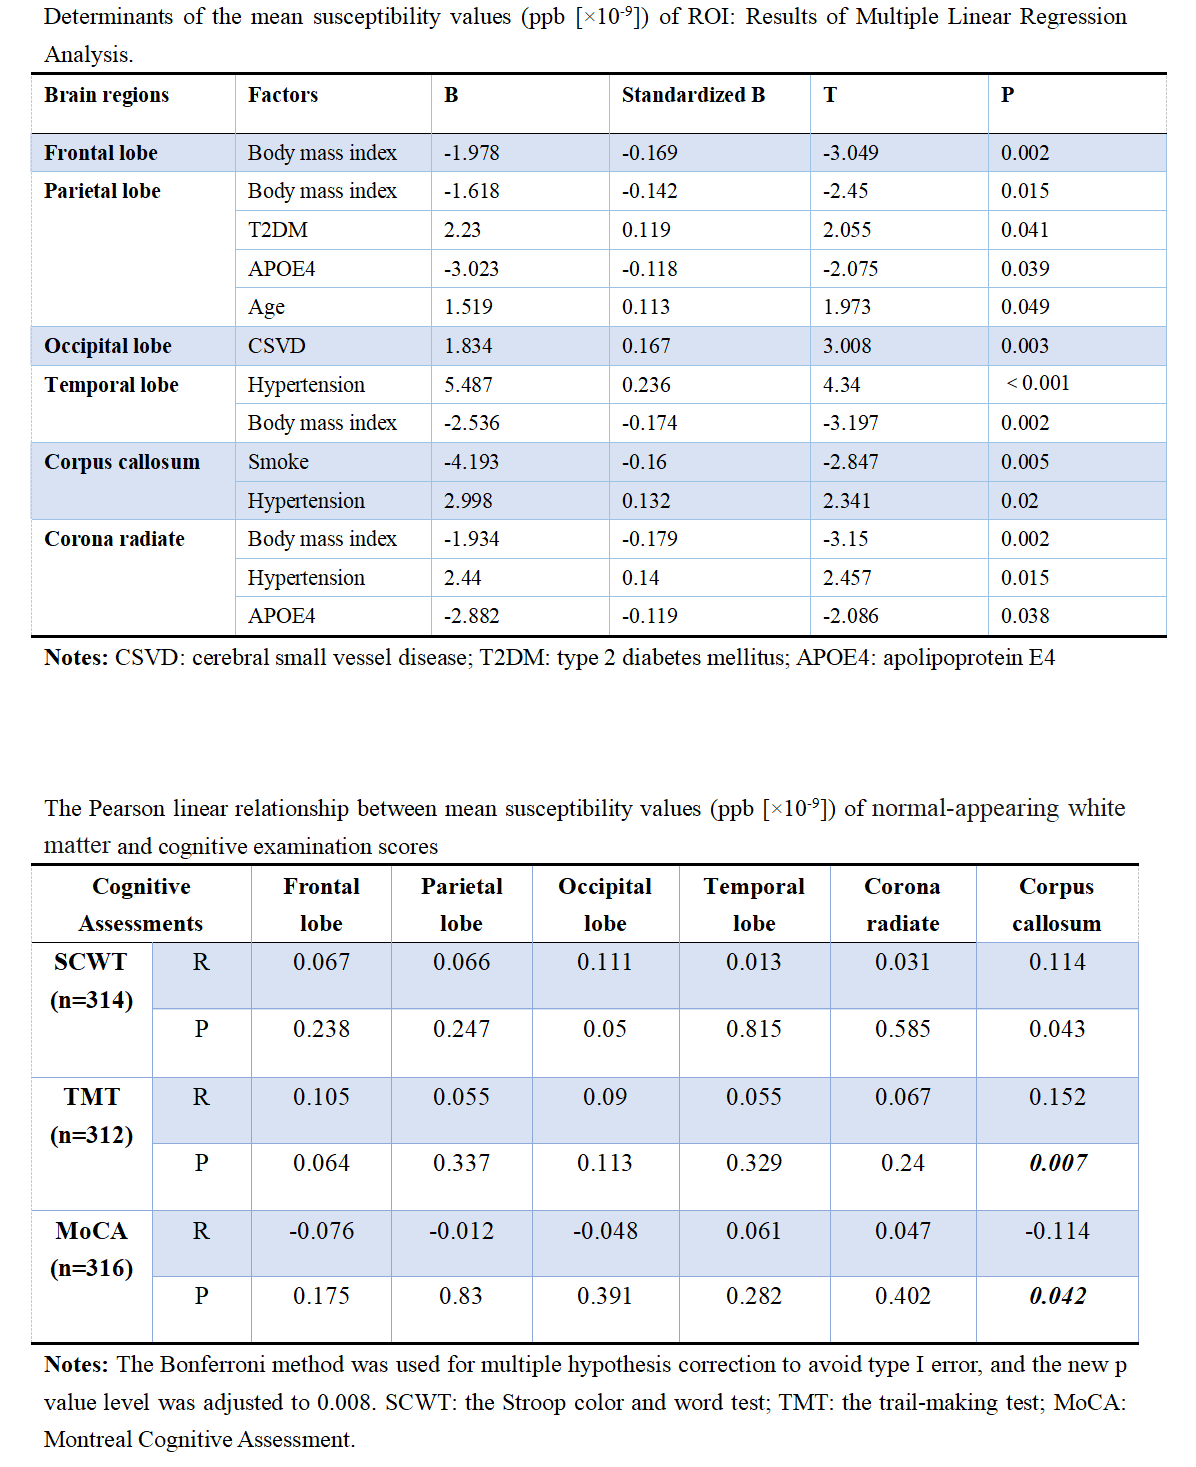
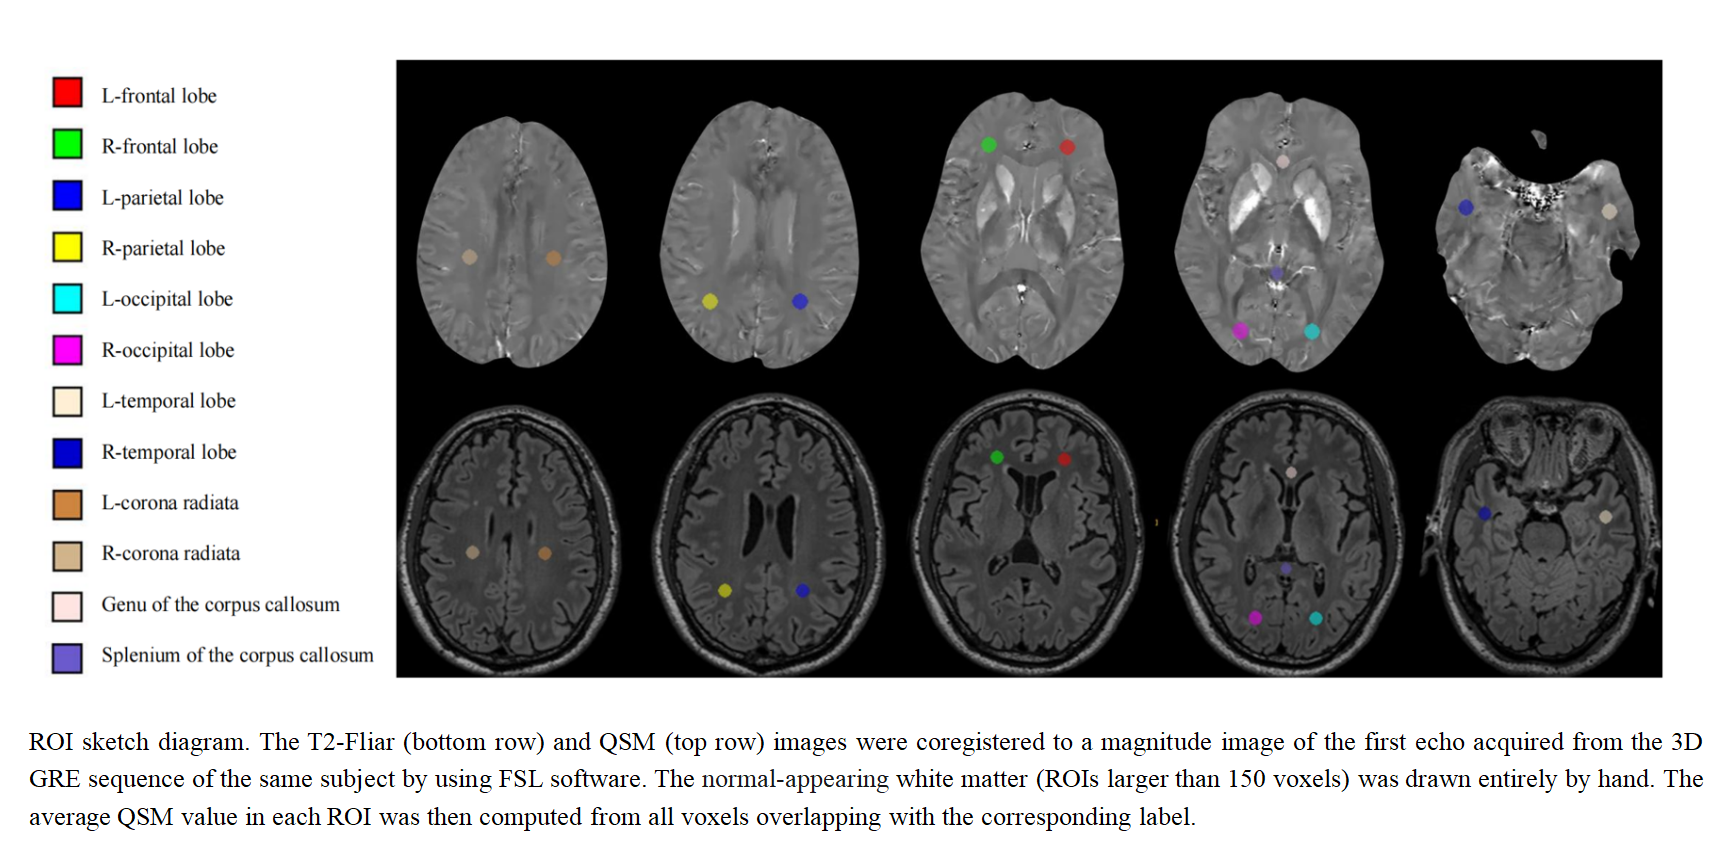
A total of 322 participants, ranging in age from 40 to 80 years, were enrolled in the study. All participants underwent blood biochemistry tests, cognitive function assessments, and magnetic resonance imaging (MRI) scans, and all participants were right-handed. Descriptive analysis of clinical markers and MRI markers for evaluating CSVD was performed in all subjects. The paired sample T test was used to investigate whether there were significant differences in the left and right NAWM regions of the brain. In addition, univariate analysis and multiple linear regression were used to explore the differences in mean susceptibility values in different NAWM brain regions and the influencing factors. At the same time, Pearson correlation analysis was used to analyze the correlation between NAWM brain areas and cognitive function.Results
Mean susceptibility values differed significantly between the left and right hemispheres in the parietal lobes, splenium, and genu of the corpus callosum (CC). Univariate analysis revealed that CSVD total scores had a significant impact on the mean susceptibility values of the parietal lobe, while gender affected the mean susceptibility values of the CC. Mean susceptibility values of the temporal lobe and internal capsule were significantly affected by hypertension, while smoking had a substantial impact on the mean susceptibility values of the CC. Age significantly influenced the parietal and frontal lobes, while BMI significantly impacted the frontal, parietal, temporal lobes, and internal capsule. Moreover, the presence of apolipoprotein E4 (APOE4) significantly influenced the mean susceptibility values of the internal capsule. Multiple linear regression showed that higher BMI corresponded to lower mean susceptibility values in the frontal lobe. In the parietal lobe, BMI, APOE4, and age impacted mean susceptibility values, but BMI had the most significant effect. Higher CSVD total scores corresponded to greater mean susceptibility values in the occipital lobe. In the temporal lobe, BMI and hypertension impacted mean susceptibility values, but BMI had a more substantial influence. Smoking and hypertension affected mean susceptibility values in the CC, with smoking having a more pronounced effect. BMI, hypertension, and APOE4 played a role in the internal capsule, with APOE4 having the most significant impact on mean susceptibility values. Finally, Pearson correlation analysis showed a positive correlation between the mean susceptibility values of the CC and SCWT and TMT test results.Discussion
QSM is a high-precision MRI method that detects damage to white matter microstructure in advance and provides accurate imaging results for early diagnosis. It is worth noting that as the total CSVD scores increased, the iron content of the occipital lobe decreased. This may be because the occipital lobe is located in the back of the brain and is mainly responsible for blood supply through the posterior circulation. These small vessels are relatively thin and have a relatively weak blood supply, making them more vulnerable to damage caused by CSVD. This can damage the white matter microstructure of the occipital lobe. Additionally, the occipital lobe is responsible for processing visual information, which requires considerable oxygen and nutrients. CSVD can destroy the integrity of the blood-brain barrier, causing an insufficient supply of oxygen and nutrients, which affects the blood supply to the occipital lobe, eventually leading to lesions in the occipital lobe.Conclusions
This study used the QSM method to investigate the impact of various factors, such as age, sex, smoking and drinking status, and essential MRI characteristics of CSVD, on brain iron content in NAWM. The findings can provide valuable insights into susceptibility abnormalities in neurodegenerative diseases to aid in developing effective treatments. Furthermore, the study highlights the importance of strictly controlling confounding factors in future research studies.Acknowledgements
The authors thank all of the volunteers and patients for their participation in our study. This work was supported by grants from the National Natural Science Foundation of China (32100902), the Fundamental Research Funds for the Central Universities (SWU118065), the Funding for Study Abroad Program by Shandong Province (201803059), and the Shandong Provincial Natural Science Foundation (ZR2020MH288).References
1. Grubić Kezele, T. and B. Ćurko-Cofek, Age-Related Changes and Sex-Related Differences in Brain Iron Metabolism. Nutrients, 2020. 12(9).
2. Nnah, I. and M. Wessling-Resnick, Brain Iron Homeostasis: A Focus on Microglial Iron. Pharmaceuticals, 2018. 11(4).
3. Muhoberac, B.B. and R. Vidal, Abnormal iron homeostasis and neurodegeneration. Front Aging Neurosci, 2013. 5: p. 32.
4. Wu, Q., et al., Brain iron deficiency and affected contextual fear memory in mice with conditional Ferroportin1 ablation in the brain. Faseb j, 2021. 35(2): p. e21174.
5. Daglas, M. and P.A. Adlard, The Involvement of Iron in Traumatic Brain Injury and Neurodegenerative Disease. Frontiers in Neuroscience, 2018. 12.
6. Li, J., et al., Cerebral Microbleeds Are Associated With Increased Brain Iron and Cognitive Impairment in Patients With Cerebral Small Vessel Disease: A Quantitative Susceptibility Mapping Study. J Magn Reson Imaging, 2022. 56(3): p. 904-914.
Figures