2063
Association between white matter hyperintensities and altered cerebral blood flow in maintenance hemodialysis patients: a longitudinal study1Department of Radiology, Beijing Friendship Hospital, Capital Medical University, Beijing, China, 2GE HealthCare, MR Research, Beijing, China, Beijing, China
Synopsis
Keywords: White Matter, Kidney, hemodialysis
Motivation: The relationship between white matter hyperintensity (WMH) and altered cerebral blood flow (CBF) in maintenance hemodialysis patients remains unclear.
Goal(s): The study aims to explore the regulation of changes for CBF and its relationship with WMH burden in hemodialysis patients.
Approach: Hemodialysis patients were divided into two groups based on whether their CBF decreased after 3-year therapy. The severity of white matter hyperintensity was compared between the two groups.
Results: Compared with the increased CBF group, higher burden of deep WMH was found in the decreased CBF group.
Impact: This association between WMH and decrased CBF in maintenance hemodialysis be beneficial to the exploration of the complex mechanisms underlying the development of cerebral abnormalities during hemodialysis.
Introduction and Purpose
Hemodialysis is the most regulated replacement therapy performed in clinical practice for patients with End-stage renal disease (ESRD)1, which is accompanied by fluctuations in hemodynamics. In hemodialysis patients with ESRD, anemia induces increased cerebral blood flow (CBF) through the mechanism of brain self-regulation2. And CBF can decrease by about 7-22% during hemodialysis3, 4. Alternate changes in CBF between hemodialysis and rest may lead to the damage of brain tissue3, 5. Previous studies have revealed that hemodialysis patients with ESRD exhibit a number of brain abnormalities, notably the existence of white matter hyperintensity (WMH)6. However, the relationship between WMH and altered CBF in in maintenance hemodialysis patients remains unknown. In this study, we aimed to (1) evaluate the regulation of CBF alteration, and (2) explore the correlation between CBF and WMH.Materials and methods
Thirty-three hemodialysis patients who underwent two brain MRI examinations at an interval of three years and 33 age- and sex-matched healthy controls (HC) underwent structural and arterial spin-labeling MRI examinations (Figure 1). Brain MR scans were performed on a 3.0-Tesla MR system (Discovery MR750W). T1-weighted structural images, T2WI and T2FLAIR images were collected, moreover the 3D pseudo-continuous arterial spin-labeling (3D-PCASL) sequence was used for brain perfusion. CBF calculations were performed using SPM 12 software on the MATLAB platform (R2018b; MathWorks)7. WMH are classified as hyperintensities of the periventricular and deep white matter areas, which can be semi-quantitatively evaluated using the Fazekas visual rating scale 8, 9(Figure 2A-D). Intergroup differences in CBF in the grey matter, white matter, and whole brain were analyzed. Based on the changes in CBF between the baseline and follow-up groups, the hemodialysis patients were divided into two subgroups: an increased CBF group and a decreased CBF group. Differences in WMH between the subgroups and HC were analyzed.results
The CBF of grey matter, white matter, and whole brain showed no significant differences between hemodialysis follow-up patients and hemodialysis baseline patients (Figure 3A-C). The CBF values in the grey matter, white matter, and whole brain in the decreased CBF group were higher than those in the HC group at baseline (P < 0.025). However, the CBF in the decreased CBF group was lower than that in the HC group at follow-up (P < 0.025). The CBF values in the grey matter, white matter, and whole brain in the increased CBF group were lower than those in the HC group at baseline (P < 0.001). However, there was no significant difference for the CBF between the increased CBF group and the HC group at follow-up (P < 0.025). (Fig. 4A, B) The WMH scores in the deep white matter region progressed more in the decreased CBF group than in the increased CBF group, but no progression in the periventricular white matter area was found (Table 1).discussion
Compared to the HC group and the CBF increase group, patients in the decreased CBF group had a more obvious development of deep WMH. CBF fluctuations in patients undergoing hemodialysis play a key role in brain impairment in patients with renal disease. Although the increased CBF partially compensated for the oxygen supply in the brain tissue, the decreased oxygen-carrying capacity of the blood made the oxygen supply to the brain insufficient, eventually leading to brain tissue damage2. Moreover, CBF decreases during hemodialysis, which further worsens the oxygenation of brain tissue2, 3. Because there are fewer capillaries in the white matter than in the grey matter, brain injury in the white matter is more obvious, such as demyelination of the white matter and neuronal necrosis, which present as WMH in several types of researches7, 10, 11. Therefore, a decrease in CBF in patients undergoing hemodialysis may be an important factor in WMH.conclusion
In conclusion, we demonstrated that CBF in hemodialysis patients can be manifested as both increased and decreased, and the progression of WMH in patients with decreased CBF was more obvious with prolonged duration of hemodialysis.Acknowledgements
Funding: This work was supported by seed project No. YYZZ202129 from the Beijing Friendship Hospital, Capital Medical University (to Hao Wang), Beijing Scholar 2015 (to Zhenchang Wang), Beijing Hospitals Authority Clinical Medicine Development of Special Funding Support (ZYLX202101), and Beijing key Clinical Discipline Funding (No. 2021-135).References
1. Foley RN, Collins AJ. End-Stage Renal Disease in the United States. Journal of the American Society of Nephrology. 2007; 18(10): 2644-8.
2. Sprick JD, Nocera JR, Hajjar I, O'Neill WC, Bailey J, Park J. Cerebral blood flow regulation in end-stage kidney disease. Am J Physiol Renal Physiol. 2020; 319(5): F782-F91.
3. Findlay MD, Dawson J, Dickie DA, Forbes KP, McGlynn D, Quinn T, Mark PB. Investigating the Relationship between Cerebral Blood Flow and Cognitive Function in Hemodialysis Patients. J Am Soc Nephrol. 2019; 30(1): 147-58.
4. Polinder-Bos HA, Garcia DV, Kuipers J, Elting JWJ, Aries MJH, Krijnen WP, Groen H, Willemsen ATM, van Laar PJ, Strijkert F, Luurtsema G, Slart R, Westerhuis R, Gansevoort RT, Gaillard C, Franssen CFM. Hemodialysis Induces an Acute Decline in Cerebral Blood Flow in Elderly Patients. J Am Soc Nephrol. 2018; 29(4): 1317-25.
5. McIntyre CW, Goldsmith DJ. Ischemic brain injury in hemodialysis patients: which is more dangerous, hypertension or intradialytic hypotension? Kidney Int. 2015; 87(6): 1109-15.
6. Yeh YC, Kuo YT, Huang MF, Hwang SJ, Tsai JC, Kuo MC, Chen CS. Association of brain white matter lesions and atrophy with cognitive function in chronic kidney disease. Int J Geriatr Psychiatry. 2019; 34(12): 1826-32.
7. Wang H, Han X, Li M, Yang ZH, Liu WH, Wang ZC. Long-term hemodialysis may affect enlarged perivascular spaces in maintenance hemodialysis patients: evidence from a pilot MRI study. Quant Imaging Med Surg. 2022; 12(1): 341-53.
8. Fazekas F, Chawluk jb, Alavi A, Hurtig HI, Zimmerman RA. MR signal abnormalities at 1.5 T in Alzheimer’s dementia and normal aging.pdf. AJR Am J Roentgenol. 1987; 149(2): 351-6.
9. Smith EE, Saposnik G, Biessels GJ, Doubal FN, Fornage M, Gorelick PB, Greenberg SM, Higashida RT, Kasner SE, Seshadri S, American Heart Association Stroke C, Council on Cardiovascular R, Intervention, Council on Functional G, Translational B, Council on H. Prevention of Stroke in Patients With Silent Cerebrovascular Disease: A Scientific Statement for Healthcare Professionals From the American Heart Association/American Stroke Association. Stroke. 2017; 48(2): e44-e71.
10. Drew DA, Bhadelia R, Tighiouart H, Novak V, Scott TM, Lou KV, Shaffi K, Weiner DE, Sarnak MJ. Anatomic brain disease in hemodialysis patients: a cross-sectional study. Am J Kidney Dis. 2013; 61(2): 271-8.
11. Prohovnik I, Post J, Uribarri J, Lee H, Sandu O, Langhoff E. Cerebrovascular effects of hemodialysis in chronic kidney disease. J Cereb Blood Flow Metab. 2007; 27(11): 1861-9.
Figures
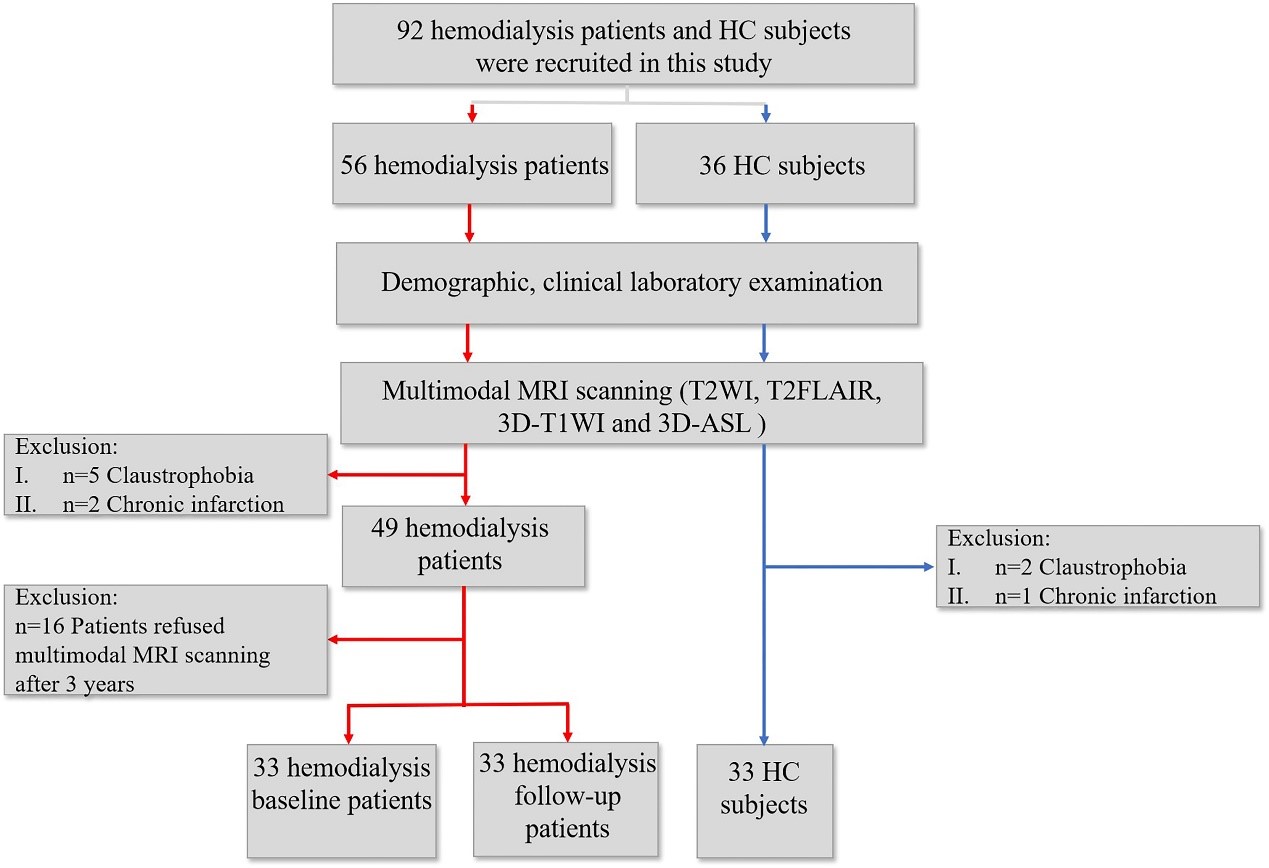
FIGURE 1 Flowchart of the enrollment of subjects.
HD = hemodialysis patients; HC = healthy controls; T2WI=T2-weighted image; T2FLAIR=T2-weighted-Fluid-Attenuated Inversion Recovery; T1WI=T1-weighted image; ASL = arterial spin labeling; CBF = cerebral blood flow
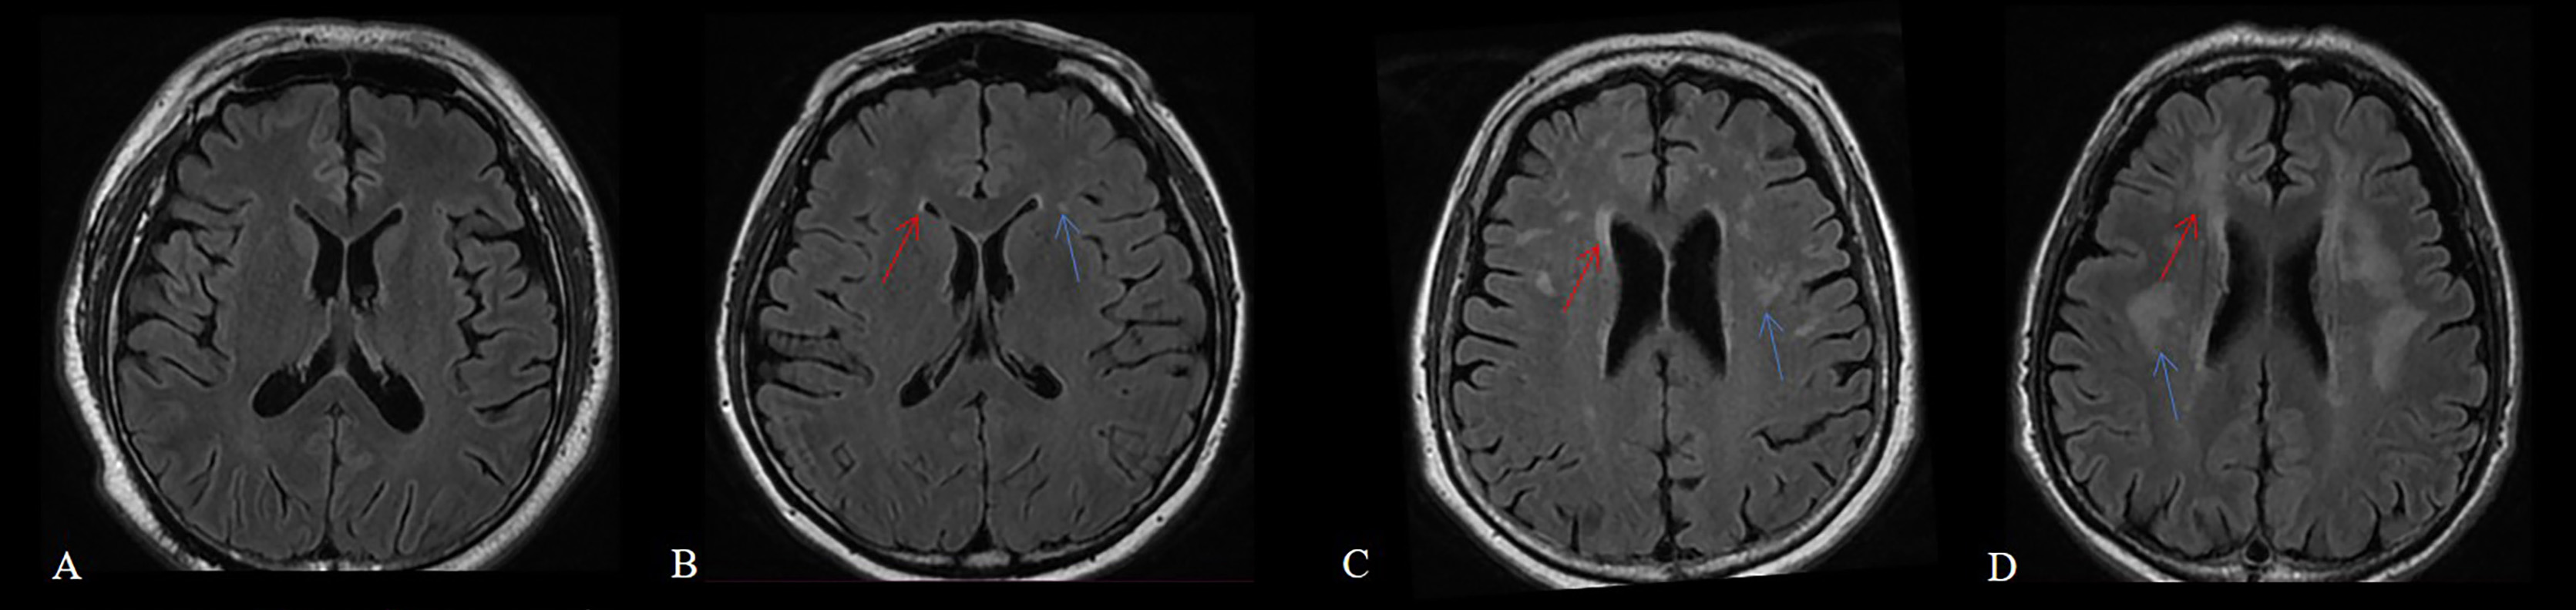
FIGURE 2 Examples of different categories of WMH scoring from 0 to 3 in the periventricular and deep white matter areas. T2FLAIR (A-D) showed the WMH in the periventricular (red arrow) and deep white matter areas (blue arrow), and from left to right, the scores went from 0 to 3 by the Fazekas visual rating scale. WMH = white matter hyperintensities
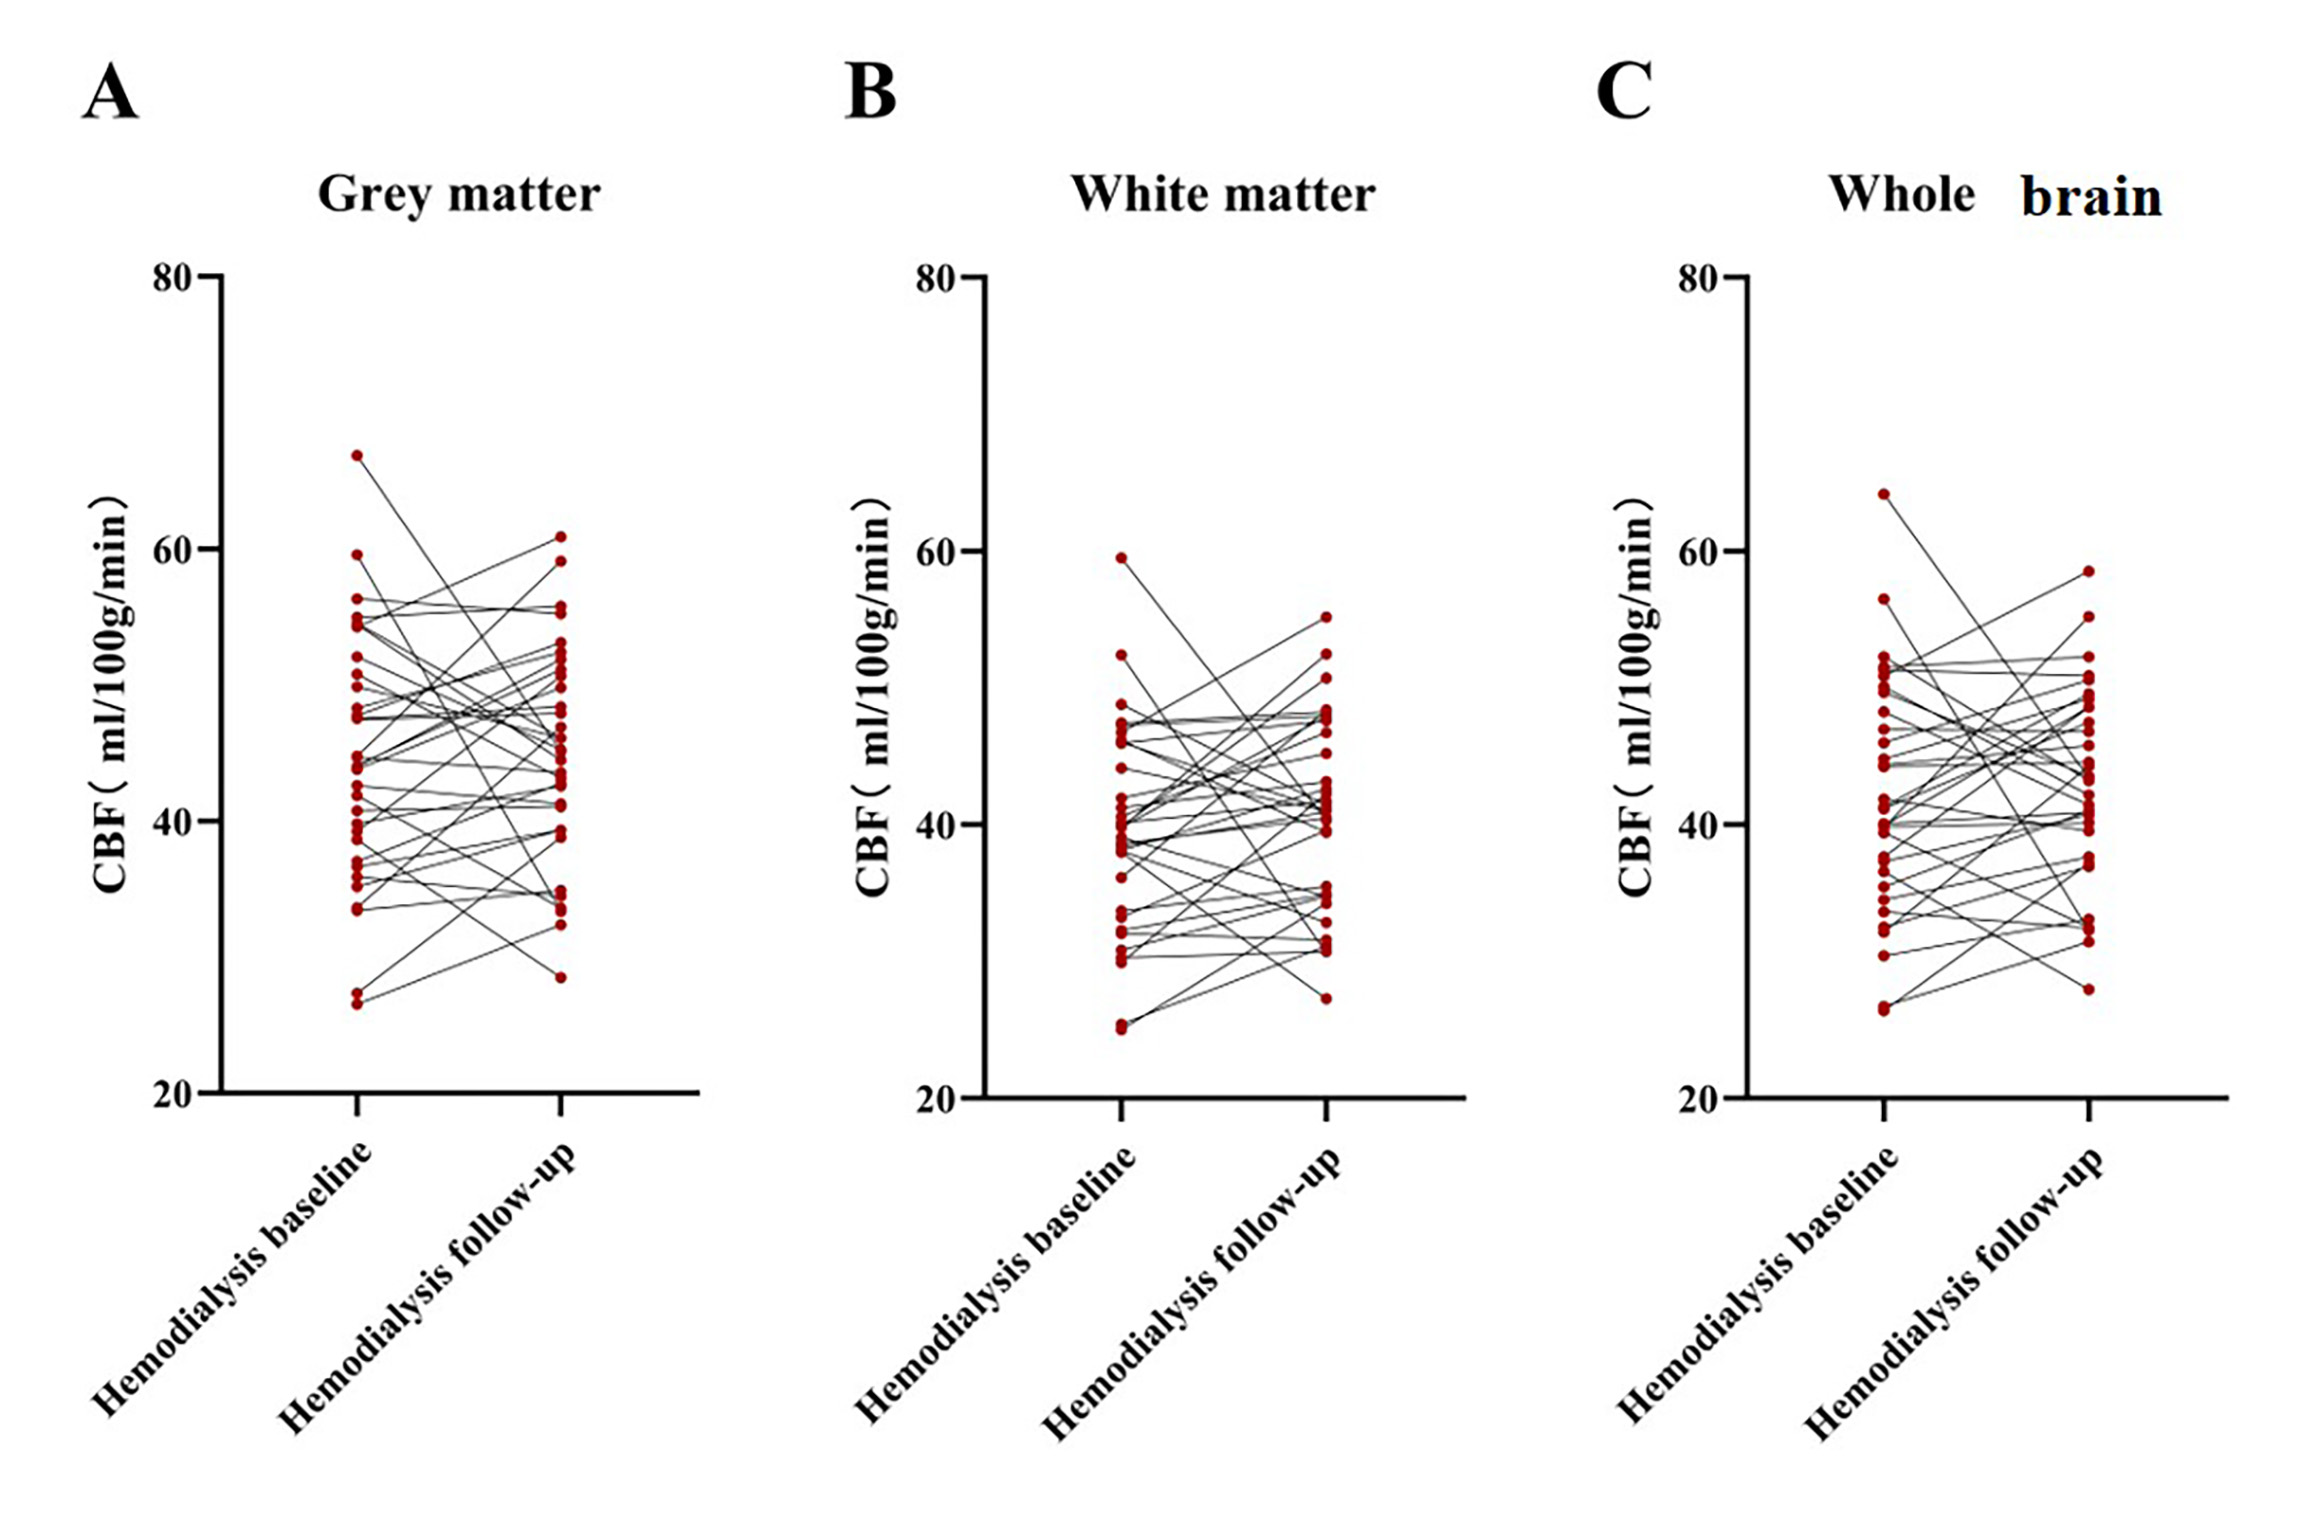
FIGURE 3 Comparison of CBF between the baseline and follow-up hemodialysis patients.
No difference for CBF between the baseline and follow-up hemodialysis patients was found in the grey matter (A), white matter (B) and whole brain (C). (P>0.05)
CBF = cerebral blood flow
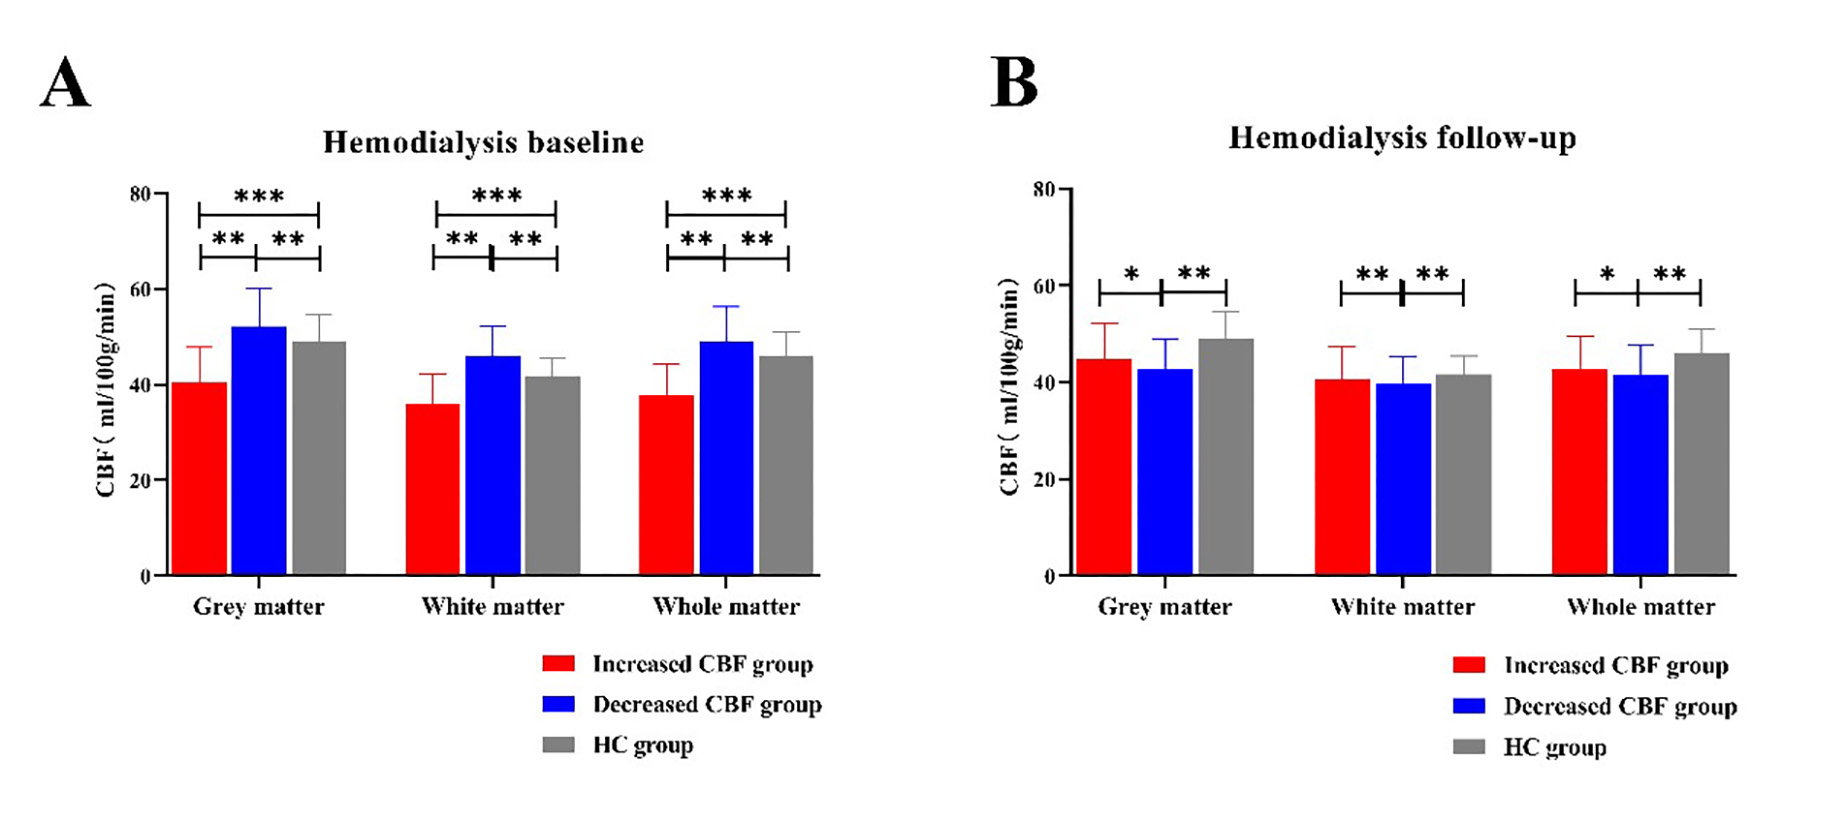
FIGURE 4 The measures of CBF among the grey matter, white matter, and whole brain in the hemodialysis baseline group and hemodialysis follow up group. ***, P < 0.001; **, P < 0.025; *, P < 0.05.
A. CBF of decreased CBF group in the grey matter, white matter and whole brain was higher than both increased CBF group (P <0.025) and HC group (P < 0.025) in hemodialysis baseline.
B. CBF of decreased CBF group in the grey matter, white matter and whole brain was lower than increased CBF group (P < 0.05) and lower than HC group (P < 0.025) in hemodialysis follow-up.
CBF = cerebral blood flow; HC = healthy controls
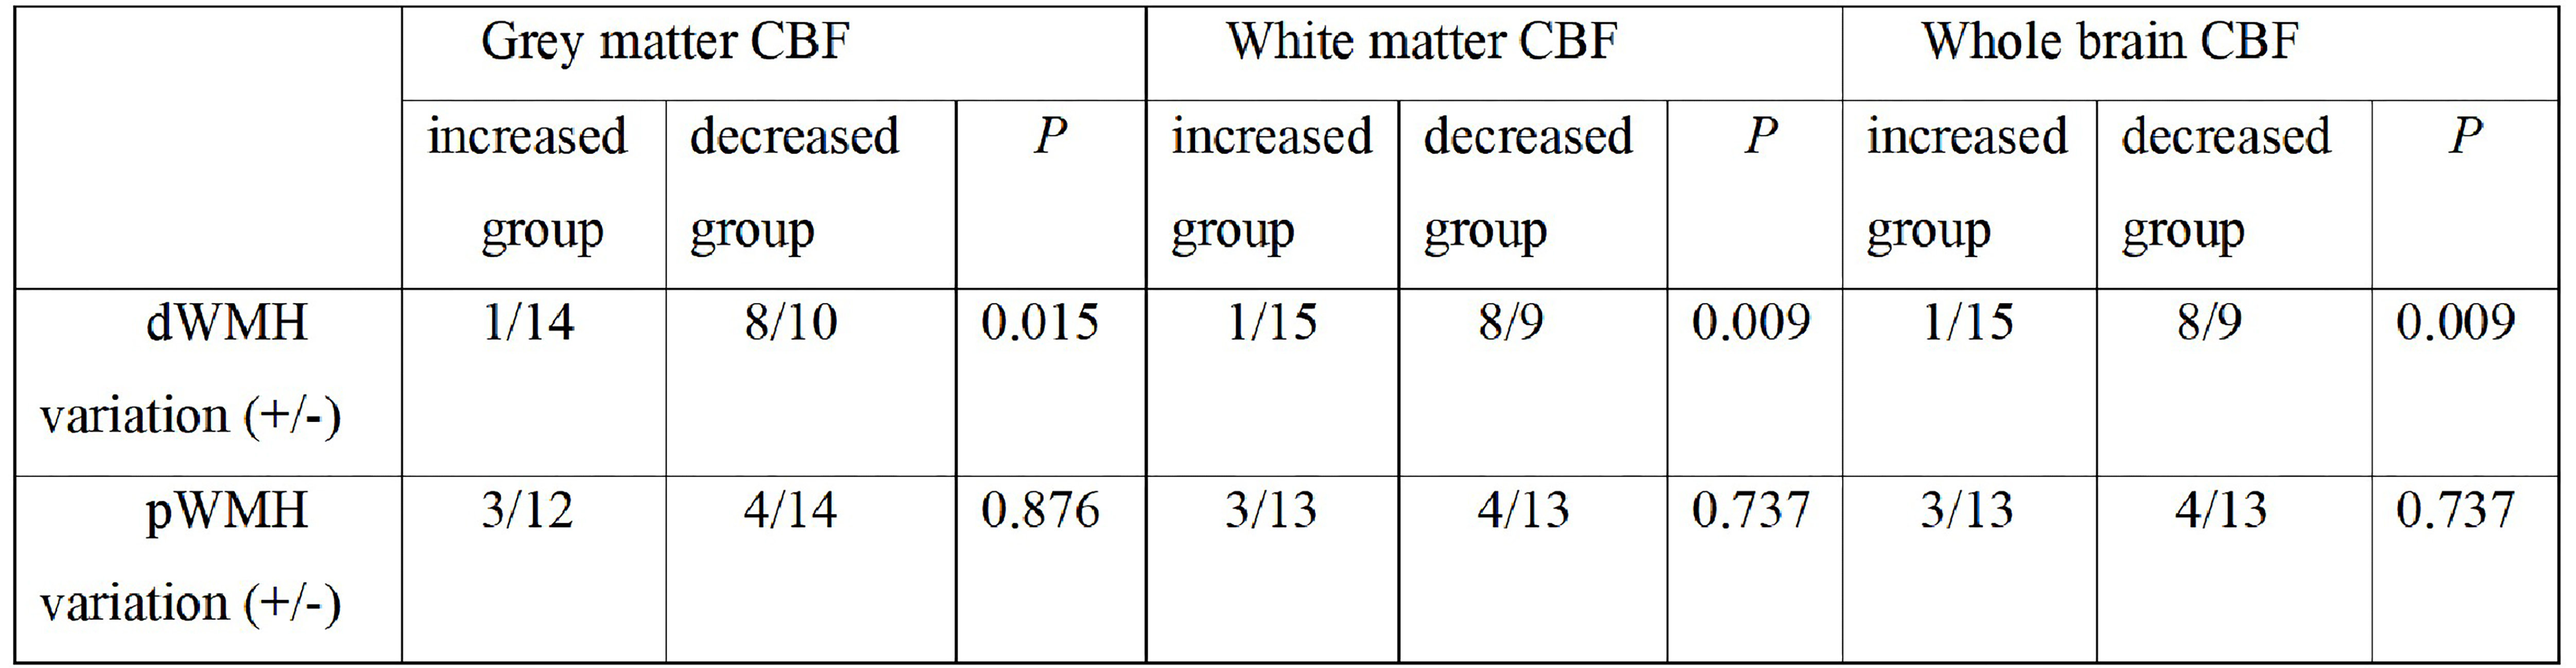
TABLE 1 The variations of WMH scores from baseline to follow-up between increased and decreased CBF hemodialysis patients
WMH = white matter hyperintensities; CBF = cerebral blood flow; dWMH = deep white matter hyperintensities; pWMH = periventricular white matter hyperintensities; (+/-) = (development of WMH/no development of WMH).