2061
More Features in the Mahalanobis Distance Lead to Improved Diagnostic Classification of Autistic and Non-autistic Individuals1University of Wisconsin - Madison, Madison, WI, United States, 2University of Utah, Salt Lake City, UT, United States, 3University of Florida, Gainesville, FL, United States
Synopsis
Keywords: White Matter, Brain, Autism Spectrum Disorder, Precision Medicine, Replicability
Motivation: Heterogeneity of neuroimaging findings remains a challenge to identify specific brain-related phenotypes in ASD. Quantitative metrics of individual deviation across brain measurements are needed for parsing variation and identifying individuals who may or may not have abnormal brain structure.
Goal(s): This study aims to quantify individual brain differences in individuals with and without ASD.
Approach: We investigated the Mahalanobis distance to characterize multidimensional brain measures of microstructure in individuals with and without ASD in a set of white matter regions.
Results: We found multivariate Mahalanobis distance is superior to univariate comparisons at distinguishing between individuals with and without ASD.
Impact: Normative modeling and multivariate approaches may provide informative metrics for parsing heterogeneity in the multivariate patterns of brain development in autistic individuals.
Introduction
The broad individual variability in clinical and etiological aspects of autism spectrum disorder (ASD) remains a daunting challenge to accurately understand and, thus, effectively treat this disorder. Over the last decades, the field has been converging to the view that identification of robust biomarkers and development of effective treatment requires parsing variation across clinical, behavioral, genetic, and neurobiological domains. Multivariate relationships of the brain may enable better characterization and discrimination of individuals with ASD. Distinguishing these multidimensional brain relationships at both the group and individual level are therefore critical as characterization may be informative for identifying ASD subgroups as well as understanding individual brain variation in ASD.Here, we used the Mahalanobis distance1 (MaD), the multivariate normal extension of the standard score, to quantify individual brain variation in autistic and non-autistic individuals. A similar study was previously published with earlier data from the same participants,2 thus this is a replication study. MaD is constructed as the distance from a typically developing control (TD) sample mean in multivariate normal space relative to the TD covariance. In this study we employed age trajectories of microstructural brain development to estimate MaD at the individual level and compare the distributions of brain variability between ASD and TD individuals.
Methods
Data: 176 participants (86 ASD, 90 TD) 12.33 to 57.92 years of age were included in this study. Scans were acquired on a 3 Tesla Siemens Prisma scanner and consisted of structural T1-weighted (MP-RAGE) and 1.5 mm isotropic diffusion tensor imaging 3(DTI) data. Diffusion-weighted images were corrected for distortion and head motion and tensors were subsequently fit with NLLS using the Dipy Python library4.Analysis: Average Fractional Anisotropy (FA), Mean Diffusivity (MD), first (L1) and third (L3) eigenvalues were extracted from a subset of regions in the JHU5,6 white matter atlas previously reported in a similar study of ASD2. These regions of interest (ROIs) included: genu, body, and splenium of the corpus callosum; superior longitudinal fasciculus, internal capsules (anterior and posterior portions); corticospinal tract; uncinate fasciculus; cingulum; superior fronto-occipital fasciculus; and sagittal straetum (i.e. inferior longitudinal fasciculus and inferior fronto-occipital fasciculus). Left and right homologous pairs were used when available adding to a total of 19 ROIs examined.
Generalized additive mixed models (GAMMs) were fit to the regional developmental trajectories of the DTI parameters (FA, MD, L1, and L3) of the TD group to establish a normative growth trajectory for each brain region. The models from the TD group were used to predict FA, MD, L1, and L3 along the modeled TD growth trajectory for every ASD participant and for each brain region. The difference between the participants' parameter values from these predicted values (i.e. the model residuals) were calculated and normalized by the covariance matrix of fit residuals, forming the Mahalanobis distance1,2. The effects of the number and type of DTI parameters on the MaD were evaluated.
Results
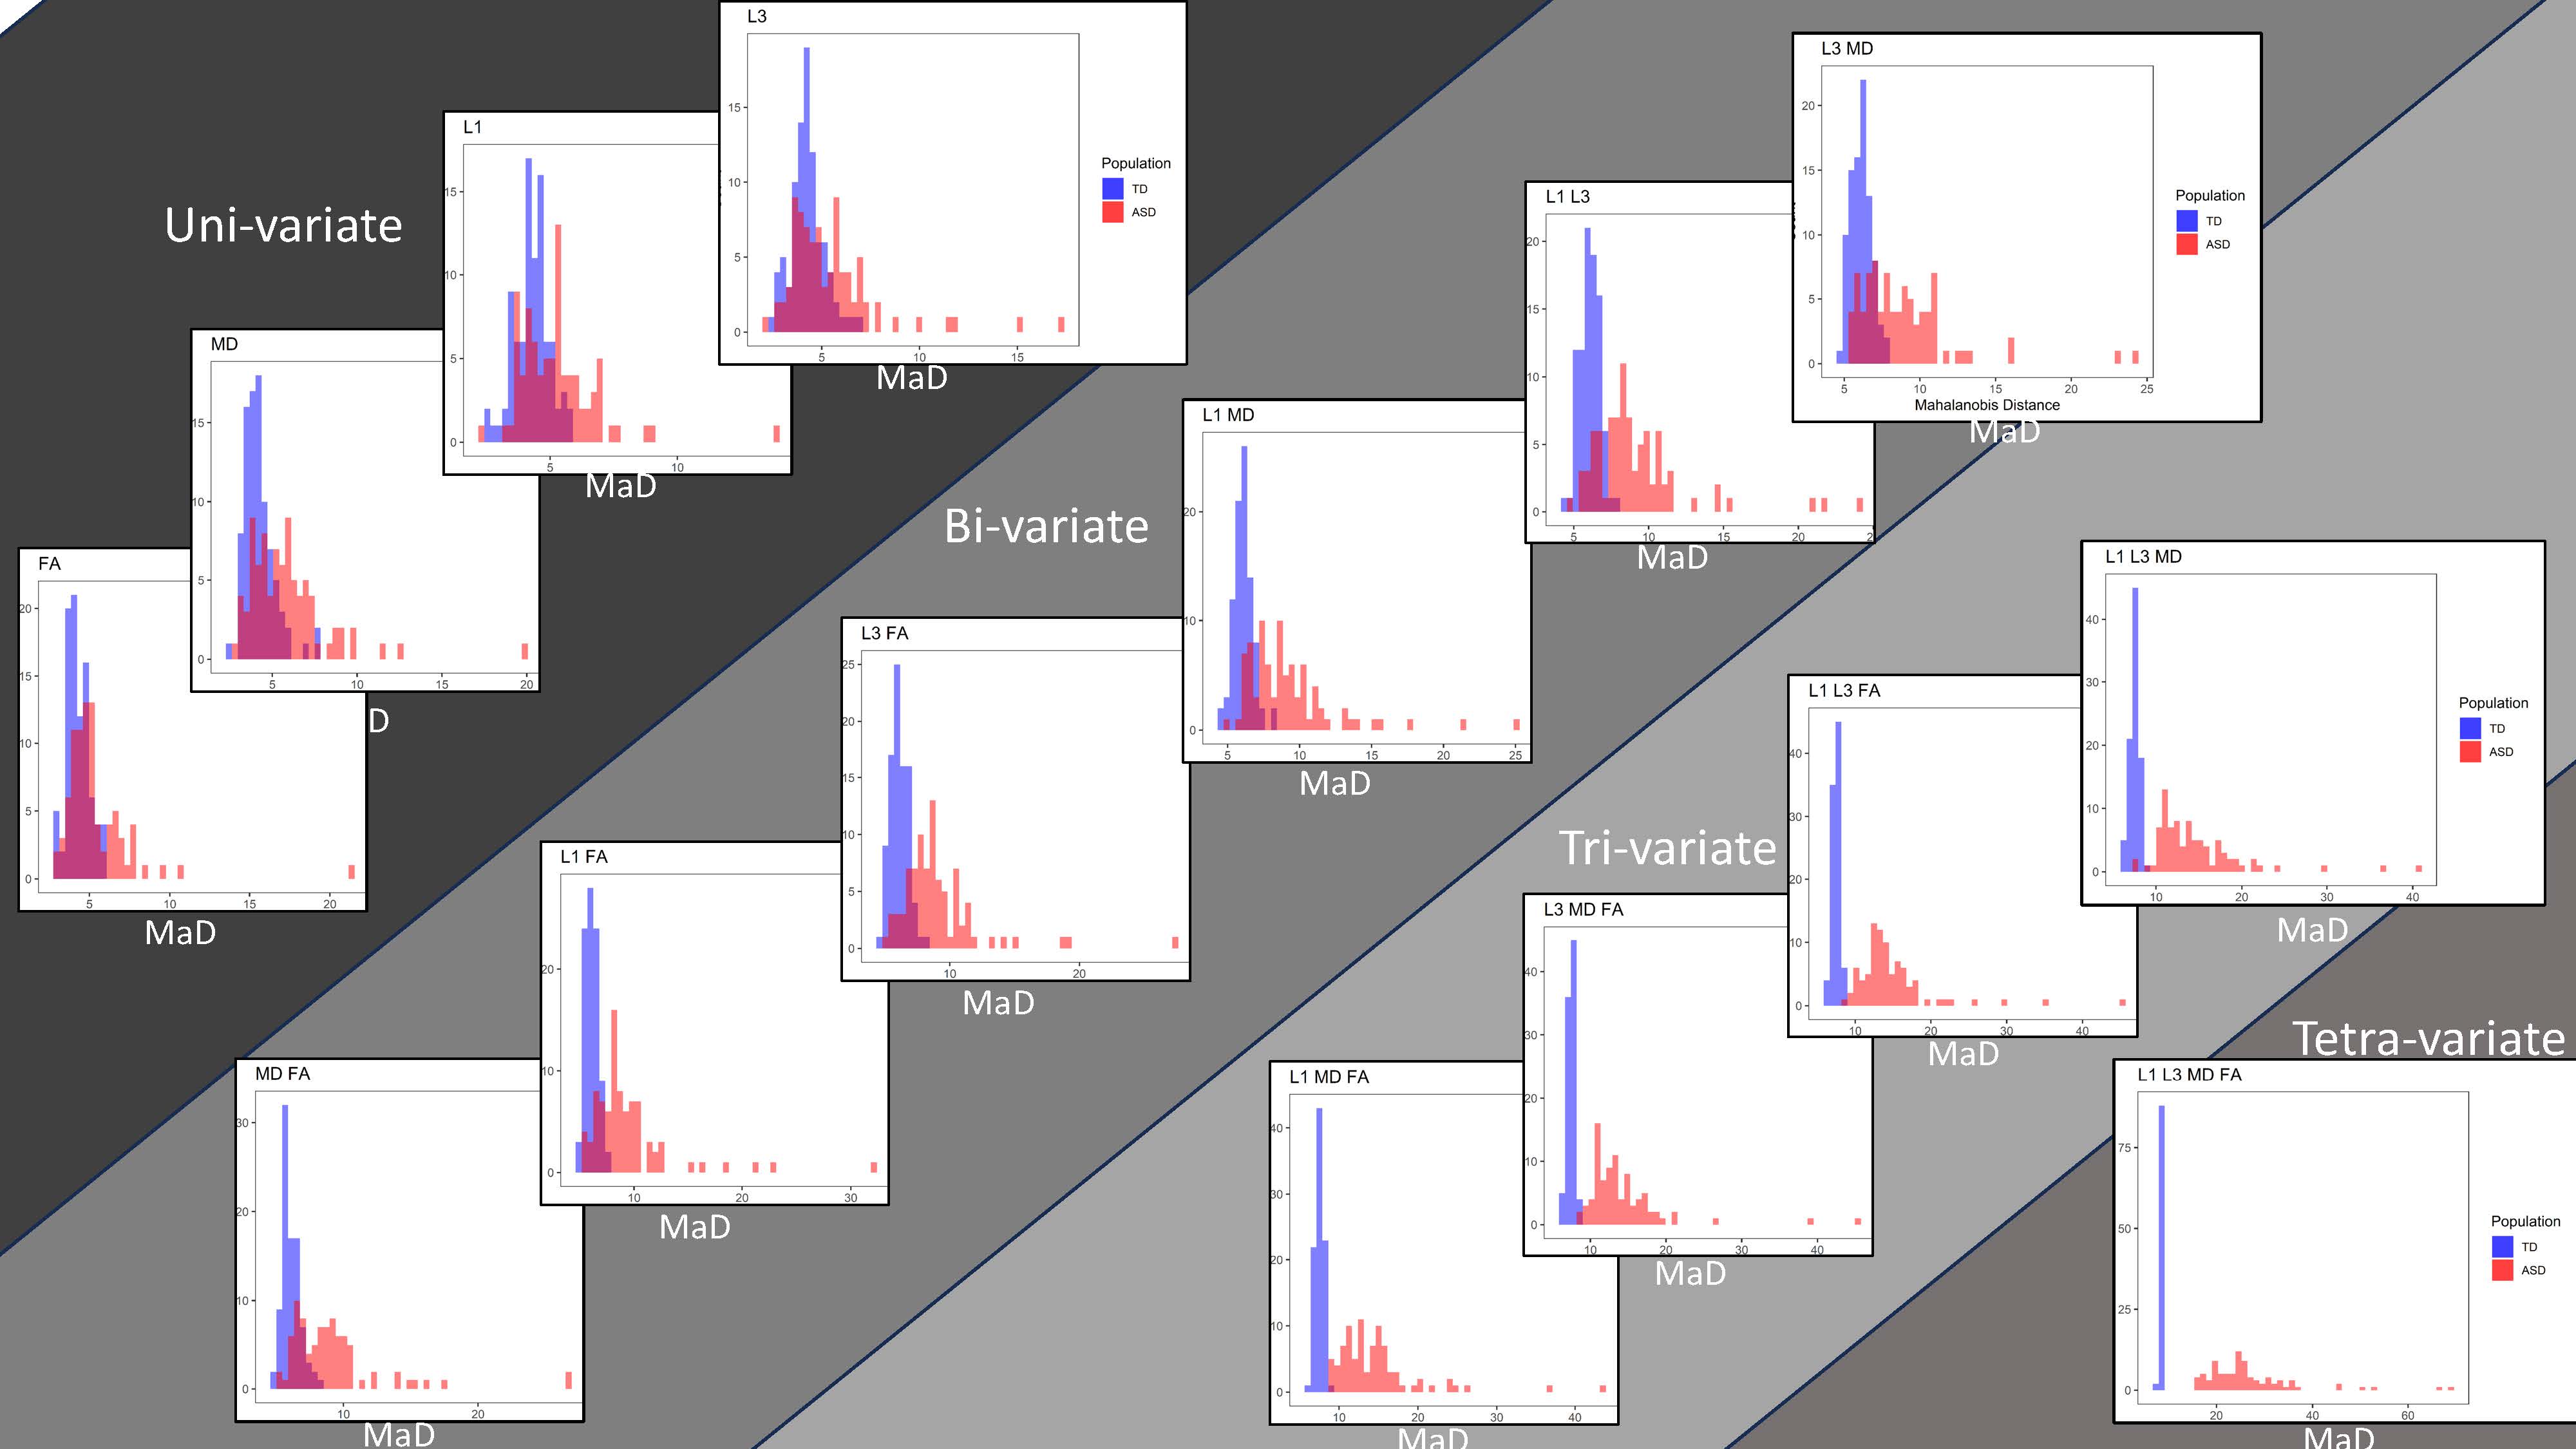
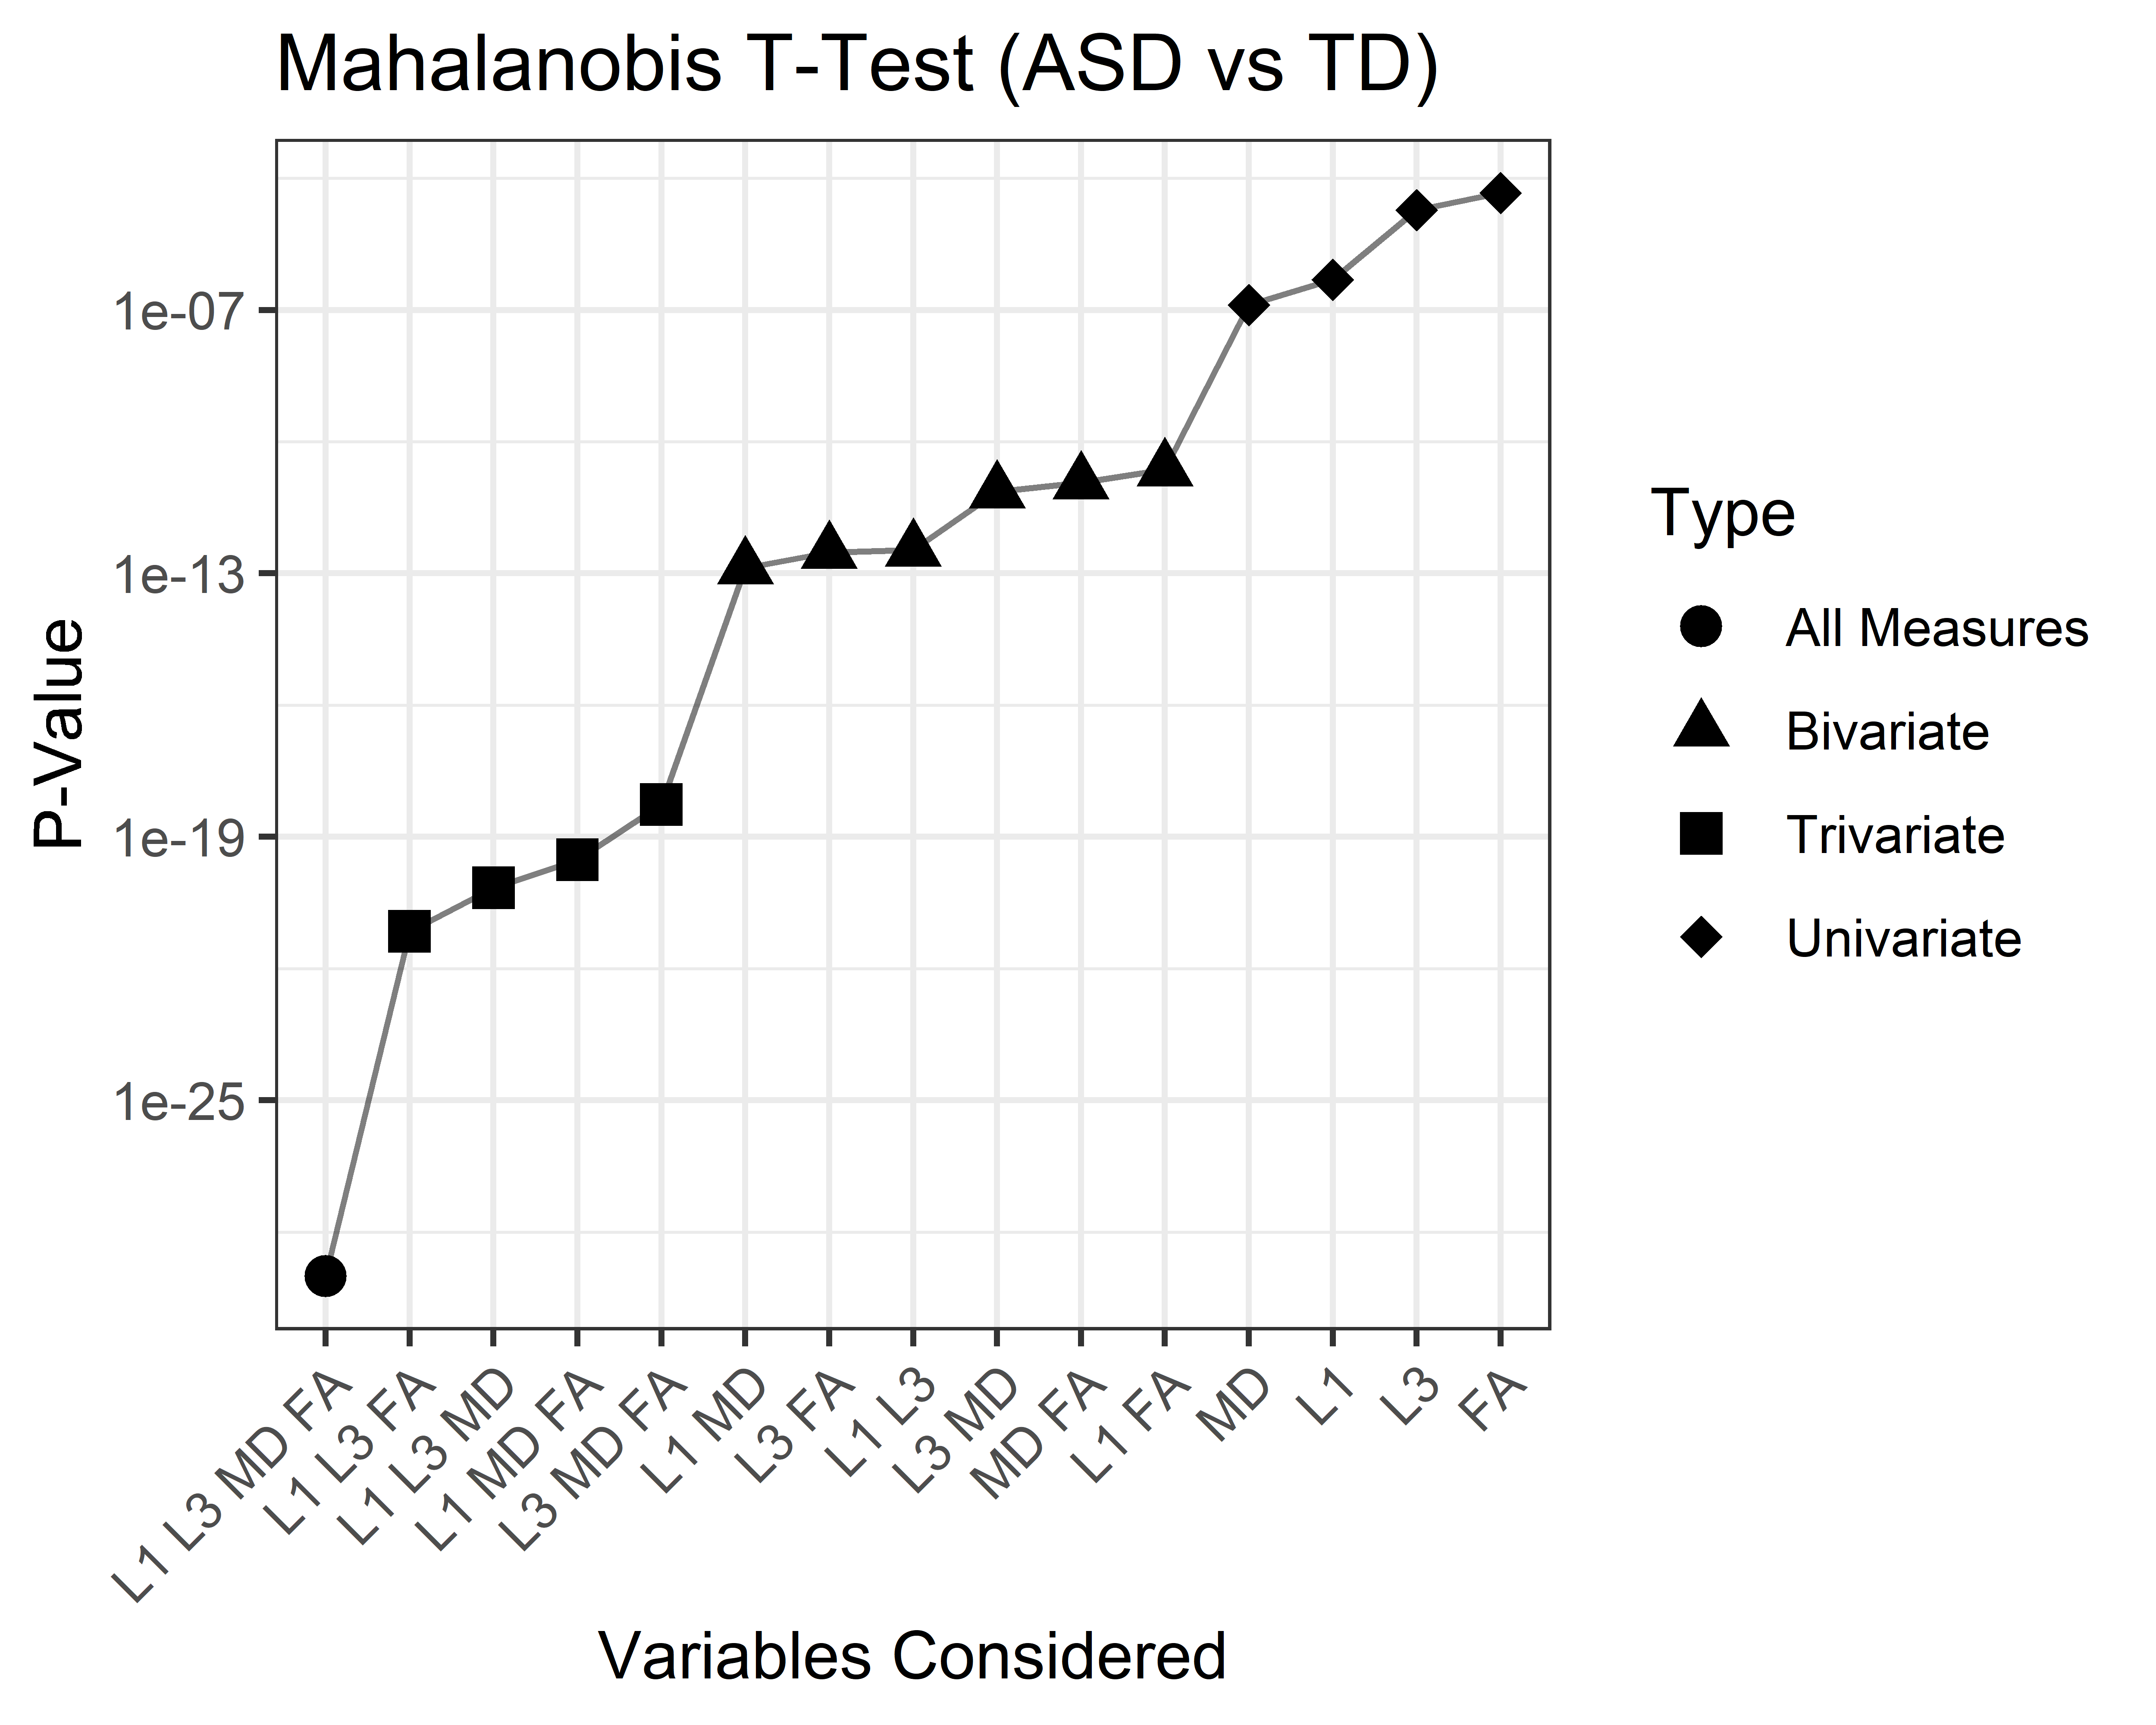
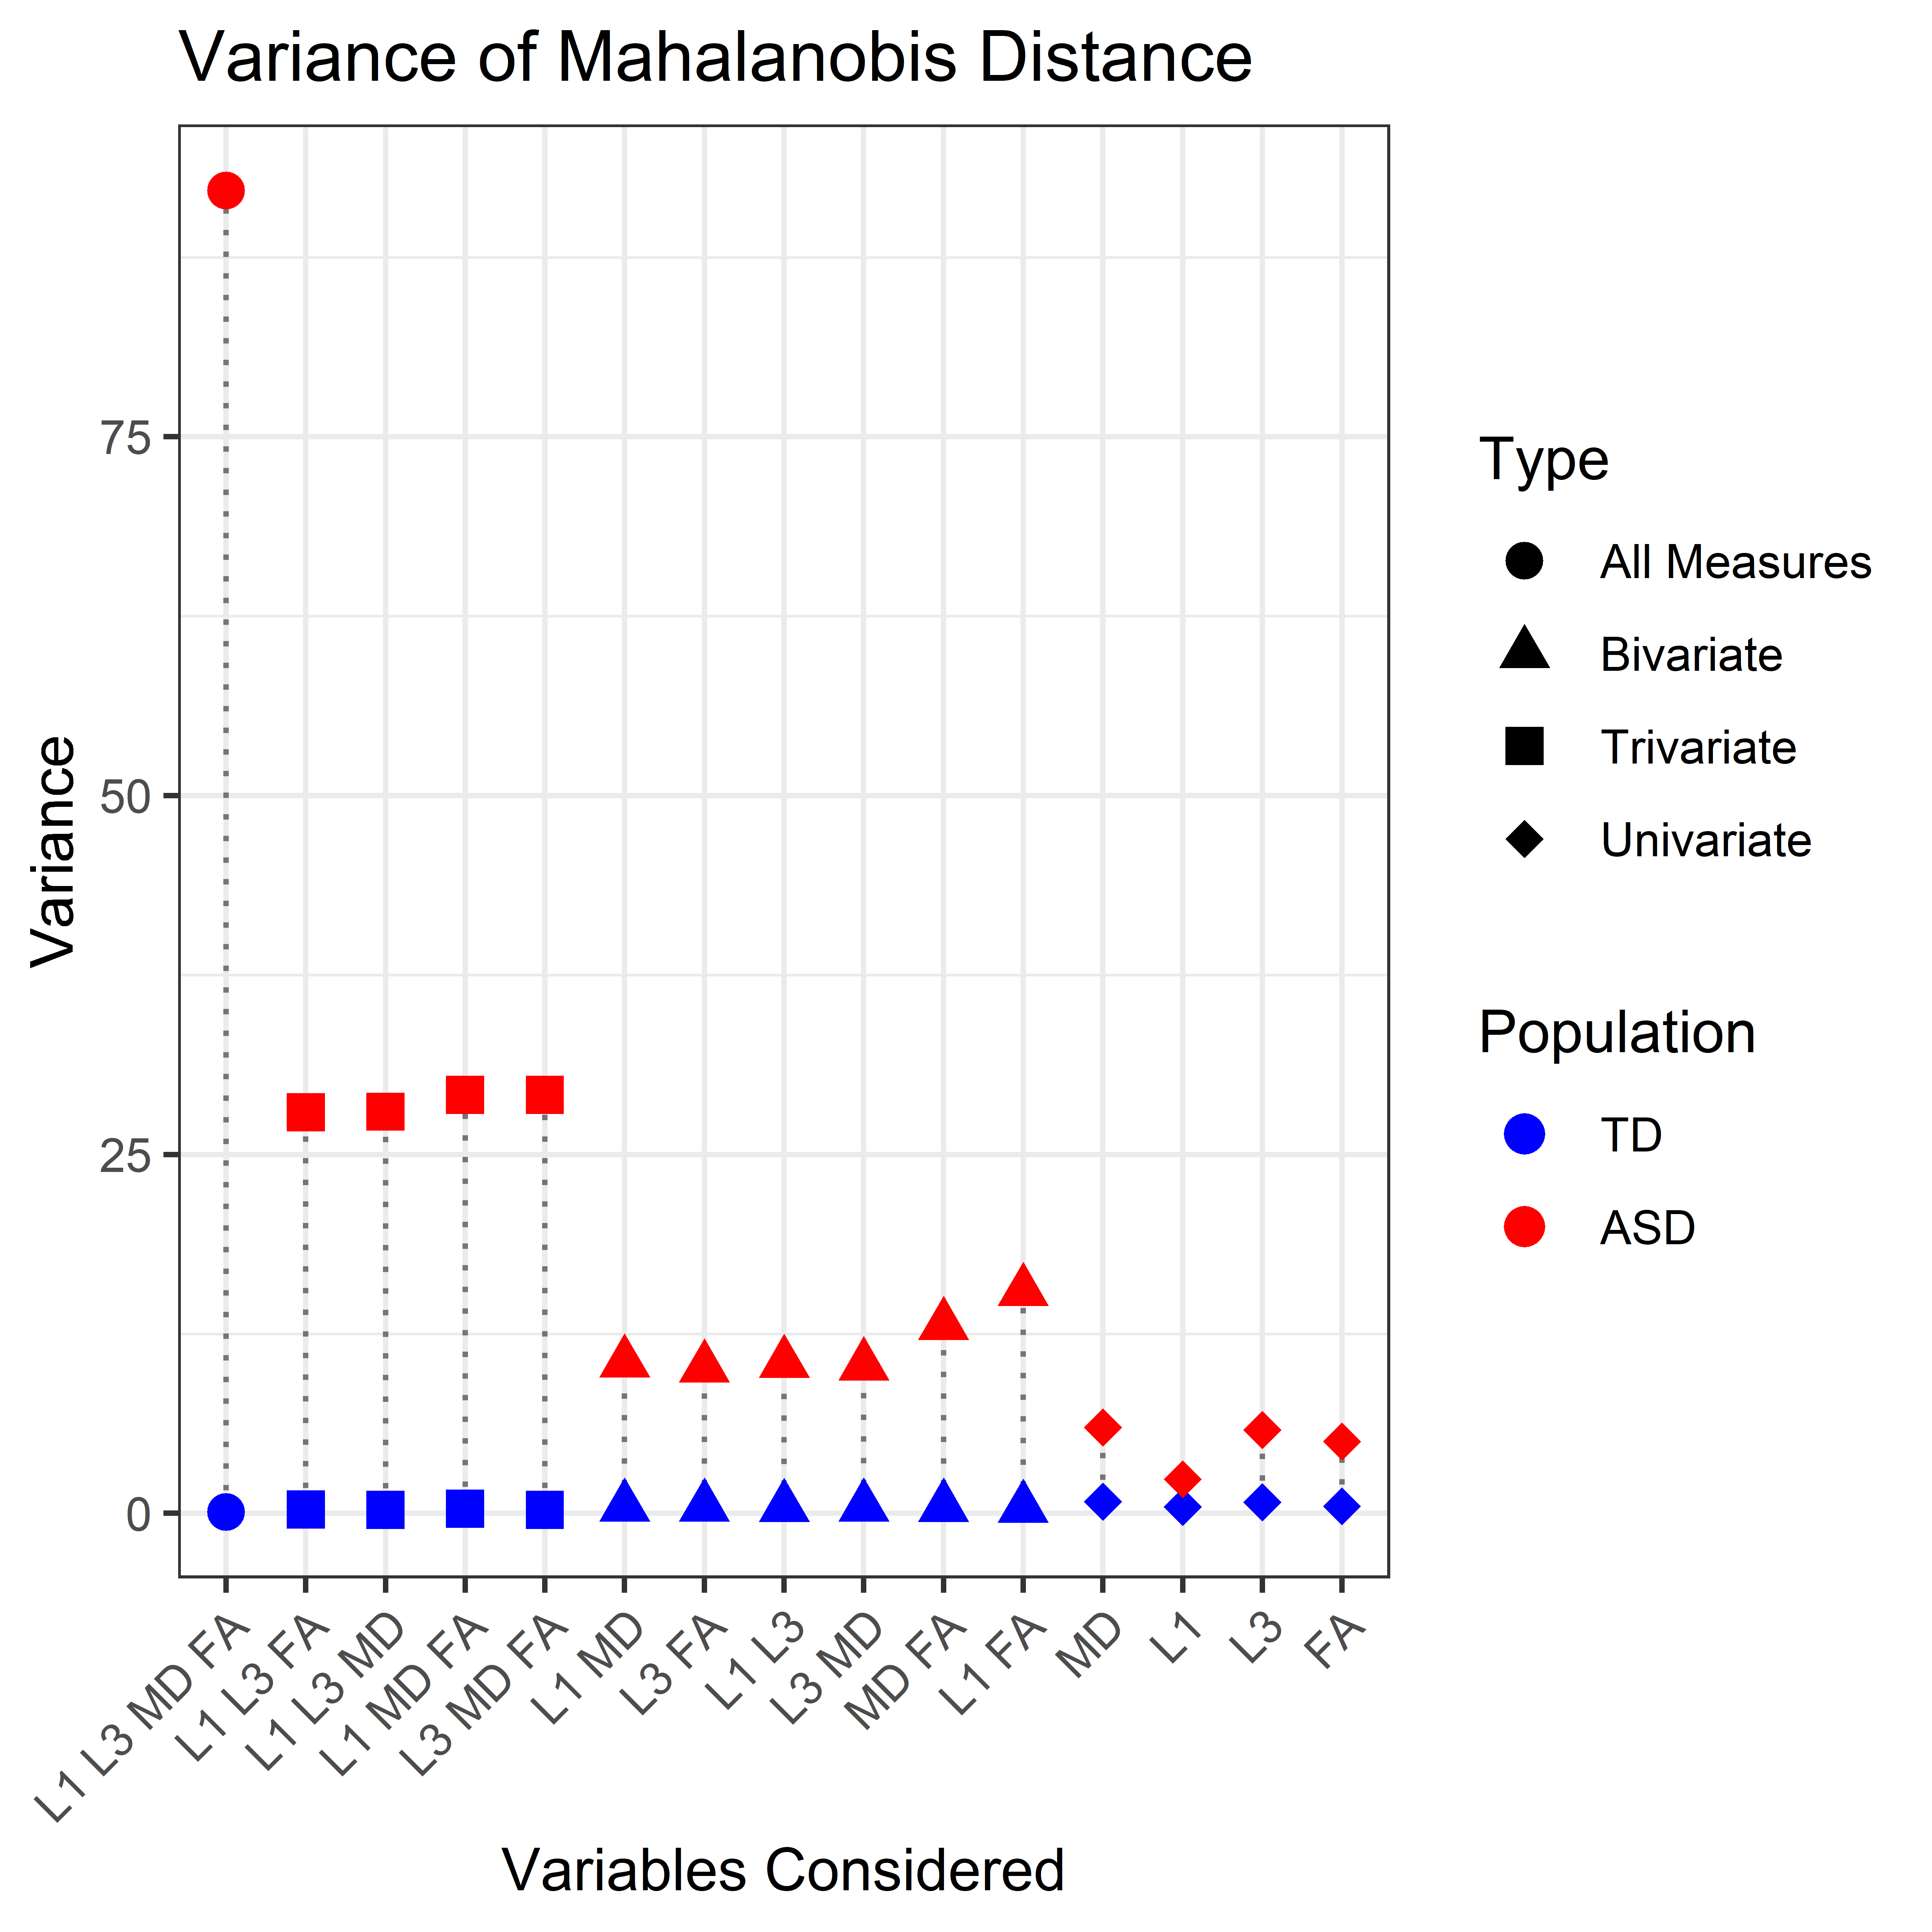
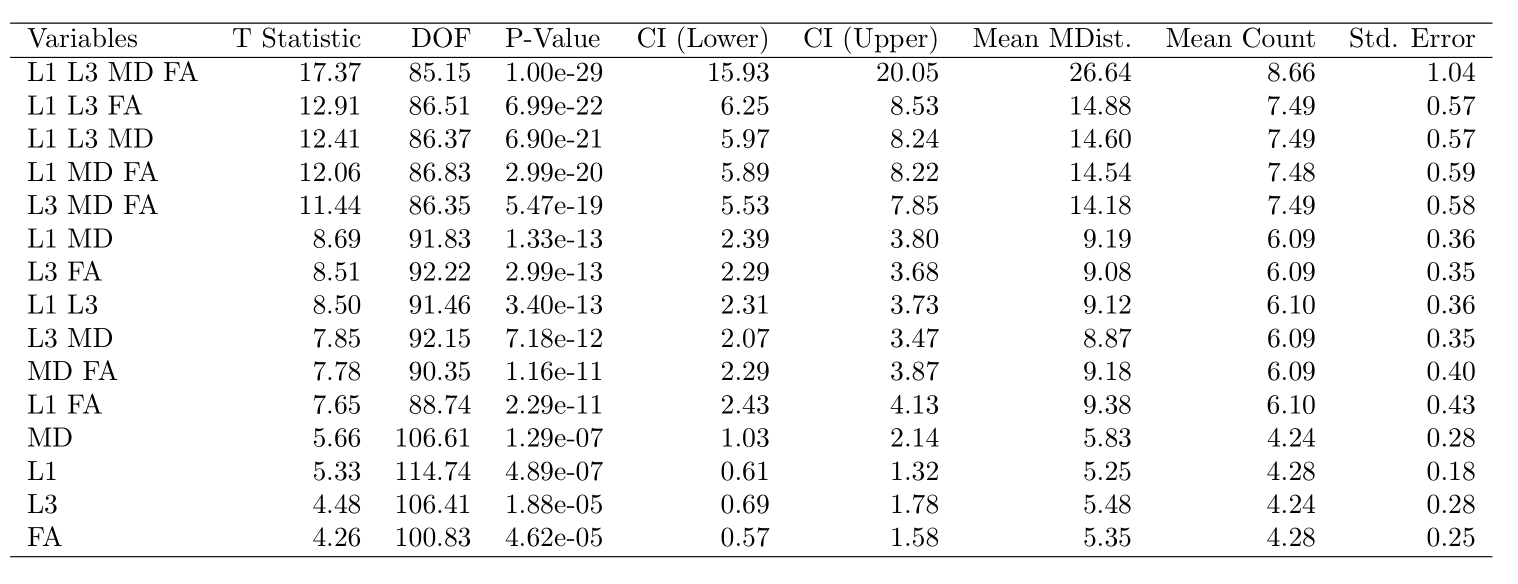
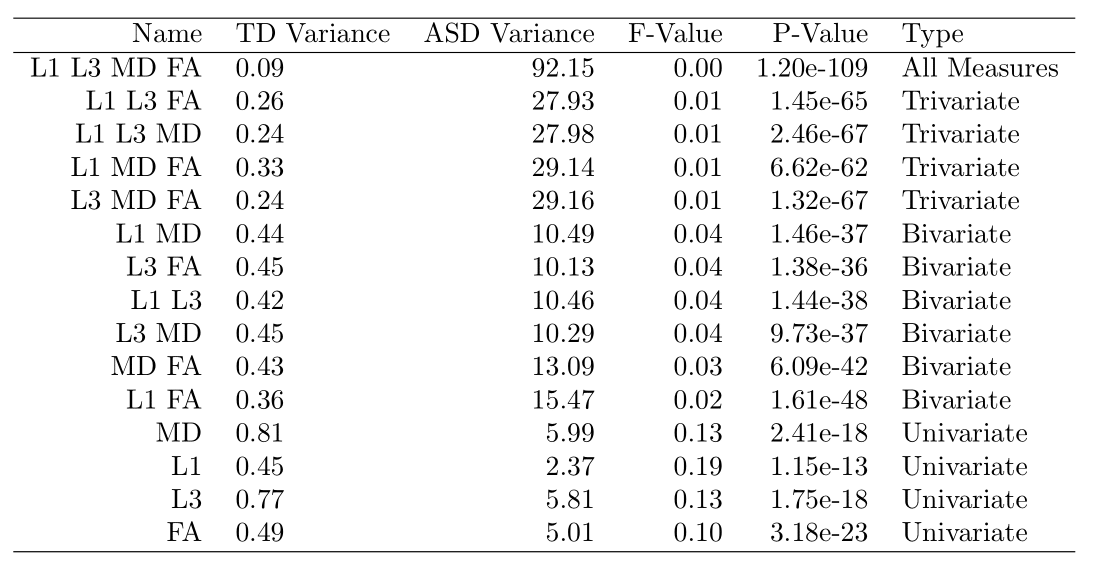
Fig. 1 shows the distributions of MaD calculated from the ASD and TD groups for different combinations and number of DTI features. Qualitatively, we notice differential patterns between individuals with and without ASD. The ASD distributions of MaD are evidently shifted rightward for all multivariate versions of the MaD, indicating larger multivariate brain deviation compared to the TD group. The overlap between ASD and TD MaD distribution appears to decrease as more features are included, with the largest difference occurring for the case that includes all DTI measures. This is confirmed by statistically comparing these distributions (Fig.2-Table-1). We find the means of the ASD distribution are significantly larger (p<0.0001) than the means of the TD distribution (Table-1). Further, the variance of MaD was found to be larger in the ASD group compared to the TD group (Fig.3-Table-2), underscoring the heterogeneity across the ASD population.Discussion
These results replicate the observations from a previous study that investigated MaD differences between ASD and TD2. While univariate measures may provide informative insight to specific brain regions and biological mechanisms implicated in ASD, consideration of the multivariate relationships of the brain may enable better characterization and discrimination of individuals with ASD. This analysis focused on using mixed effects modeling and the Mahalanobis distance to quantify brain differences in multivariate brain measures for autistic and non-autistic individuals. Results suggest that the distribution of Mahalanobis distances in ASD individuals is larger and more variable compared to TD individuals. Further, our findings suggest that the Mahalanobis distance depends on differing number, and, to a lesser degree, type of parameters used. This may be useful and warrants further exploration for identifying possible subgroups of autism.
Acknowledgements
We would like to acknowledge our institutional support and funding sources:
NIH R00 MH11056
NIH R01 HD108868
NIH R01 MH132218
NIH P50 HD105353
NIH R01 MH080826
UW Medical Physics T32 Radiological Sciences Training Grant 5T32CA009206-44
The Waisman Center
References
1. Mahalanobis, P. C. On the generalized distance in statistics. Natl. Inst. Sci. India II, (1936).
2. Dean, D. C. et al. Multivariate characterization of white matter heterogeneity in autism spectrum disorder. NeuroImage Clin. 14, 54–66 (2017).
3. Alexander, A. L., Lee, J. E., Lazar, M. & Field, A. S. Diffusion tensor imaging of the brain. Neurother. J. Am. Soc. Exp. Neurother. 4, 316–329 (2007).
4. Garyfallidis, E. et al. Dipy, a library for the analysis of diffusion MRI data. Front. Neuroinformatics 8, (2014).
5. Mori, S., Wakana, S., van Zijl, P. C. M. & Nagae-Poetscher, L. M. MRI Atlas of Human White Matter. (Elsevier Science, 2005).
6. Oishi, K. et al. Human brain white matter atlas: Identification and assignment of common anatomical structures in superficial white matter. NeuroImage 43, 447–457 (2008).Figures