2059
Longitudinal Analysis of White Matter Lesions in Multiple Sclerosis using Mixture Modeling at 7 Tesla1NINDS, NIH/Oxford, Bethesda, MD, United States, 2Nuffield Department of Clinical Neurosciences, Oxford University, Oxford, United Kingdom, 3NINDS, NIH, Bethesda, MD, United States, 4Department of Psychiatry, Oxford University, Oxford, United Kingdom, 5NIH, Bethesda, MD, United States
Synopsis
Keywords: Radiomics, Modelling, Mixture-Modeling, White Matter Lesions
Motivation: Analyzing multiple sclerosis (MS) lesions longitudinally is challenging, and requires consistent and robust imaging, processing, and statistical methods. Conventional binary lesion segmentations might overlook significant pathology changes as degeneration is continuous.
Goal(s): To track subtle changes in MS lesions using statistically derived metrics.
Approach: We introduced a two-component Mixture Model (MM) to track longitudinal changes qT1 with regions of interest (ROIs) and compared it with conventional image metrics.
Results: In our longitudinal analysis, the MM approach uncovered changes missed by traditional methods suggesting MM may help capture and understand longitudinal evolution of MS lesions.
Impact: Our novel mixture modeling analysis approach may untangle unique aspects of biological processes in MS lesion evolution, offering a valuable alternative to conventional image analysis methods.
Introduction
Quantitative T1 (qT1) mapping is highly sensitive to pathological changes in Multiple Sclerosis (MS) lesions1-3. However, longitudinal analyses of MS lesions are challenging because they depend on consistent and robust imaging, processing, and statistical methods. Commonly used, binary lesion segmentations may miss interesting and important changes in pathology, especially in tissue surrounding the visible lesion, as tissue degeneration occurs along a continuum. Mixture Modeling (MM) identifies distinct distributions within a dataset, like a lesion's penumbra and core, by modeling it as a combination of probability distributions4.We investigated the utility of fitting MM to qT1 statistically derived markers of pathophysiology within a visible lesion (lesion core) and its penumbra (lesion penumbra), together referred to as the “lesional ROI”. We explored whether and how these markers change over time in the lesion core and lesion penumbra compared to conventional analyses.
Methods
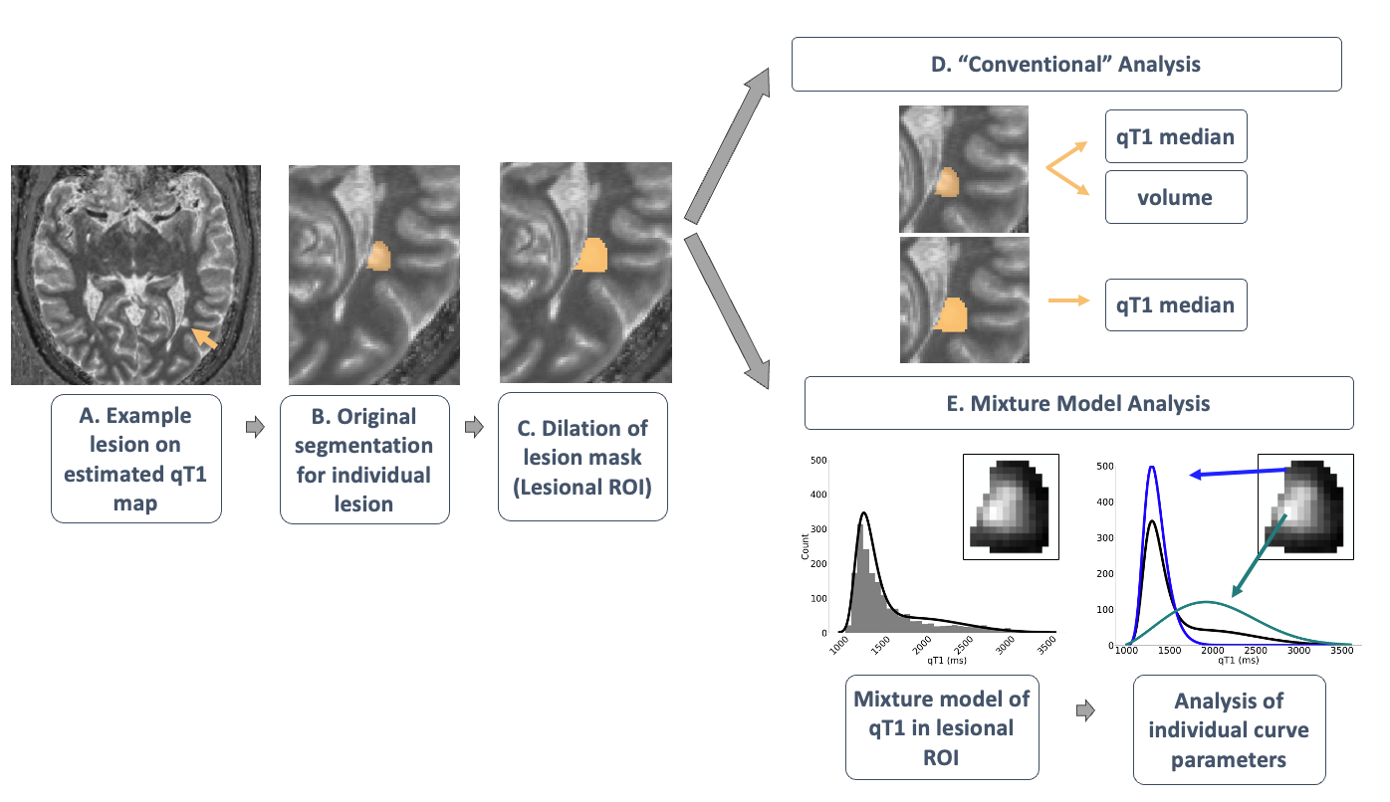
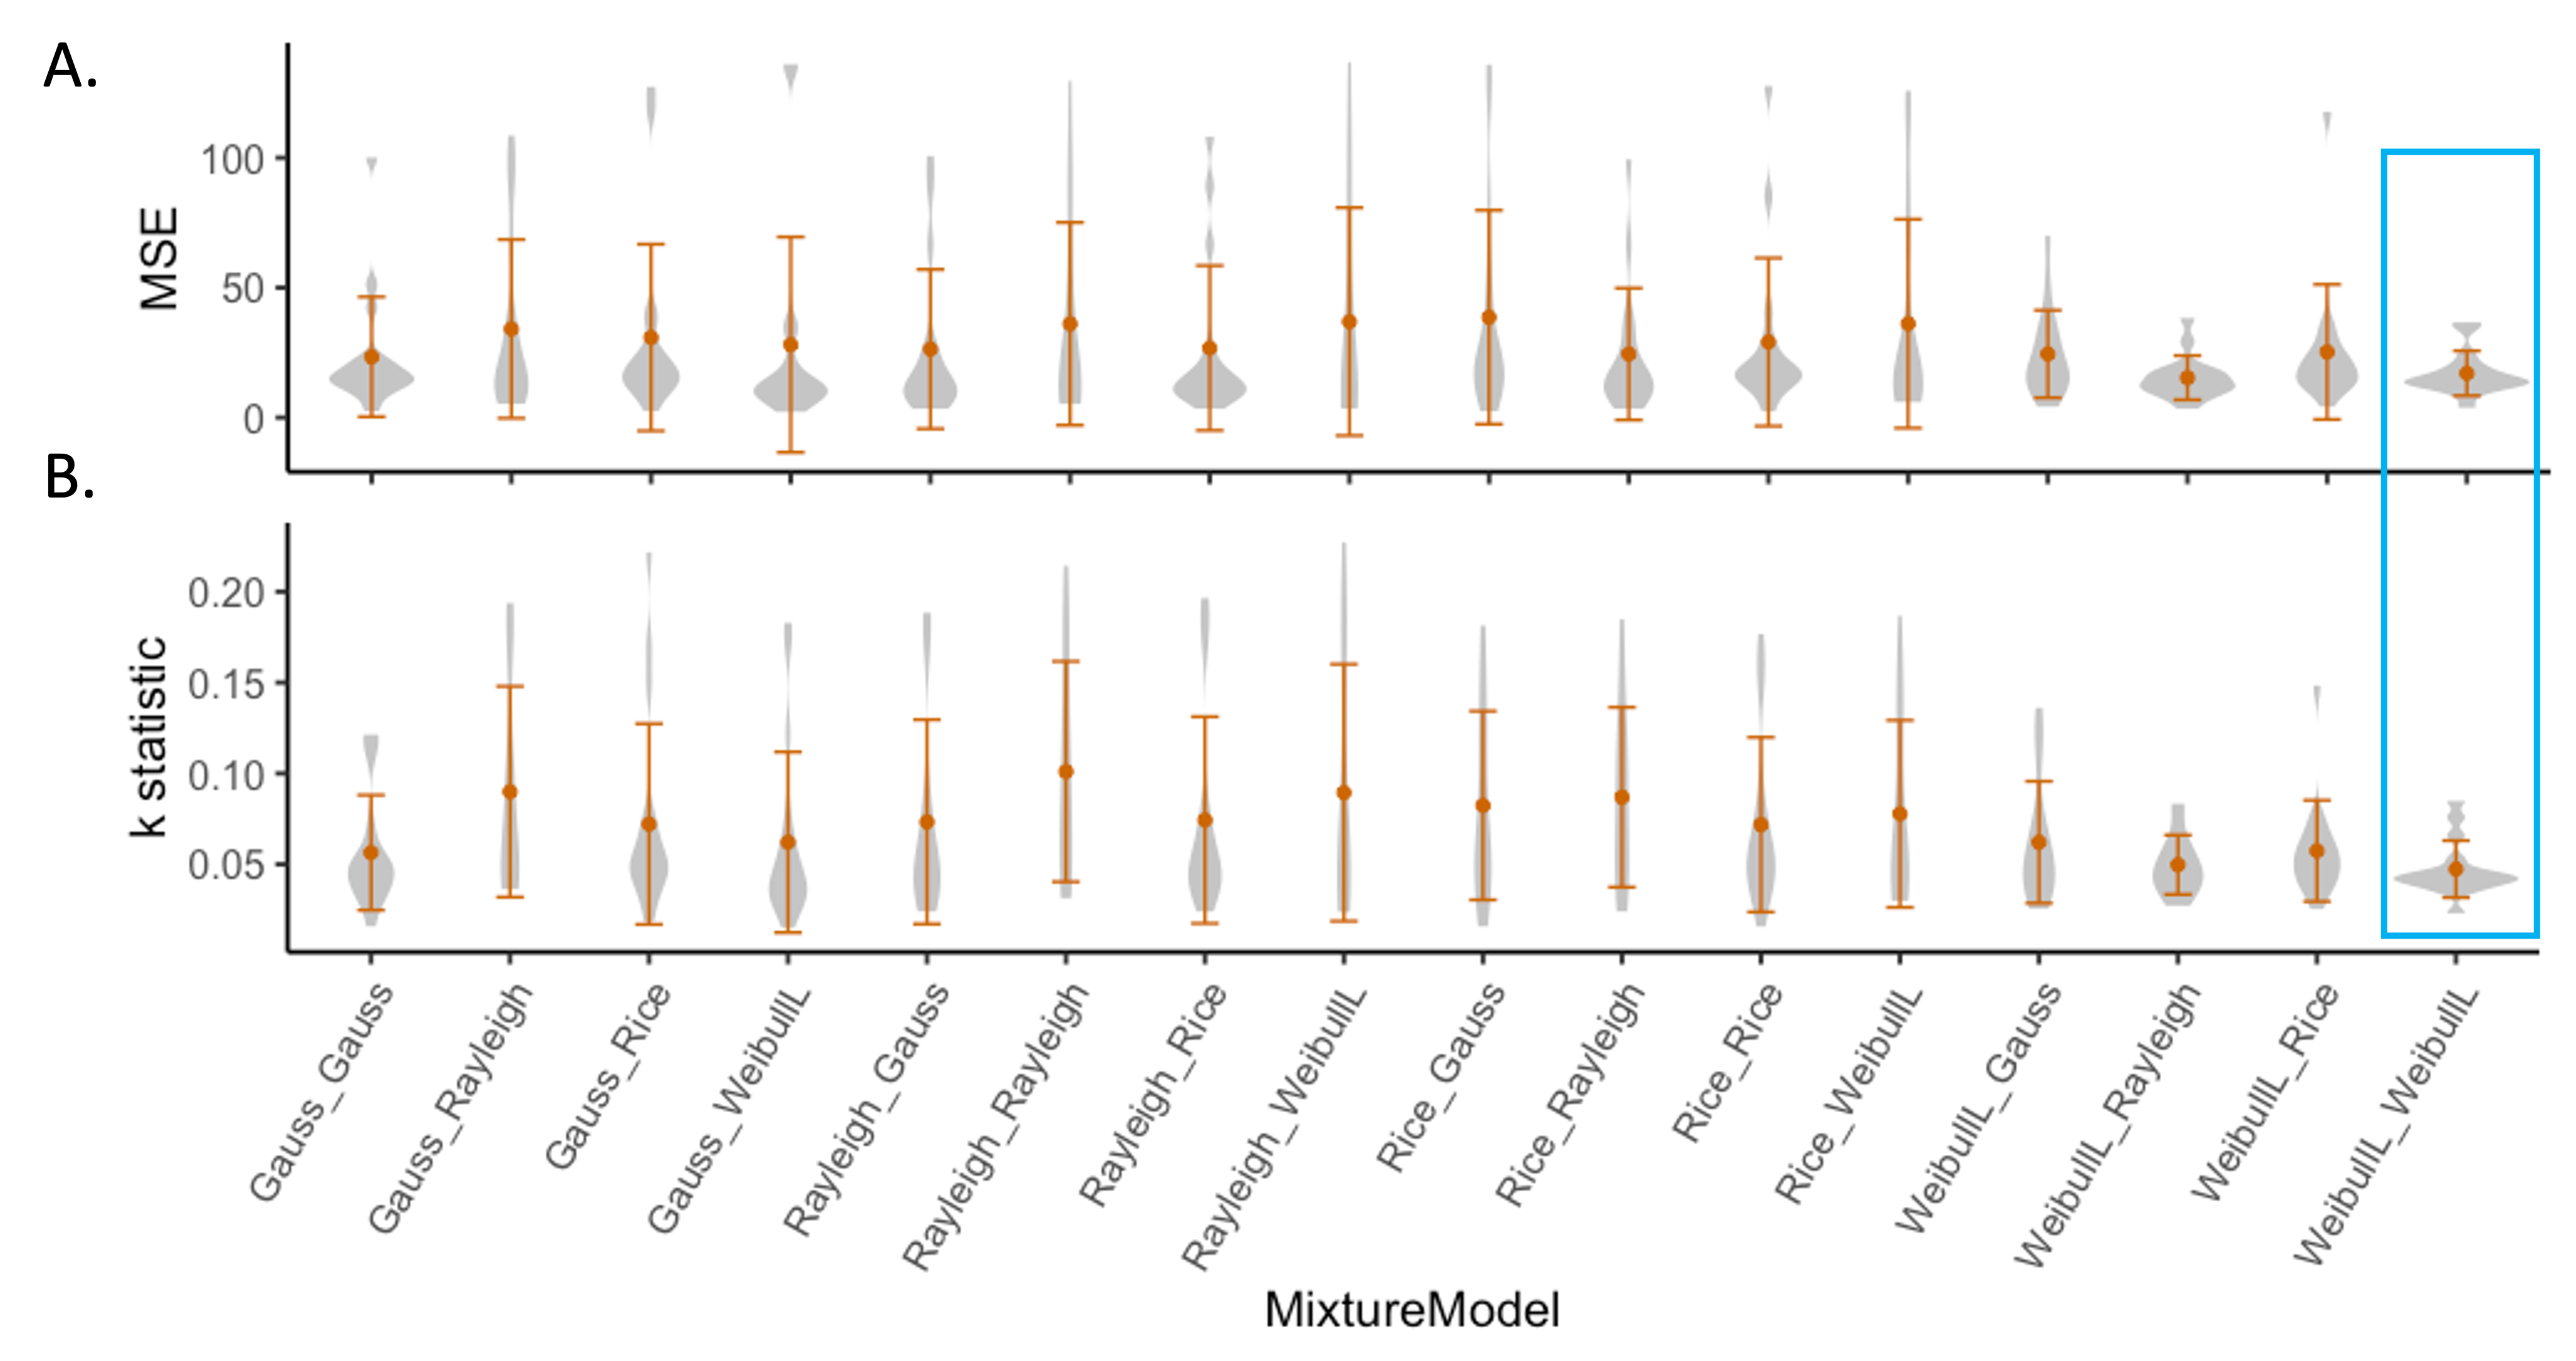
qT1 maps were obtained at 7T (Siemens Magnetom Terra, 32 channel head coil) using 3D-MP2RAGE (TR=6000, TE=3.02, TI=800,2700, 0.7 mm isotropic) sequence5 (Fig. 1A). On T1w images, individual white matter lesions (WML) were segmented (Fig. 1B). Lesion masks were dilated into the normal-appearing white matter to create a "lesional ROI" (Fig. 1C). Longitudinal changes in lesions were first analyzed using a "conventional" metrics where changes of volume and median qT1 were extracted from original lesion segmentation and the lesional ROI (Fig. 1D). Then, we developed a two-component MM to characterize changes in qT1 distributions within the two components of lesional ROI (Fig. 1E): the lesion penumbra (Fig. 1E, blue) and the lesion core (Fig. 1E teal).Our MM algorithm iteratively generates random parameters within defined bounds. The best-fitting model is selected based on the lowest log-likelihood. From each mixture component, distribution moments (peak, variance, skewness, kurtosis) and fitted model parameters (shape, scale) can be extracted and are collectively referred to as statistically derived markers (SDM). MM of different combinations of Rice, Rayleigh, Gaussian, and Weibull distribution were evaluated on 14 lesional ROIs in a separate cross-sectional cohort of 3 participants clinically diagnosed with MS. The fit of MM, using mean square error (MSE) and the k-statistic from Kolmogorov–Smirnov's test, determined which MM was used for the longitudinal analysis.
Results
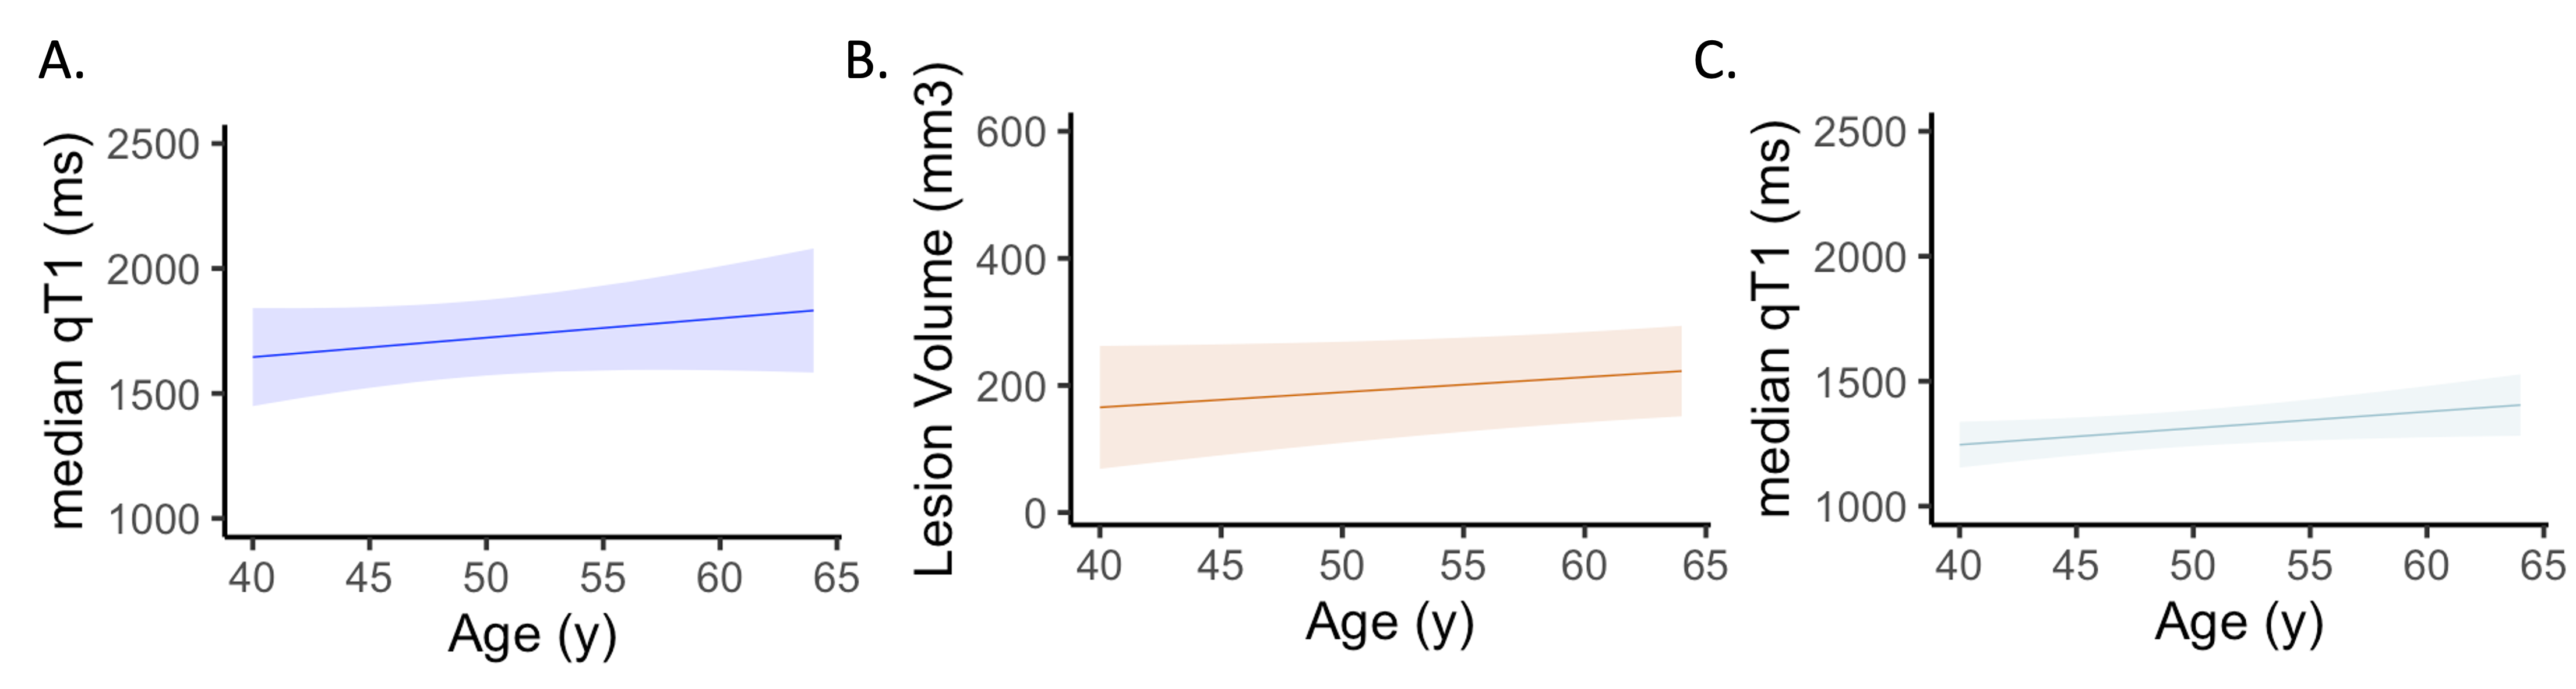
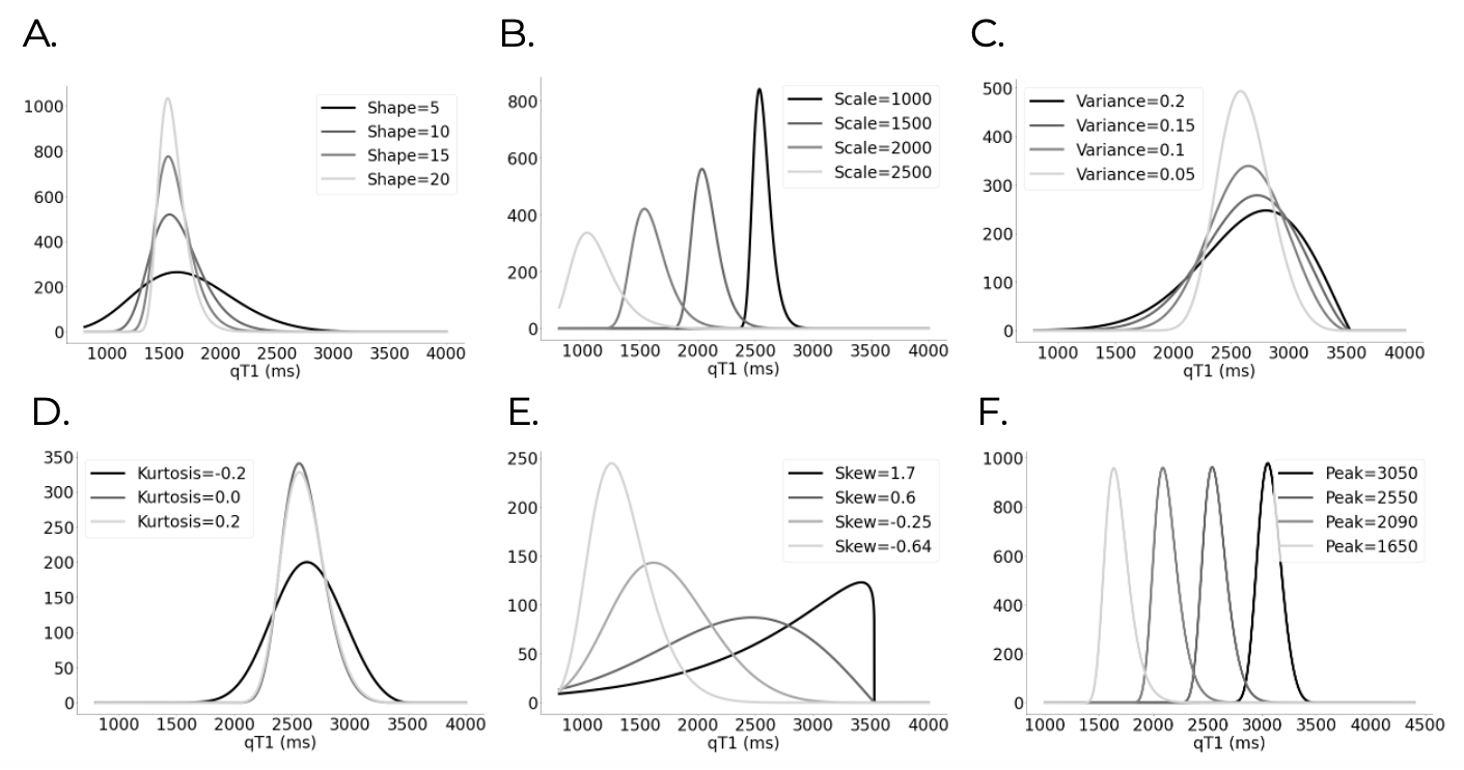
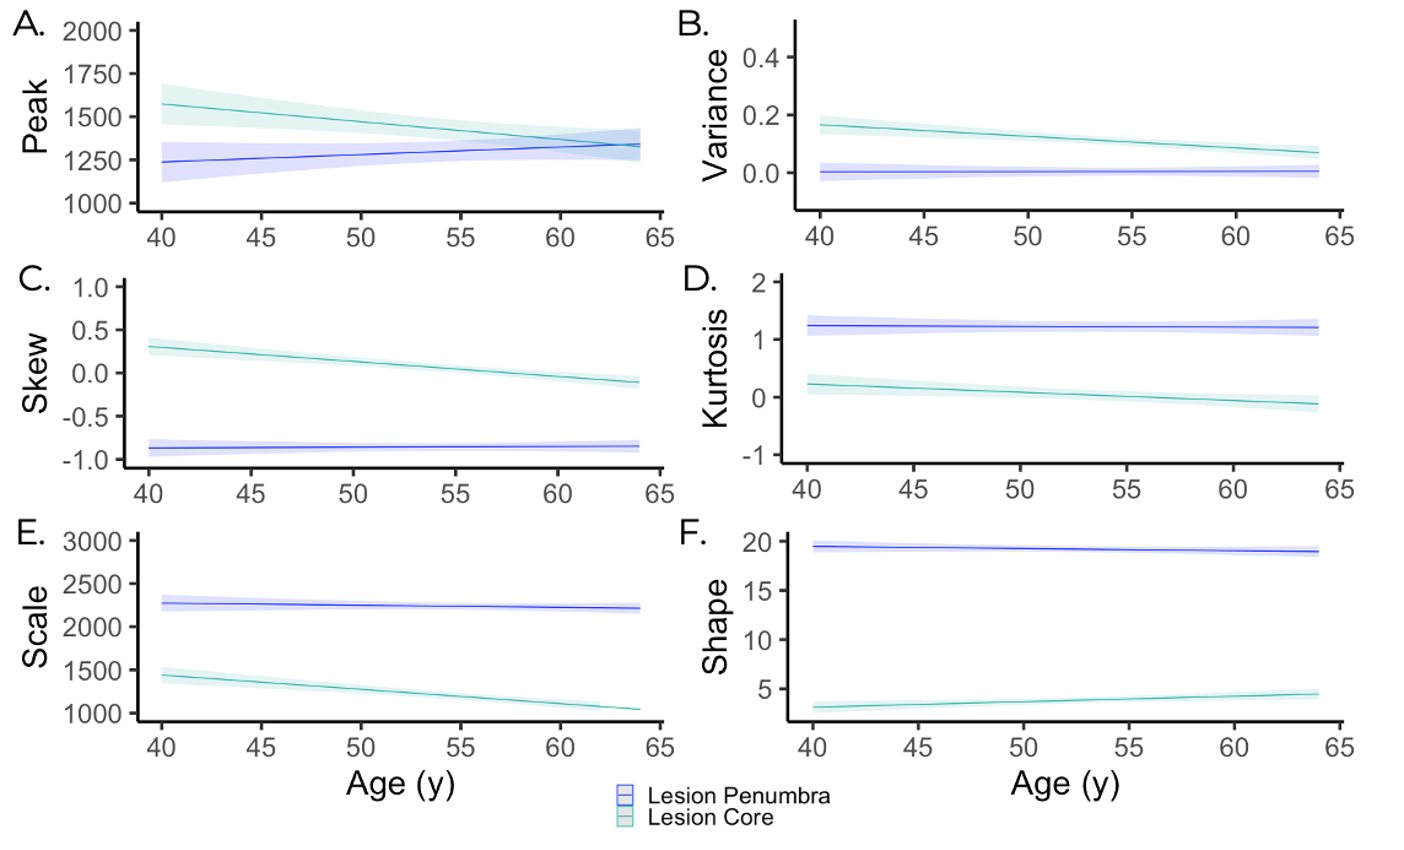
Conventional analysis revealed a non-significant trend towards increasing T1 and volume (Fig. 2A, B). However, incorporating the penumbra led to a significant increase in qT1 over time, suggesting intricate phenomena within lesional regions (Fig. 2C). To gain deeper insights into this change, we developed a MM fitting algorithm. The Weibull-Weibull MM and the Weibull-Rayleigh MM exhibited the lowest MSE and K-statistic (Fig. 3) compared to all other combinations of distributions. We selected the Weibull-Weibull MM for analysis, enabling a unified interpretation of changes in the lesional penumbra and core. Figure 4 provides examples of Weibull distributions with varied SDMs.Linear mixed models nested for participants and lesions showed significantly different slopes for lesion penumbra and core in all SDMs (Fig. 5). In the lesion core, shape increased over time compared to the lesion penumbra, while all other SDMs decreased overtime compared to lesion penumbra (Fig. 5). The lesion penumbra was stable overtime; the only SDM change was a decrease in peak.
Discussion
To track qT1 changes in MS lesions, we developed a MM. We tested different combinations of distributions to ensure that the selected distributions could effectively fit intensity distributions within lesional ROIs. While MRI noise follows a Rice distribution, we discovered that Rayleigh-Weibull or Weibull-Weibull MM better fits qT1 distributions in MS lesions, suggesting that more flexible models are needed in ROIs with intricate tissue changes.In the longitudinal analysis, MM revealed lesional changes that conventional analysis missed. While conventional methods showed no significant shifts in the visible lesion, MM indicated that the lesional core is changing dynamically. The lesion penumbra increased in peak over time, likely corresponding to the increase in mean qT1 in the lesional ROI. Despite this shift in qT1 to higher values, the MM analysis showed that the lesion penumbra is more stable than core, which would not be discernible based solely on conventional analysis.
Various biological processes linked to more severe disease in MS can raise qT1 (e.g., demyelination, axonal loss) or lower it (as in the case of iron accumulation at the lesion's edge). Mixture Model analysis may help disentangle these lesional changes that could be missed with simpler analyses.
Acknowledgements
No acknowledgement found.References
1. Mottershead JP, Schmierer K, Clemence M, et al. High field MRI correlates of myelin content and axonal density in multiple sclerosis--a post-mortem study of the spinal cord. J Neurol. Nov 2003;250(11):1293-301. doi:10.1007/s00415-003-0192-3
2. Granziera C, Wuerfel J, Barkhof F, et al. Quantitative magnetic resonance imaging towards clinical application in multiple sclerosis. Brain. Jun 22 2021;144(5):1296-1311. doi:10.1093/brain/awab029
3. Kolb H, Absinta M, Beck ES, et al. 7T MRI Differentiates Remyelinated from Demyelinated Multiple Sclerosis Lesions. Ann Neurol. Oct 2021;90(4):612-626. doi:10.1002/ana.26194
4. Song Y, Ji Z, Sun Q. An extension Gaussian mixture model for brain MRI segmentation. Annu Int Conf IEEE Eng Med Biol Soc. 2014;2014:4711-4. doi:10.1109/EMBC.2014.6944676
5. Marques JP, Kober T, Krueger G, van der Zwaag W, Van de Moortele PF, Gruetter R. MP2RAGE, a self bias-field corrected sequence for improved segmentation and T1-mapping at high field. Neuroimage. Jan 15 2010;49(2):1271-81. doi:10.1016/j.neuroimage.2009.10.002
Figures