2056
White Matter Tract Specific R2 Reflects Fiber Size and Microstructure1AMRI, LFMI, National Institutes of Health, Bethesda, MD, United States
Synopsis
Keywords: White Matter, White Matter
Motivation: T2 (or R2=1/T2) contrast is widely used for the study of neurological disease. Understanding how the relaxation relates to tissue microstructure may improve its clinical utility.
Goal(s): To explore white matter microstructural correlates to R2.
Approach: R2 mapping in healthy volunteers using Gradient Echo Sampling of Spin Echo at 7T. Atlas based analysis of fiber tracts, and analysis of corpus callosum subsections.
Results: R2 variation was about 25% across the white matter and correlated inversely with the diffusion MRI metric of axonal diameter.
Impact: T2 contrast is complex and influenced by factors including tissue iron and lipid content. Tissue microstructure, in particular white matter fiber thickness, may also play a role. Studying their relative contribution will help understand the nature of pathological tissue changes.
Introduction
T2 contrast has been applied as a clinical marker for neurodegenerative diseases since the dawn of MRI. Both iron and lipid content contribute to T2 relaxation, although the precise mechanism is not completely understood. Diffusion through microscopic susceptibility sources1, cellular compartment specific effects2, and fiber orientation3 can all play a role. Sensitivity to tissue microstructure has been demonstrated on rat spinal cord samples with varying axonal diameters and myelin thicknesses. The observed T2 differences were attributed to exchange between myelin water and other water4. Here we used T2-weighted MRI at 7T to reveal tract specific R2 (=1/T2) values in the entire human brain that appear to be inversely correlated with axon diameter. Additionally, we investigated variation of R2 across subsections of the corpus callosum (CC), a structure with known axonal diameter changes5.Methods
Data acquisition. Gradient Echo Sampling of Spin Echo (GESSE)6 was used to measure R2 at a fixed 40 ms TE on a Siemens 7T scanner with a 32-channel receive array. In a cohort of 12 healthy volunteers (4 males, 23-34 years), images were acquired on transverse slices parallel to the AC-PC line, with resolution 1x1 mm2, slice thickness 2 mm, slice gap 1 mm, 36-38 slices covering the entire brain, bandwidth 1042 Hz/voxel, echo train length 42. In a second cohort of 6 healthy volunteers (4 males, 25-49 years), 9 sagittal images with 7 mm gap and 4 averages were acquired to visualize the CC and corticospinal tracts. Finally, to demonstrate variation of magnetization transfer effect between water and myelin in the CC, 5 sagittal EPI images were acquired at 5 delays of 9/58/107/156/205 ms after a double inversion pulse (as a macromolecular saturation pulse) in 3 subjects.Data analysis. Gradient echo pairs symmetric about the spin echo were used to calculate R2 maps. Whole brain axial GESSE images were affine aligned to T1MPRAGE, then warped to MNI space in FreeSurfer. Johns Hopkins University (JHU) white-matter probabilistic tractography atlas was used to localize 20 major fiber tracts7. On the sagittal images, CC was manually segmented, divided into 4 equidistant sections labelled as genu, midbody, isthmus, splenium from anterior to posterior.
Results
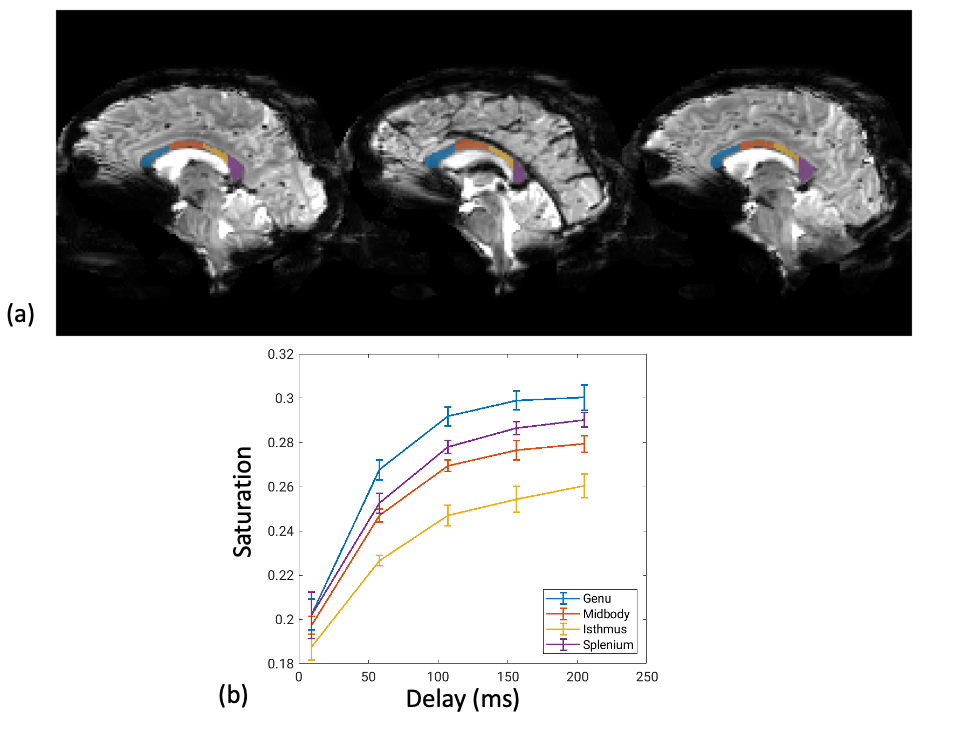
White matter R2 from 7T manifests strong spatial heterogeneity (6 s-1 or ~25% variation), with the corticospinal tract and forceps major having low R2, and anterior thalamic radiation and forceps minor having higher R2 (Figure 1 and 2). The R2 distribution over white matter tracts demonstrates good left-right symmetry, and follows approximately the inverse (correlation coefficient -0.73) of the fiber diameter metric found using diffusion8 (Figure 2). This pattern is reproducible on sagittal images (Figure 3). Additionally, there is prominent R2 variation across the CC, with the genu having much higher (~20%) R2 than the isthmus (Figure 4). Part of this variation may be explained by the magnetization transfer effect, which shows similar variation across the CC (Figure 5).Discussion and Conclusion
We report observation of a consistent variation pattern in R2 at 7T across white matter fiber tracts and subsections of the corpus collosum in brains of healthy volunteers. This variation appears to correlate inversely with the fiber diameter metric across the brain derived from diffusion MRI8, as well as the density of large (>3 mm) axons from microscopic studies in the CC5. Aside from alterations in inter-compartmental water exchange4 and microscopic susceptibility effects1 associated with larger axon diameter and myelin thickness, there are other parameters that co-vary, such as inter-fiber space5 and iron content9. These may relate to e.g. varying densities of glial cells and vasculature. We report that at least in the CC, there is strong variation in magnetization transfer that appears partially responsible for the R2 variation. Although the contributions from co-varying factors remain to be clarified, the notion that R2 is sensitive to fiber diameter deserves further investigation and may offer an avenue to use T2 contrast as a means to help detect pathological changes in fiber diameter.Acknowledgements
This study was supported by the intramural program of NINDS, NIH.
References
1. Weisskoff R, Zuo CS, Boxerman JL, Rosen BR. Microscopic susceptibility variation and transverse relaxation: Theory and experiment. Magn Reson Med. 1994;31(6):601-610. doi:10.1002/mrm.1910310605
2. MacKay A, Laule C, Vavasour I, Bjarnason T, Kolind S, Mädler B. Insights into brain microstructure from the T2 distribution. Magn Reson Imaging. 2006;24(4):515-525. doi:10.1016/j.mri.2005.12.037
3. Tax CMW, Kleban E, Chamberland M, Baraković M, Rudrapatna U, Jones DK. Measuring compartmental T2-orientational dependence in human brain white matter using a tiltable RF coil and diffusion-T2 correlation MRI. NeuroImage. 2021;236:117967. doi:10.1016/j.neuroimage.2021.117967
4. Dula AN, Gochberg DF, Valentine HL, Valentine WM, Does MD. Multiexponential T2, magnetization transfer, and quantitative histology in white matter tracts of rat spinal cord. Magn Reson Med. 2010;63(4):902-909. doi:10.1002/mrm.22267
5. Aboitiz F, Scheibel AB, Fisher RS, Zaidel E. Fiber composition of the human corpus callosum. Brain Res. 1992;598(1-2):143-153. doi:10.1016/0006-8993(92)90178-C
6. Yablonskiy DA, Haacke EM. An MRI method for measuring T2 in the presence of static and RF magnetic field Inhomogeneities. Magn Reson Med. 1997;37(6):872-876. doi:10.1002/mrm.1910370611
7. Mori S, Oishi K, Jiang H, et al. Stereotaxic white matter atlas based on diffusion tensor imaging in an ICBM template. NeuroImage. 2008;40(2):570-582. doi:10.1016/j.neuroimage.2007.12.035
8. Huang SY, Tian Q, Fan Q, et al. High-gradient diffusion MRI reveals distinct estimates of axon diameter index within different white matter tracts in the in vivo human brain. Brain Struct Funct. 2020;225(4):1277-1291. doi:10.1007/s00429-019-01961-2
9. Langkammer C, Krebs N, Goessler W, et al. Quantitative MR Imaging of Brain Iron: A Postmortem Validation Study. Radiology. 2010;257(2):455-462. doi:10.1148/radiol.10100495
Figures
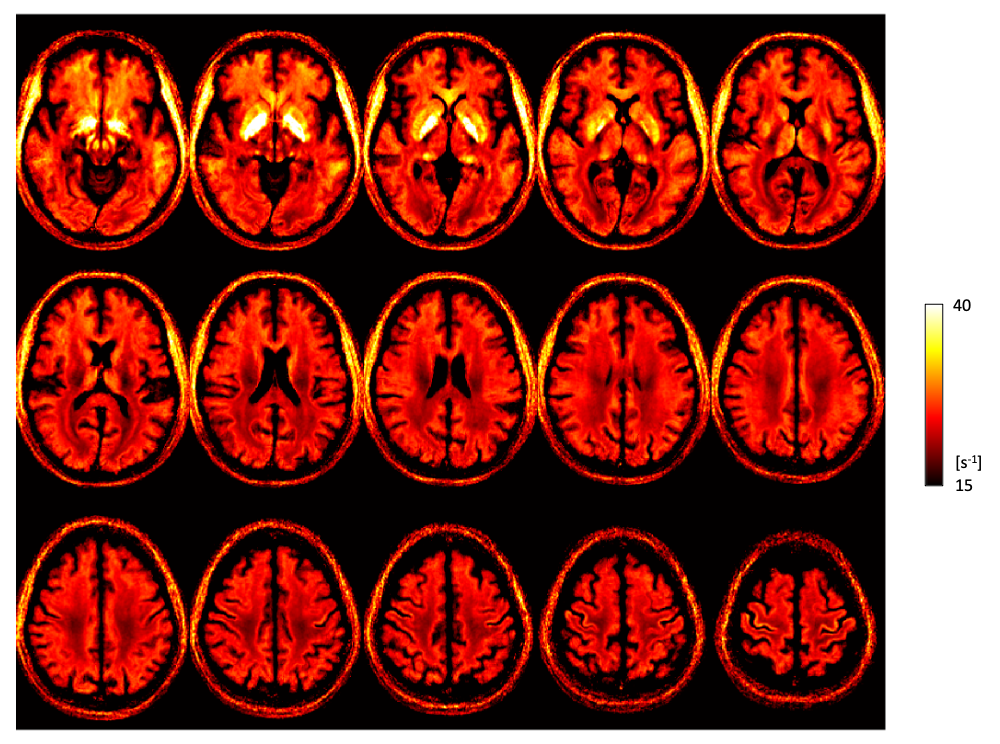
Figure 1. Avearge R2 map in MNI space over 12 healthy volunteers at 7T. Strong variation in white matter is present, including an anterior-posterior gradient, lower R2 in the corticospinal tract and higher R2 in the optical radiation.
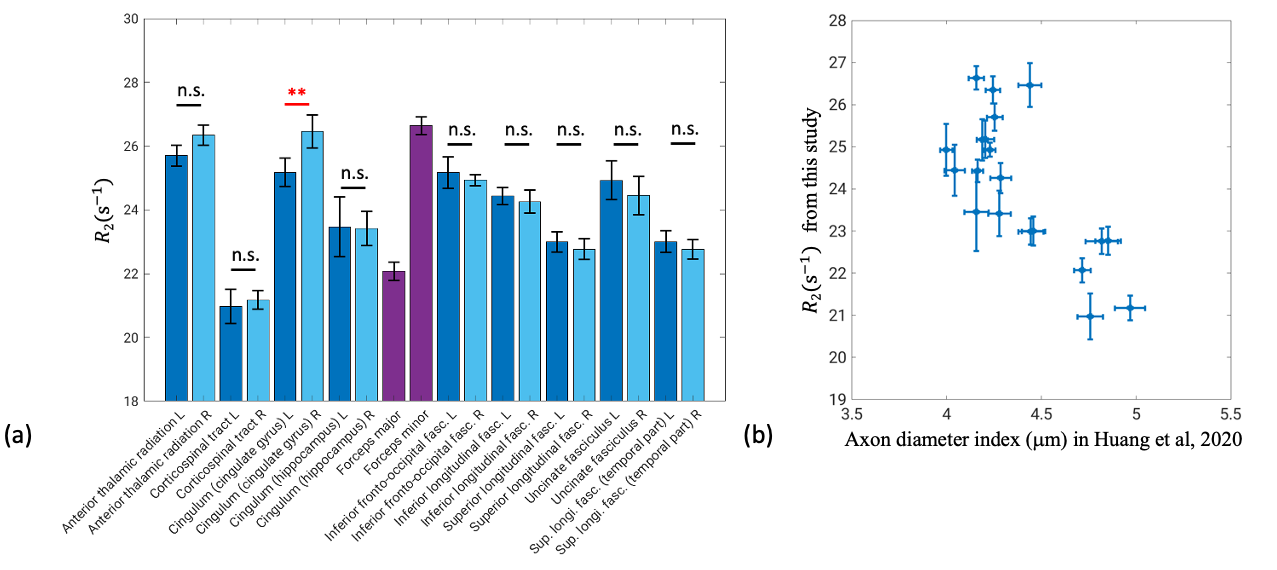
Figure 2. Fiber tract specific R2 (a). Data is shown as mean ± standard error over 12 subjects. Statistical tests were performed for left-right fiber tract paires. n.s. not significant (p>0.05); **p<0.01. Comparison to diffusion MRI derived axon diameter index (Huang et al., Brain Structure and Function 2020) for the same 20 tracts (b). All error bars in standard error.
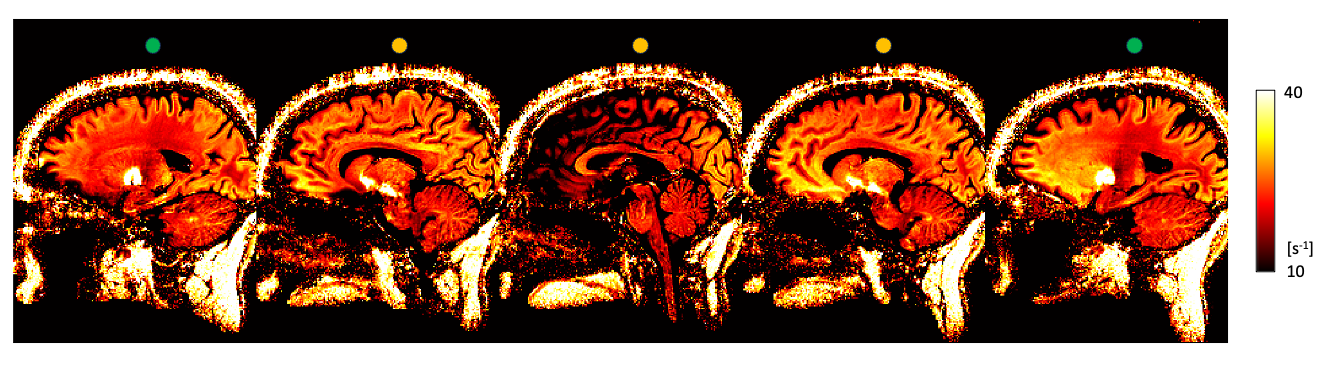
Figure 3. Sagittal R2 from a single subject (4 averages). R2 variation is observed in the corpus callosum in the middle slices (yellow marker). The corticospinal tract has lower R2, yet it projects to sensory-motor cortex that has relatively higher R2 (green marker). Similar white matter versus gray matter contrast can be observed for the visual area in the occipital pole.
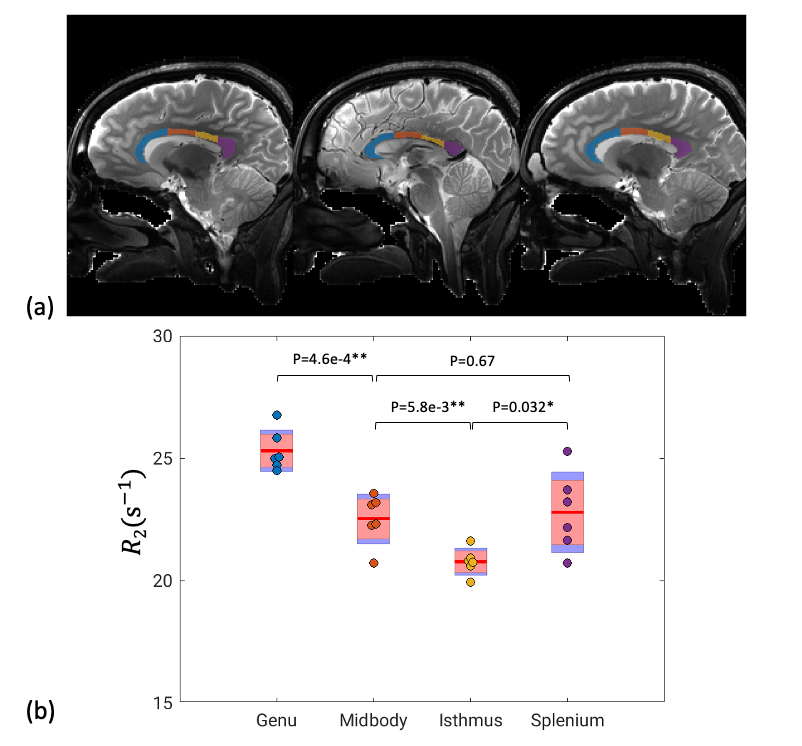
Figure 4. Example segmentation of the corpus callosum (a) and their R2 statistics over 6 subjects (b). Dots denote results from single subjects with the same colors as in the mask; red line is the group mean; red block is 95% confidence interval; blue is 1 standard deviation.