2054
How Do White Matter Tracts Constrain Brain Oscillation Propagation? A Diffusion MRI-MEG Study1Cardiff University, Cardiff, United Kingdom, 2Italian National Institute of Health, Rome, Italy
Synopsis
Keywords: White Matter, Multimodal
Motivation: Substantial effort has been invested into understanding how brain structure constrains function. However, research has primarily focused on understanding structure, rather than linking brain dynamics to it.
Goal(s): Compare oscillation propagation delays estimated using neuronal avalanches from MEG resting-state data with the underlying white matter structure estimated through tractography.
Approach: We characterised the relationship between pathways length and the related propagation delays, using deterministic and probabilistic approaches, and looking at different frequency bands.
Results: While higher frequency bands scale proportionally with propagation delays and length, lower frequency bands show constant delays, regardless of tract length, for both deterministic and probabilistic tractography.
Impact: This multi-modal approach has the potential to improve understanding of how underlying white matter structure constrains brain [oscillatory] activity. Future research will focus on integrating additional structural and microstructural measurements to inform biophysical models of brain structural and functional connectivity.
Introduction
Substantial effort has been invested into understanding how brain structure constrains function14. Microstructural MRI provides indices, such as axonal diameter and myelination, linked to neurophysiological measures2,15,20. To date, research has focused on integrating white matter structural measurements, due to limitations in quantifying "cortical processing" and grey matter topological organisation8. However, a novel approach has been introduced where one directly characterises the end-to-end propagation phenomena in the brain using neuronal avalanches estimated from magnetoencephalography (MEG)16. Within this framework, one can estimate the propagation delays as proposed by a recent study that combined them with deterministic tractography20. Despite the known limitations of deterministic tractography, this proof of concept has shown the potential to improve understanding of how structural features constrain brain dynamics.Our goal was comparing MEG-derived propagation delays data with the underlying white matter pathways estimated through tractography using improved methodology. We adopted a state-of-the-art experimental design (Fig.1), including multi-shell diffusion data, a comparison of probabilistic and deterministic tractography and a more detailed MEG analysis.
Methods
Thirty healthy participants (mean age[SD]: 28.57[9.05]; F/M=18/12) underwent MRI with an ultra-strong gradient system (Siemens Connectom 3T) and MEG with a 275-channel CTF radial gradiometer system.The MRI session comprised MPRAGE (voxel size=1x1x1mm;) and multi-shell diffusion-weighted MRI data (20 directions at b=200 and 500 s/mm2; 30 at b=1200s/mm2; 61 at b=2400, 4000 and 6000s/mm2; 13 volumes with b=0s/mm2)13. The acquisition parameters for all b-values were: TE=59ms; TR=3000ms; voxel size 2x2x2mm). Reversed phase-encoding volumes were collected for distortion-correction.
Preprocessing included denoising3,21,22,23, signal drift correction, susceptibility and eddy current-induced distortions1,17, gradient non-uniformity and Gibbs ringing12. Using FSL’s FLIRT the data were aligned to the anatomical data7,9,10.
We used multi-shell multi-tissue spherical deconvolution to estimate the fibre orientation distribution11. We then used anatomically constrained tractography16 to probabilistically reconstruct white matter pathways. For comparison, we also performed deterministic tractography (FACT)15,21.
The anatomical data were processed and segmented using the Desikan-Killiany atlas from Freesurfer 5.3.04,6. Connectivity matrices were obtained using the parcellated grey matter regions as nodes and streamline length as edge-weights. Then they were thresholded, firstly, using a hard threshold of more than 4 streamlines per connection. Then group-consensus matrices were computed using a 60% connection prevalence to balance false positives and false negatives5.
Whole-head MEG resting-state data were acquired at a 1200Hz sampling rate. 29 reference channels were recorded to aid with noise cancellation. The acquisition was 10 minutes with eyes open and fixated on a cross.
All the datasets were filtered 1-150Hz and epoched into 2s windows. Epoched data were downsampled to 512Hz, then source-localisation using beamforming was performed and finally, virtual sensor timeseries were estimated within the centroids of each parcel from the Desikan-Killiany atlas6,20.
This was performed for a broadband frequency range(1-48 Hz), as well as delta(1-4 Hz); theta(4-8 Hz); alpha (8-13 Hz); beta(13-30 Hz).
As done previously20 neuronal avalanches were estimated by computing the z-score of each timeseries, then thresholding them by 3 standard deviations and finally binning them into 3-sample windows. Avalanches start whenever one or more timecourses go over threshold and conclude when no timeseries are over threshold. Delays were computed within an avalanche counting the number of timesteps between the beginning of the avalanche in a given region and subsequent over-threshold activity of any other region. A delay connectivity matrix was then built for each subject, averaging over the avalanches.
Results
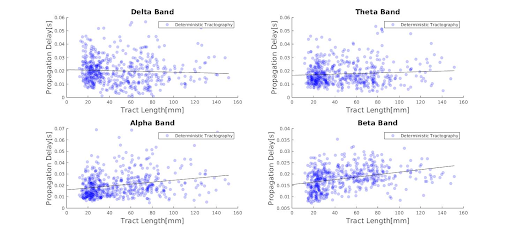
Deterministic and probabilistic tractography show a similar linear relationship between propagation delays and tract length(Fig.1.). Higher frequency bands are associated with longer delays as a function of tract length, while lower frequency bands show constant delays, irrespective of tract length(Fig.2.-3.). This association could also be driven by the higher mean number of neuronal avalanches for the higher frequency bands(Tab.1.). Although this trend seems to apply to both probabilistic and deterministic tractography, Tab.1. shows that the lower frequency bands (delta-theta) do not seem to correlate with tract length. This could be due to the inherent bias of neuronal cascades towards higher-frequency variations.Discussion
Neuronal avalanches appear to be frequency-dependent, an observation that deserves further investigation. Higher frequency propagation delays scale with tract length, rather than being constant as lower frequency bands.Future work should focus on including quantitative microstructural measurements (such as axonal diameter and myelination) in the analysis in addition to potentially exploring time-frequency relationships.
Acknowledgements
The WAND data were acquired at the UK National Facility for In Vivo MR Imaging of Human Tissue Microstructure funded by the EPSRC (grant EP/M029778/1), and The Wolfson Foundation, and supported by a Wellcome Trust Investigator Award (096646/Z/11/Z) and a Wellcome Trust Strategic Award (104943/Z/14/Z).
Matteo Mancini was supported by the Italian National Institute of Health with a Starting Grant, and by the Wellcome Trust through a Sir Henry Wellcome Fellowship (213722/Z/18/Z).
References
Andersson, J. L., Skare, S., & Ashburner, J. (2003). How to correct susceptibility distortions in spin-echo echo-planar images: application to diffusion tensor imaging. Neuroimage, 20(2), 870-888.
Berman, S., Filo, S., & Mezer, A. A. (2019). Modeling conduction delays in the corpus callosum using MRI-measured g-ratio. Neuroimage, 195, 128-139.
Cordero-Grande, L., Christiaens, D., Hutter, J., Price, A. N., & Hajnal, J. V. (2019). Complex diffusion-weighted image estimation via matrix recovery under general noise models. Neuroimage, 200, 391-404.
Dale, A. M., Fischl, B., & Sereno, M. I. (1999). Cortical surface-based analysis: I. Segmentation and surface reconstruction. Neuroimage, 9(2), 179-194.
de Reus, M. A., & van den Heuvel, M. P. (2013). Estimating false positives and negatives in brain networks. Neuroimage, 70, 402-409.
Desikan, R. S., Ségonne, F., Fischl, B., Quinn, B. T., Dickerson, B. C., Blacker, D., ... & Killiany, R. J. (2006). An automated labeling system for subdividing the human cerebral cortex on MRI scans into gyral based regions of interest. Neuroimage, 31(3), 968-980.
Greve, D. N., & Fischl, B. (2009). Accurate and robust brain image alignment using boundary-based registration. Neuroimage, 48(1), 63-72.
Imms, P., Domínguez D, J. F., Burmester, A., Seguin, C., Clemente, A., Dhollander, T., ... & Caeyenberghs, K. (2021). Navigating the link between processing speed and network communication in the human brain. Brain Structure and Function, 226(4), 1281-1302.
Jenkinson, M., & Smith, S. (2001). A global optimisation method for robust affine registration of brain images. Medical image analysis, 5(2), 143-156.
Jenkinson, M., Bannister, P., Brady, M., & Smith, S. (2002). Improved optimization for the robust and accurate linear registration and motion correction of brain images. Neuroimage, 17(2), 825-841.
Jeurissen, B., Tournier, J. D., Dhollander, T., Connelly, A., & Sijbers, J. (2014). Multi-tissue constrained spherical deconvolution for improved analysis of multi-shell diffusion MRI data. NeuroImage, 103, 411-426.
Kellner, E., Dhital, B., Kiselev, V. G., & Reisert, M. (2016). Gibbs‐ringing artifact removal based on local subvoxel‐shifts. Magnetic resonance in medicine, 76(5), 1574-1581.
Koller, K., Rudrapatna, U., Chamberland, M., Raven, E. P., Parker, G. D., Tax, C. M., ... & Jones, D. K. (2021). MICRA: Microstructural image compilation with repeated acquisitions. Neuroimage, 225, 117406.
Mancini, M., Tian, Q., Fan, Q., Cercignani, M., & Huang, S. Y. (2021). Dissecting whole-brain conduction delays through MRI microstructural measures. Brain Structure and Function, 226(8), 2651-2663.
Mori, S., Crain, B. J., Chacko, V. P., & Van Zijl, P. C. (1999). Three‐dimensional tracking of axonal projections in the brain by magnetic resonance imaging. Annals of Neurology: Official Journal of the American Neurological Association and the Child Neurology Society, 45(2), 265-269.
Shriki, O., Alstott, J., Carver, F., Holroyd, T., Henson, R. N., Smith, M. L., ... & Plenz, D. (2013). Neuronal avalanches in the resting MEG of the human brain. Journal of Neuroscience, 33(16), 7079-7090.
Smith, S. M., Jenkinson, M., Woolrich, M. W., Beckmann, C. F., Behrens, T. E., Johansen-Berg, H., ... & Matthews, P. M. (2004). Advances in functional and structural MR image analysis and implementation as FSL. Neuroimage, 23, S208-S219.
Smith, R. E., Tournier, J. D., Calamante, F., & Connelly, A. (2012). Anatomically-constrained tractography: improved diffusion MRI streamlines tractography through effective use of anatomical information. Neuroimage, 62(3), 1924-1938.
Smith, S. M. (2002). Fast robust automated brain extraction. Human brain mapping, 17(3), 143-155.
Sorrentino, P., Petkoski, S., Sparaco, M., Lopez, E. T., Signoriello, E., Baselice, F., ... & Jirsa, V. (2022). Whole-brain propagation delays in multiple sclerosis, a combined tractography-magnetoencephalography study. Journal of Neuroscience, 42(47), 8807-8816.
Tournier, J. D., Smith, R., Raffelt, D., Tabbara, R., Dhollander, T., Pietsch, M., ... & Connelly, A. (2019). MRtrix3: A fast, flexible and open software framework for medical image processing and visualisation. Neuroimage, 202, 116137.
Veraart, J., Fieremans, E., & Novikov, D. S. (2016). Diffusion MRI noise mapping using random matrix theory. Magnetic resonance in medicine, 76(5), 1582-1593.
Veraart, J., Novikov, D. S., Christiaens, D., Ades-Aron, B., Sijbers, J., & Fieremans, E. (2016). Denoising of diffusion MRI using random matrix theory. Neuroimage, 142, 394-406.
Figures
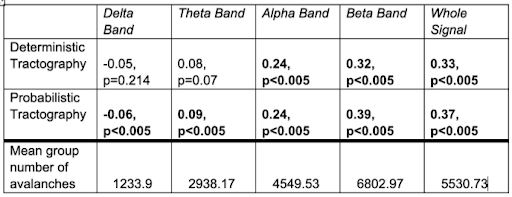
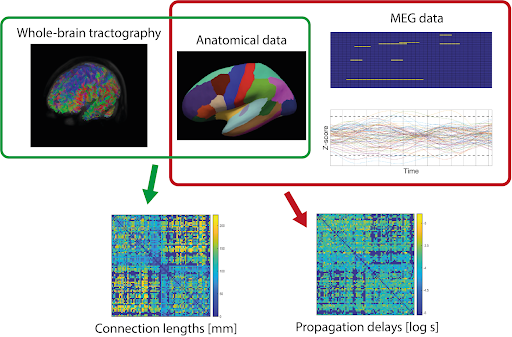
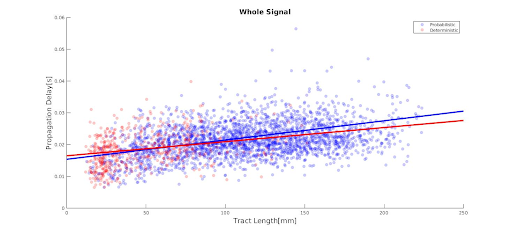
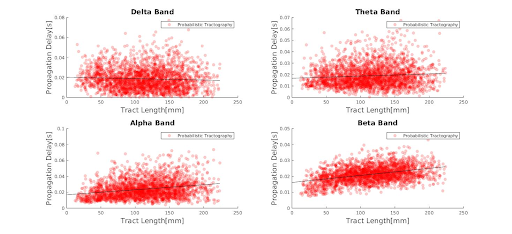
Figure 3. Propagation delay distribution across the different frequency bands for probabilistic tractography for all subjects. The black line in each panel represents the regression line for each frequency band from Table 1., probabilistic tractography section.