2052
Mapping the Functional Role of White Matter Tracks by fusing Diffusion and Functional MRI1The University of Sydney, Camperdown, Australia
Synopsis
Keywords: White Matter, Brain Connectivity, White matter; Diffusion MRI; Functional MRI; Multi-modal
Motivation: The axonal connections in white matter(WM) are vital for brain function, but there is a knowledge gap of the functional role of WM tracks.
Goal(s): To address this, we proposed a method to combine diffusion MRI (dMRI) and functional MRI (fMRI) to map the functional role of WM tracks during tasks.
Approach: To each WM track generated with dMRI, we define the dynamic functional connectivity (DFC) that reflects the functional interaction of the GM it connects. General linear model(GLM) is then employed to measure the activation level during task.
Results: Meaningful tracks that are associated with various tasks, implicating the activated networks.
Impact: Our method paves the road to generate a functional atlas of white matter. It is important for understanding the functional architecture of the brain, the mechanism of brain disorders, such as, Schizophrenia, Epilepsy and Traumatic Brain Injury.
Introduction
Vast efforts have been devoted to map the functional role of grey matter(GM) in the human brain. Although the axonal connections inherent within white matter(WM) are also vital for brain function, studies rarely map cognitive functions to WM. In this work, we proposed a method to combine diffusion MRI (dMRI) and functional MRI (fMRI) to map the functional role of WM tracks during fMRI tasks. Specifically, to each WM track generated with dMRI, we assign the dynamic functional connectivity (DFC) that reflects the functional interaction of the GM it connects. General linear model(GLM) is then employed to measure the activation level of the DFCs[1] against the task design. A major challenge for group-wise analysis is the correspondence of the tracts across subjects. Our recently developed multimodal tissue-unbiased tractogram template[2] addressed this problem, and group-wise activation can now be inferred based on the template. We tested our method using the human connectome project (HCP) dataset[3], and our results have shown meaningful tracks that are associated with various tasks/contrasts, implicating the activated networks. Our method will be used to generate a functional atlas of white matter.Methods
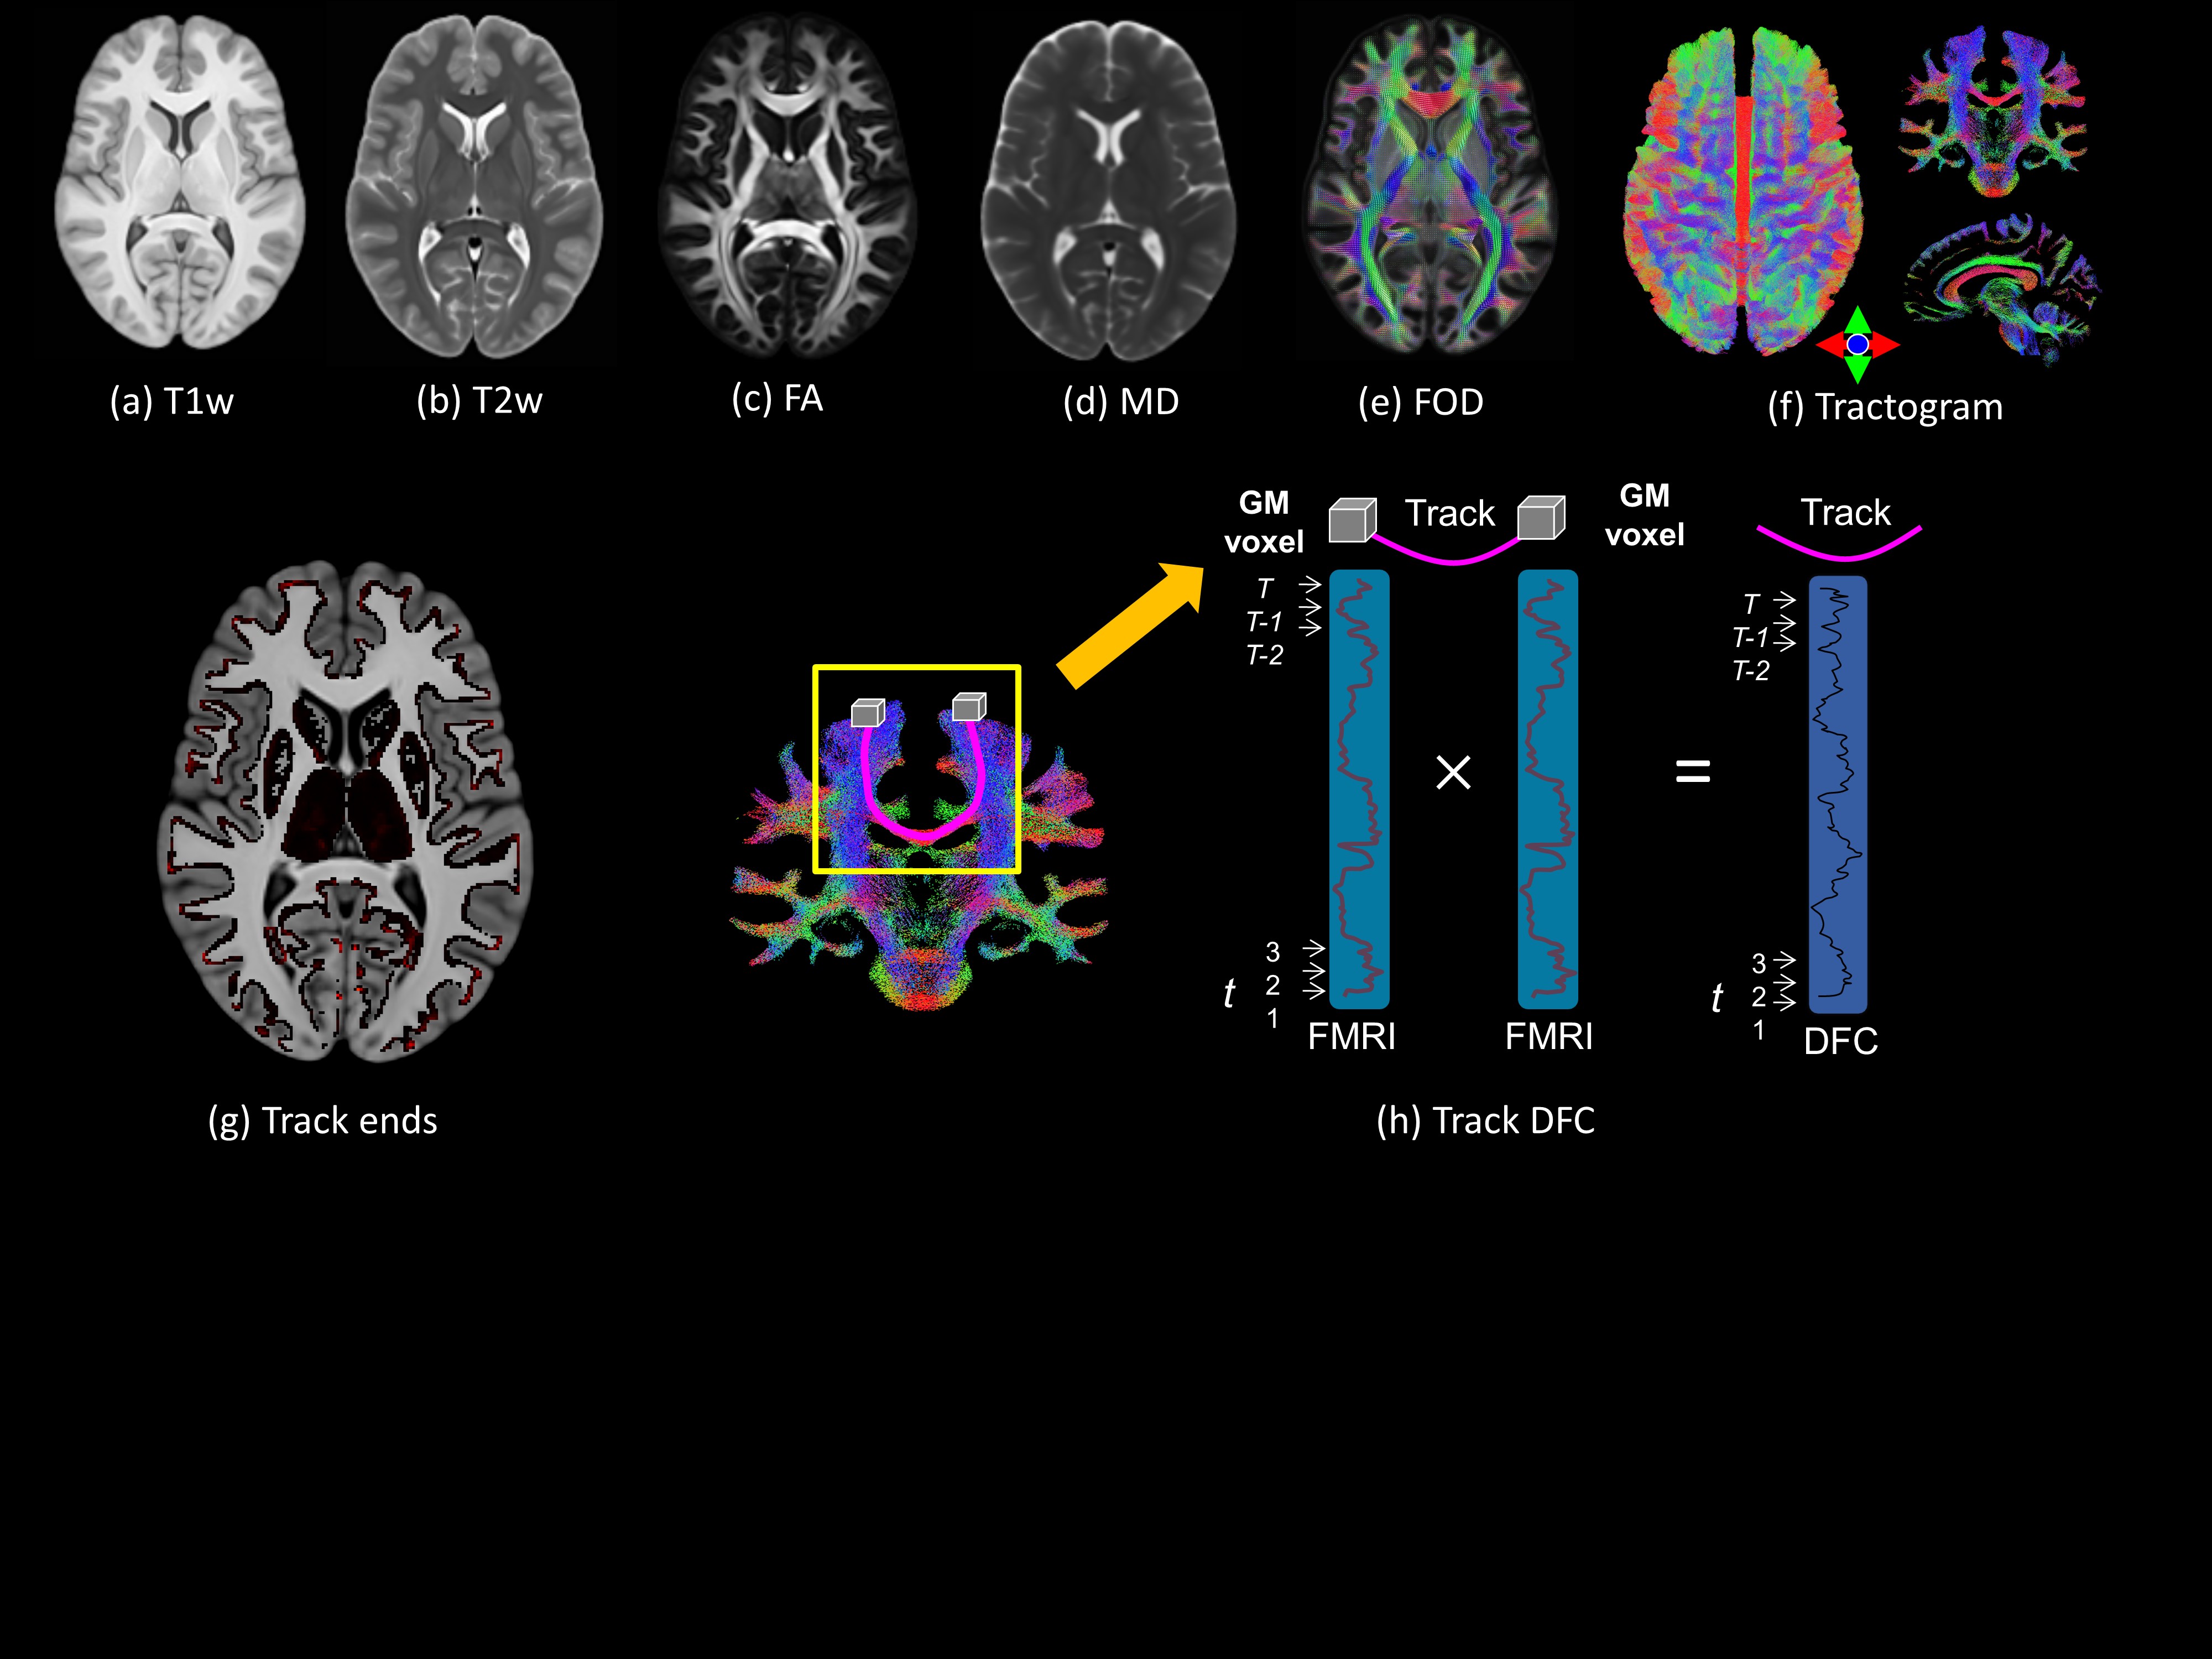
T1, T2, dMRI, and fMRI of randomly selected 50 subjects from the HCP data set were used in this study. All the modalities were processed using the HCP minimal preprocessing pipeline[3]. The dMRI tensor model was calculated to map the Fractional anisotropy (FA) and mean diffusivity (MD). We generated the tissue unbiased brain template (Fig.1) with multimodal registration[2] with T1, T2, FA and MD maps. The registration is applied to the fiber orientation distribution (FOD)[4] of 50 subjects, to generate the FOD template[2]. With the anatomical constrained tractography[5], a tractogram template (with 90k streamlines, Fig. 1f) was generated, whose tracks end at the GM/WM boundary (Fig. 1g). This is important for each streamline to be assigned the accurate fMRI signal at both ends. The fMRI data was further high-pass filtered (>0.01HZ) and spatial smoothed (FWHM=6mm) after the minimal preprocessing. Since all the HCP fMRI data are normalized to the MNI 152 template, we also registered[6] our multimodal template to the MNI space. For each template track, we extracted the fMRI signals of the two endpoints and then multiplied the signal intensity at each time point so as to estimate the dynamic co-fluctuation[7] of the two signals (Fig.1f) – we refer to this novel time series as the dynamic functional connectivity associated with the track (Track DFC). In this study, we explore the functional activation of the Track DFC in the 7 tasks of the HCP, including the Emotion, Language, Gambling, Motor, Social, Relational and Working Memory (W-Mem) tasks[8]. GLM[9] was employed to determine the effect of the task design on the Track DFC. As the tractogram template establishes a correspondence across subjects, the second level mixed-effect model[10] was used to infer the group-wise activation.Results
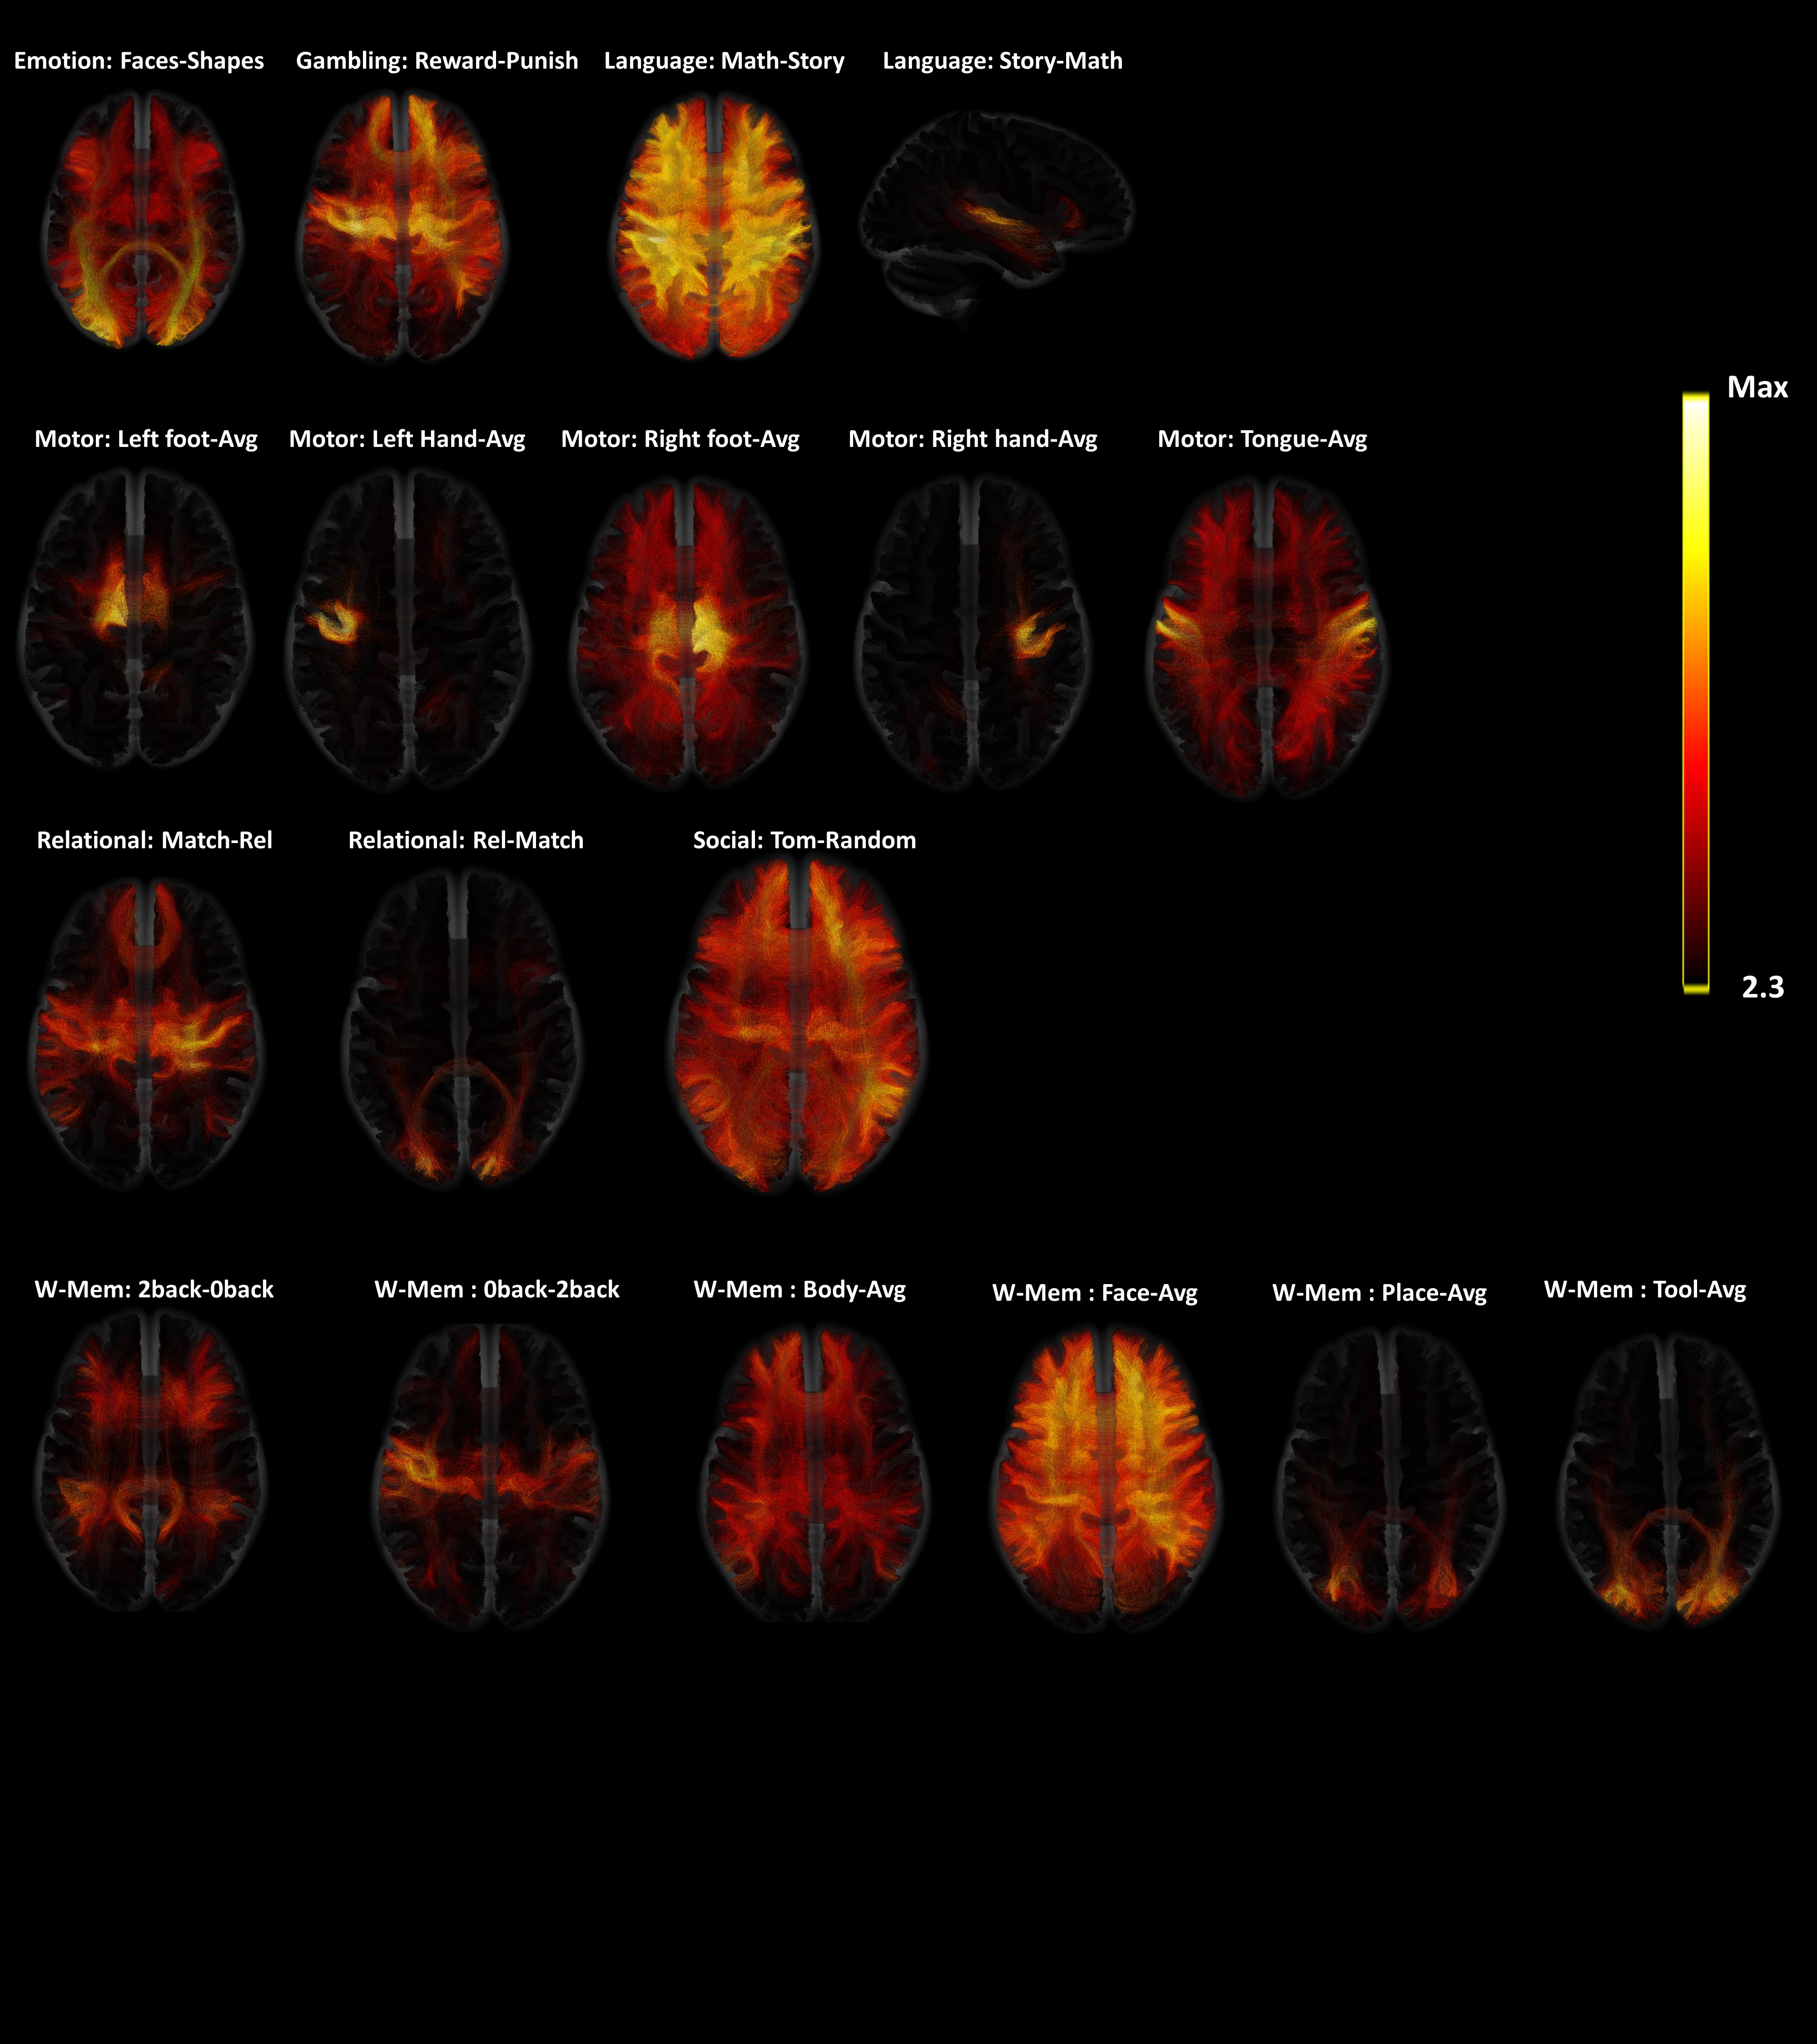
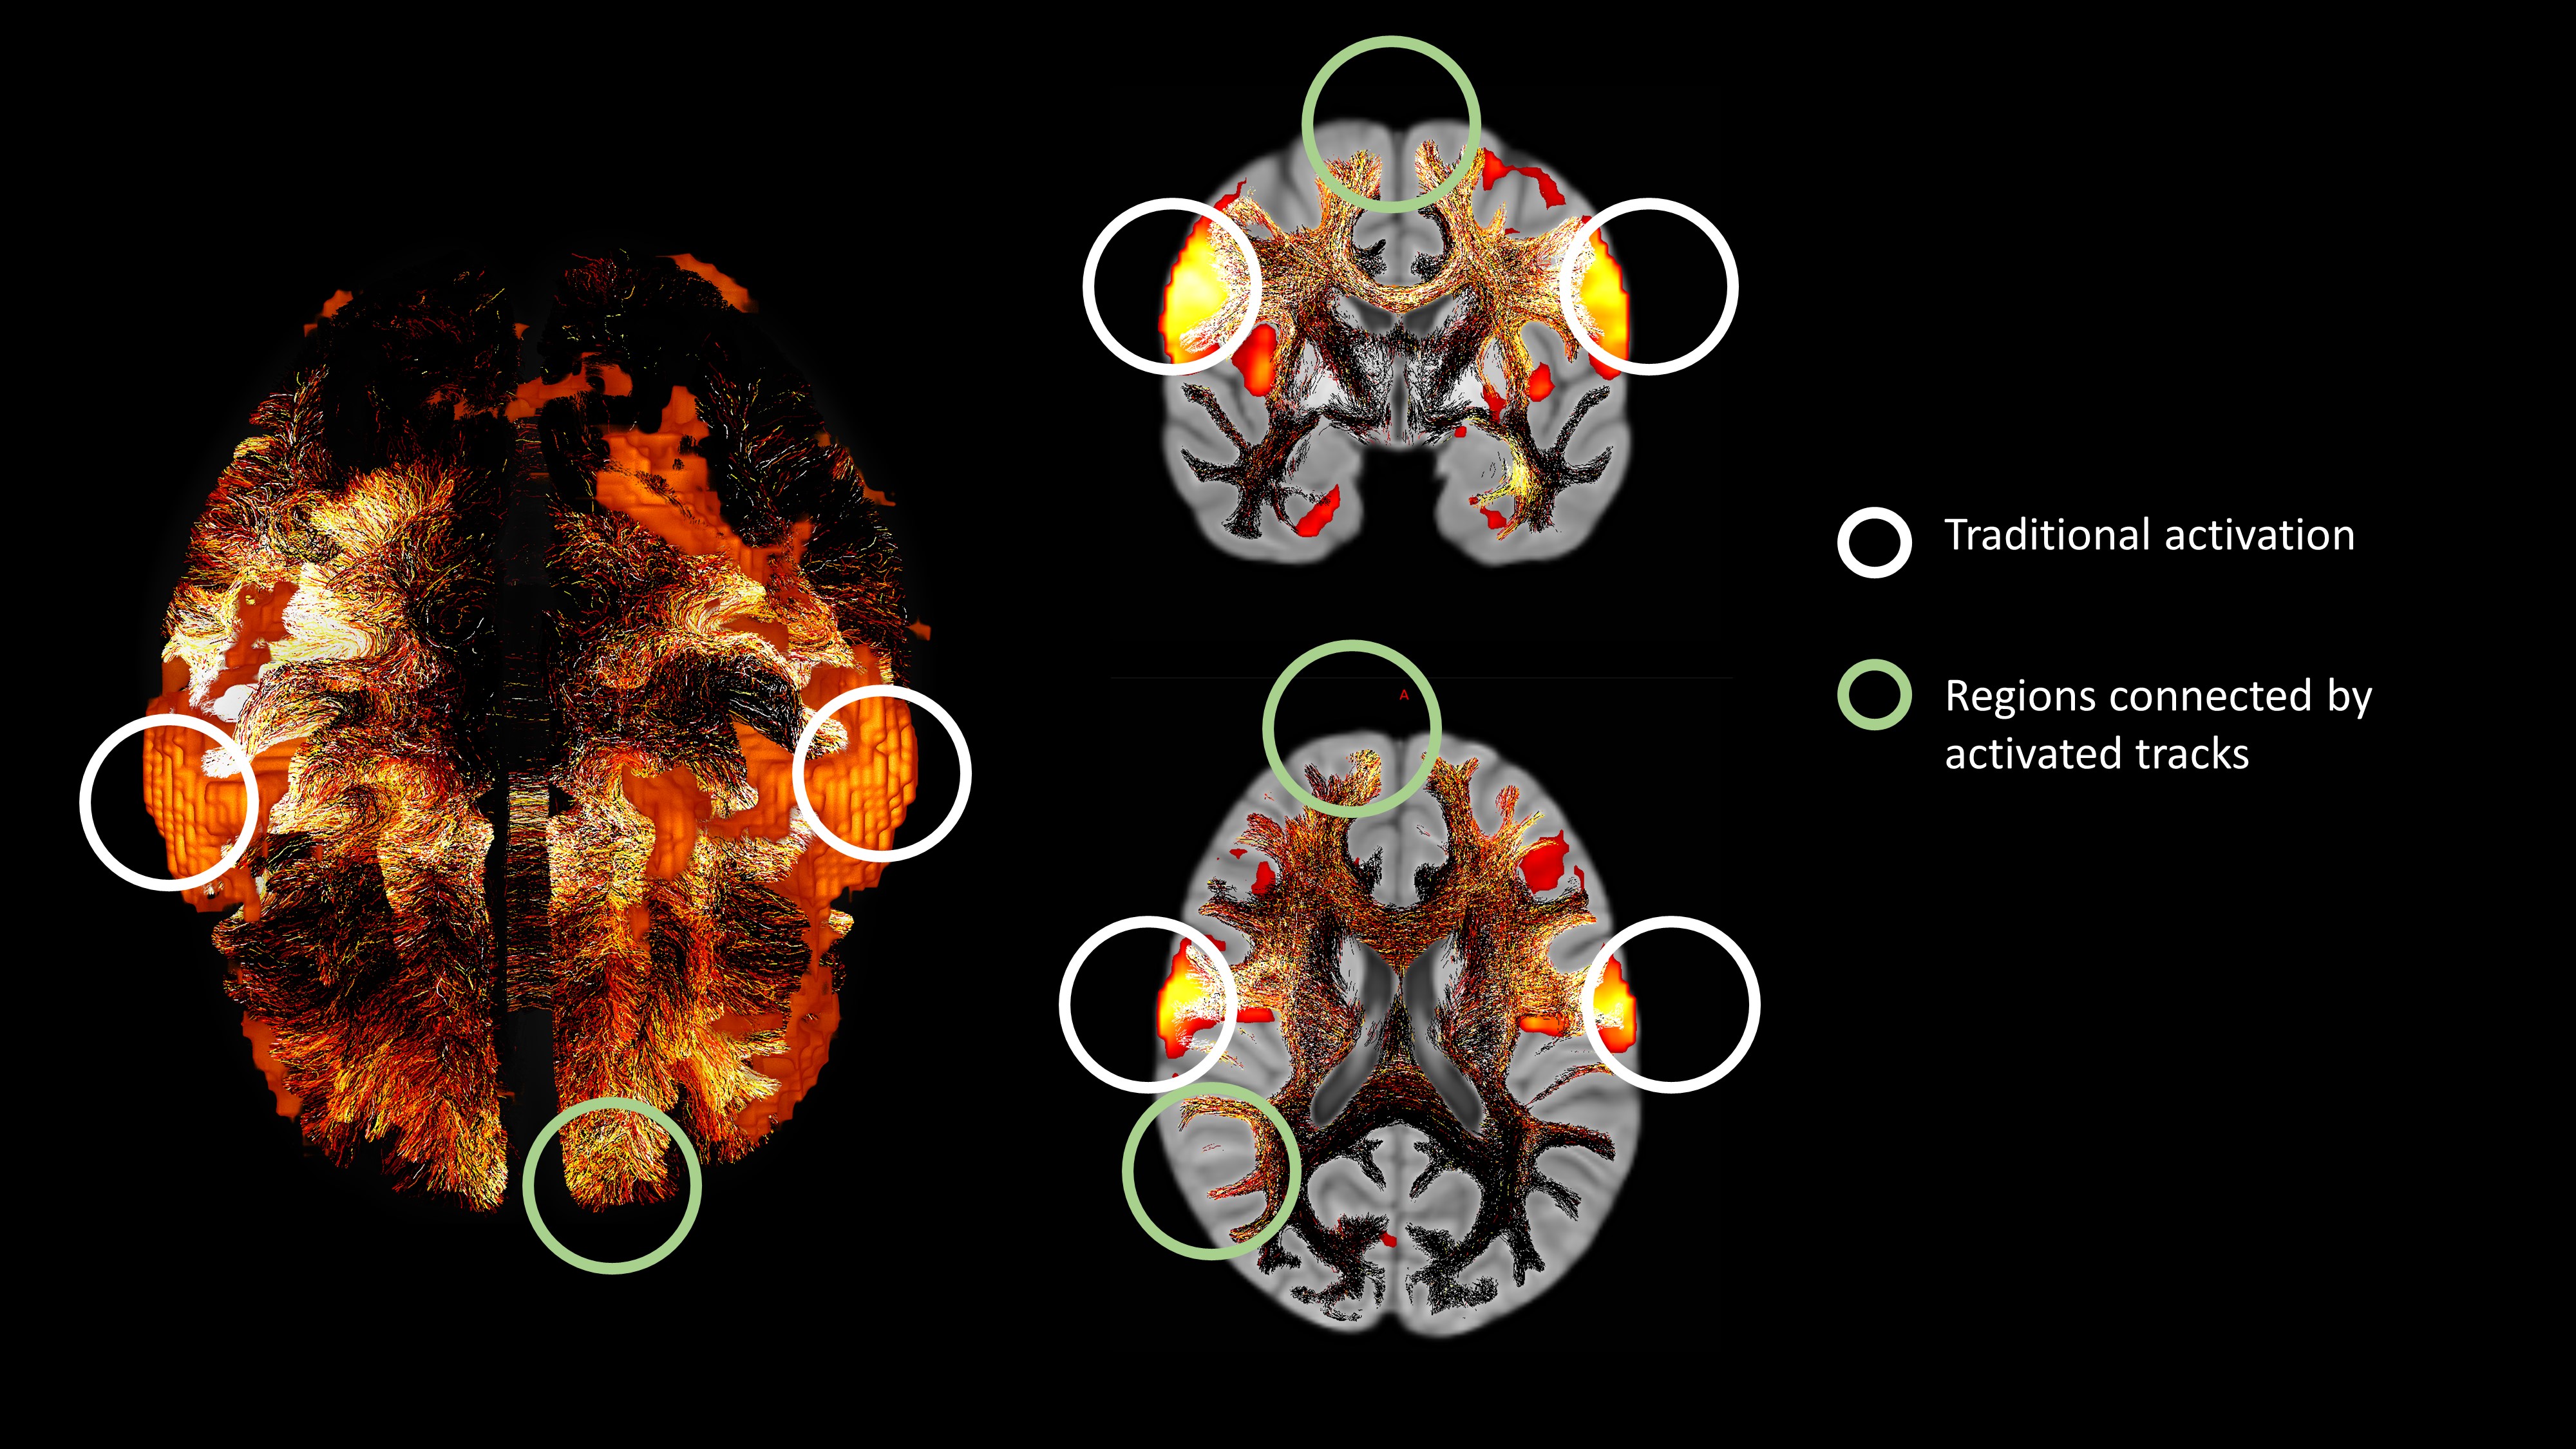
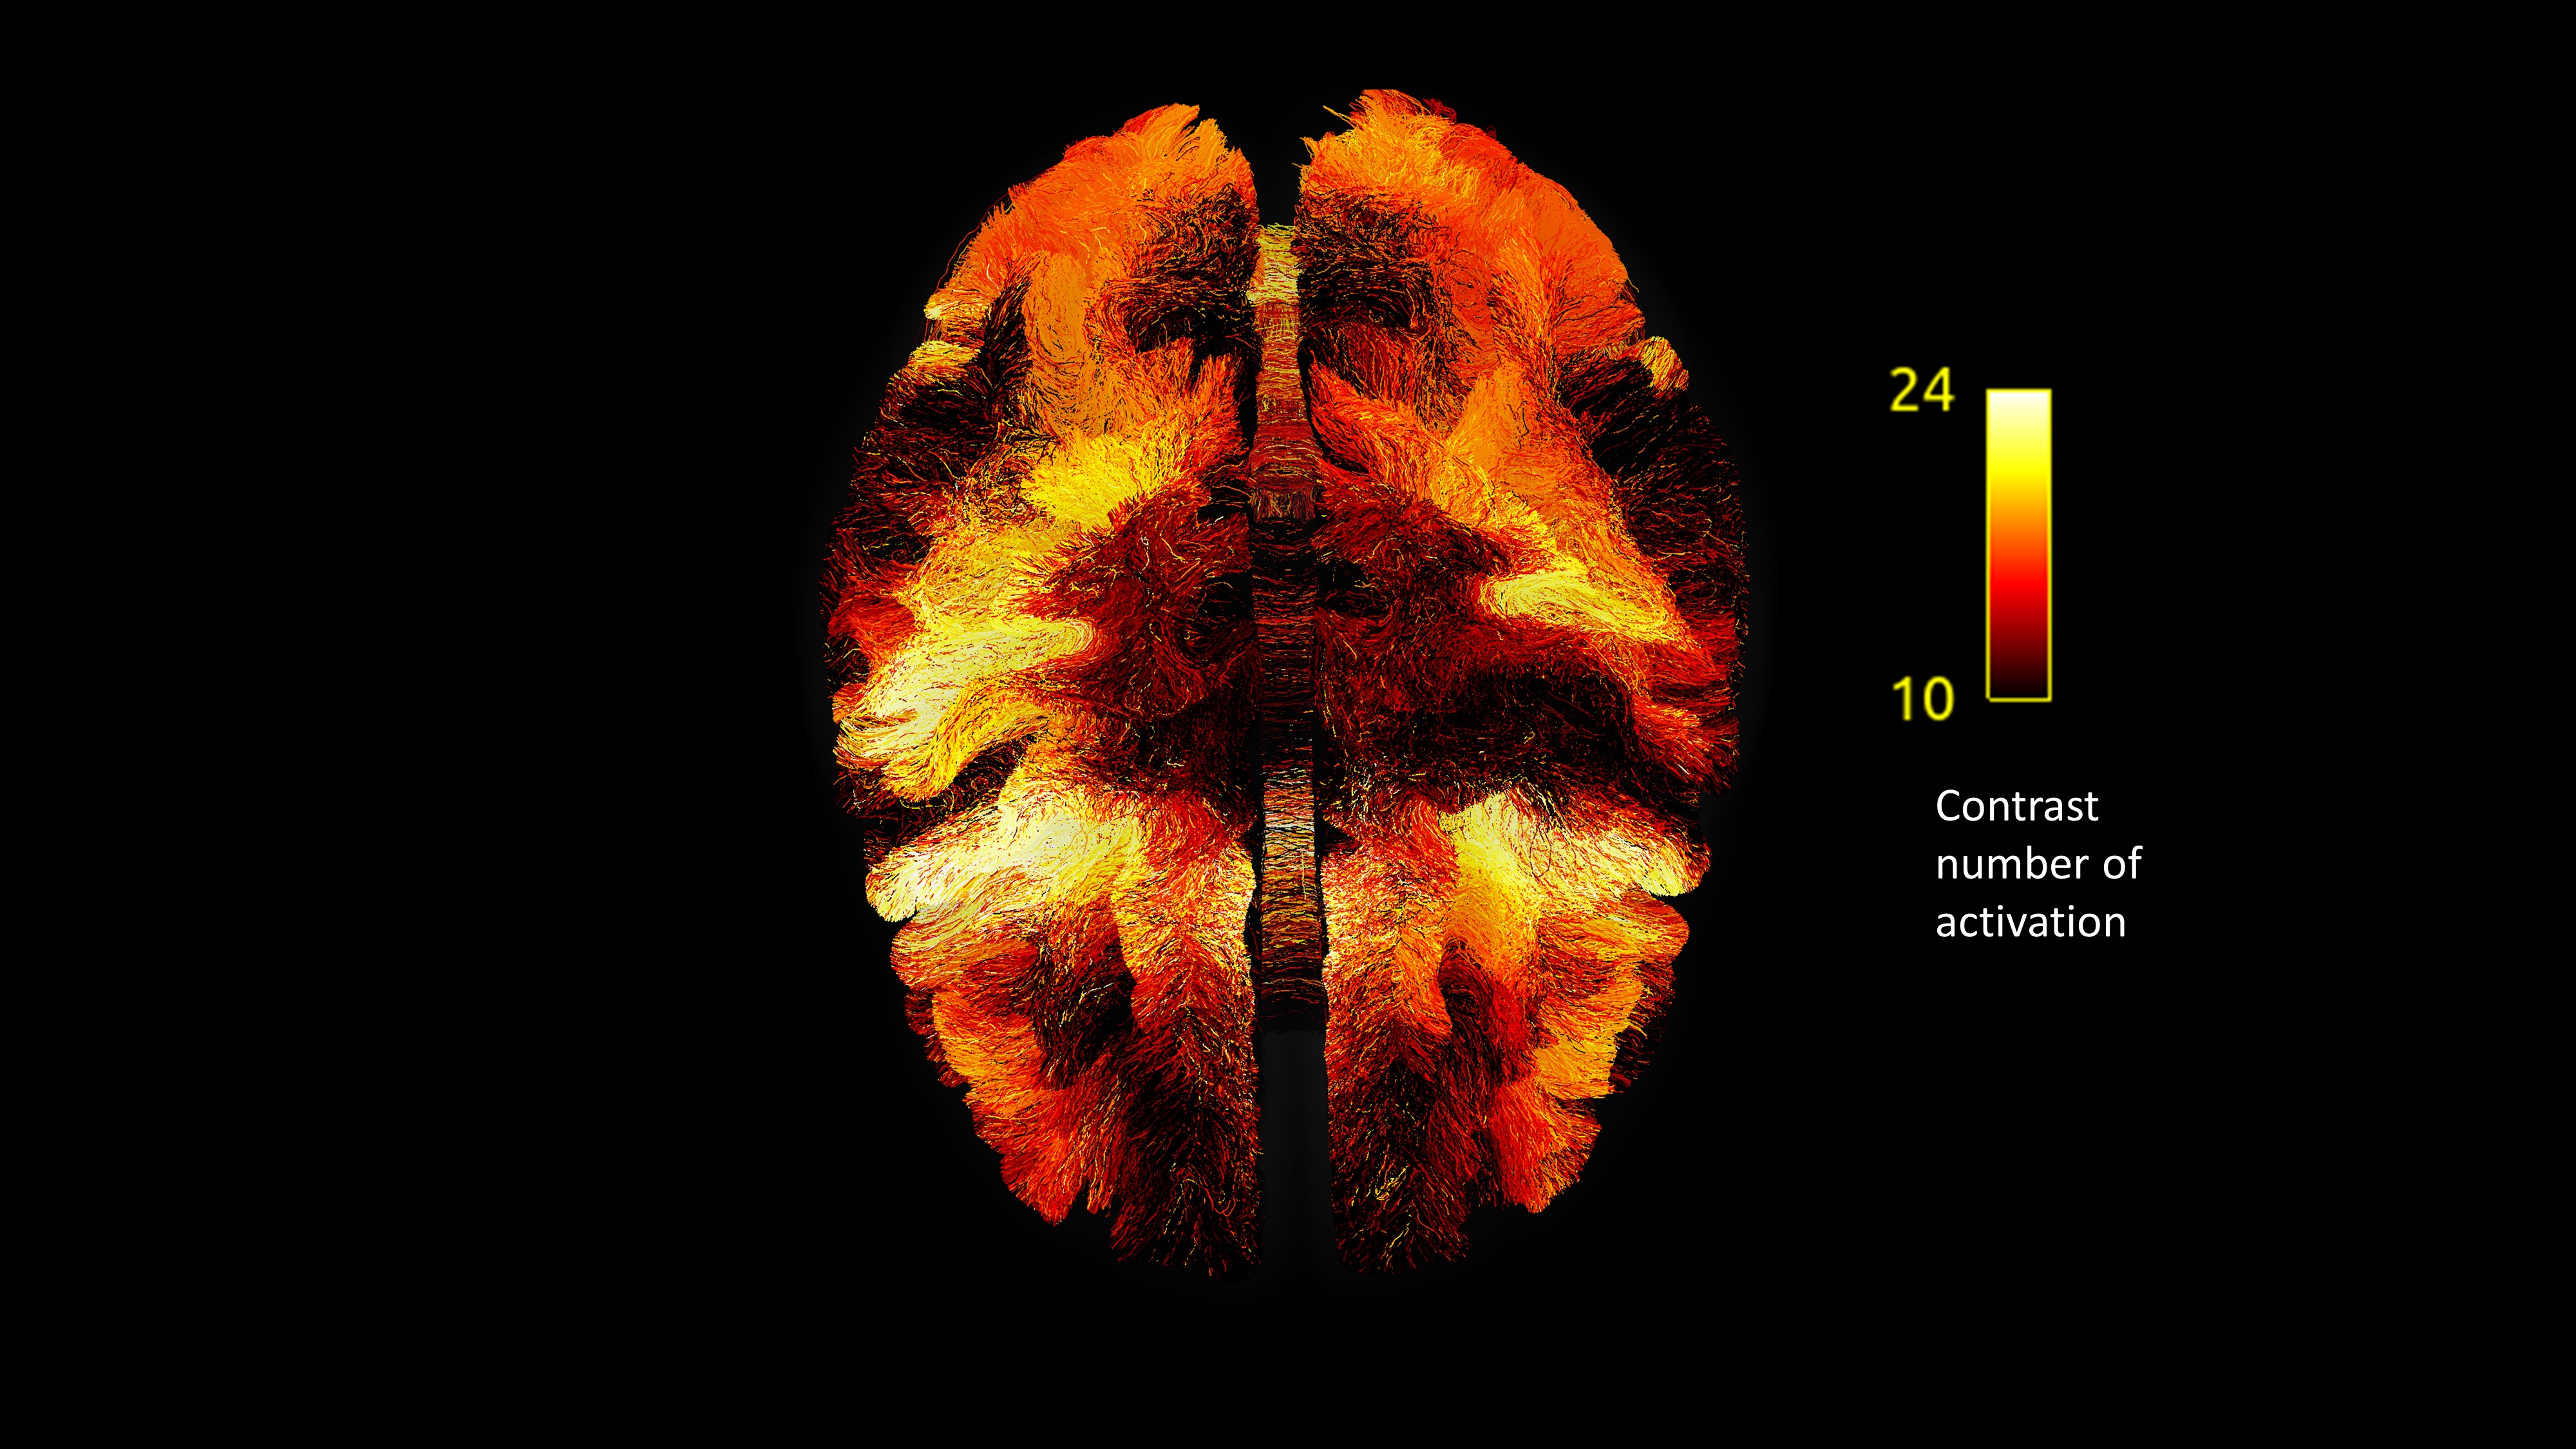
We mapped the activation of Track DFC on the tractogram template as shown in Fig.2. The threshold of z=2.3 (p=0.01) is used to determine the activation. Our results highlight a diverse set of WM tracks that are differentially related to specific task contrasts. For example, the motor activation agrees with the “Homunculus” . In addition, Our method provides more information about the WM involvement and the connected additional GM regions (Fig.3). This potentially implicates the GM network that is contributing to the task. We also counted the Track DFC activations in 7 tasks for each streamline and mapped the number in Fig.4. A significant number of tracks are involved in multiple tasks. This indicates the functional heterogeneity of white matter tracks.Conclusions
In summary, we have combined dMRI and fMRI to develop a novel method to detect WM tracks that are associated to specific cognitive tasks. Based on our tissue-unbiased tractogram template, we have provided the statistically sound group-wise inference. Our preliminary analysis of 50 HCP subjects and the 7 HCP tasks conclude that our method can map the functional role of WM tracks. In the future, we aim to build up a functional atlas of WM based on the proposed method.Acknowledgements
Lv is supported by BMC Development Grant, BISA Flagship Grant, and MEV Schizophrenia program.
Calamante and Lv are supported by the ARC Discovery Project Grant.
References
[1] J. Lv, L. Guo, K. Li, X. Hu, D. Zhu, J. Han, T. Liu, Activated fibers: fiber-centered activation detection in task-based FMRI, in: Biennial International Conference on Information Processing in Medical Imaging, Springer, Berlin, Heidelberg, 2011: pp. 574–587.
[2] J. Lv, R. Zeng, M.P. Ho, A. D’Souza, F. Calamante, Building a tissue-unbiased brain template of fiber orientation distribution and tractography with multimodal registration, Magn Reson Med. (2022) 1–14.
[3] M.F. Glasser, S.N. Sotiropoulos, J.A. Wilson, T.S. Coalson, B. Fischl, J.L. Andersson, J. Xu, S. Jbabdi, M. Webster, J.R. Polimeni, D.C. van Essen, M. Jenkinson, The minimal preprocessing pipelines for the Human Connectome Project, Neuroimage. 80 (2013) 105–124. https://doi.org/10.1016/j.neuroimage.2013.04.127.
[4] A.W. Anderson, Measurement of fiber orientation distributions using high angular resolution diffusion imaging, Magn Reson Med. 54 (2005) 1194–1206. https://doi.org/10.1002/mrm.20667.
[5] R.E. Smith, J.D. Tournier, F. Calamante, A. Connelly, Anatomically-constrained tractography: Improved diffusion MRI streamlines tractography through effective use of anatomical information, Neuroimage. 62 (2012) 1924–1938. https://doi.org/10.1016/j.neuroimage.2012.06.005.
[6] ANTs by stnava, (n.d.). http://stnava.github.io/ANTs/ (accessed January 9, 2023).
[7] J. Faskowitz, F.Z. Esfahlani, Y. Jo, O. Sporns, R.F. Betzel, Edge-centric functional network representations of human cerebral cortex reveal overlapping system-level architecture, Natw. Neurosci. 23 (2020) 1644–1654. https://doi.org/10.1038/s41593-020-00719-y.
[8] D.M. Barch, G.C. Burgess, M.P. Harms, S.E. Petersen, B.L. Schlaggar, M. Corbetta, M.F. Glasser, S. Curtiss, S. Dixit, C. Feldt, D. Nolan, E. Bryant, T. Hartley, O. Footer, J.M. Bjork, R. Poldrack, S. Smith, H. Johansen-Berg, A.Z. Snyder, D.C. van Essen, Function in the human connectome: Task-fMRI and individual differences in behavior, Neuroimage. 80 (2013) 169–189. https://doi.org/10.1016/J.NEUROIMAGE.2013.05.033.
[9] K.J. Friston, A.P. Holmes, K.J. Worsley, J. ‐P Poline, C.D. Frith, R.S.J. Frackowiak, Statistical parametric maps in functional imaging: A general linear approach, Hum Brain Mapp. 2 (1994) 189–210. https://doi.org/10.1002/HBM.460020402.
[10] G. Chen, Z.S. Saad, J.C. Britton, D.S. Pine, R.W. Cox, Linear mixed-effects modeling approach to FMRI group analysis, Neuroimage. 73 (2013) 176–190. https://doi.org/10.1016/J.NEUROIMAGE.2013.01.047.
Figures