2051
Deriving and characterizing fiber tract specific anisotropic R2 from DTI1Diagnostic Imaging, St. Jude Children's Research Hospital, Memphis, TN, United States
Synopsis
Keywords: White Matter, Relaxometry, transverse relaxation orientation dependence
Motivation: The orientation dependence of transverse relaxation R2 in the human brain white matter could be exploited as a potential myelin specific biomarker for assessing demyelinating pathologies.
Goal(s): To investigate the feasibility of characterizing fiber tract specific anisotropic R2 solely based on DTI.
Approach: A high-resolution public domain Connectome DTI dataset was used for the demonstration. Two major fiber tracts, corpus callosum and corticospinal tract, were segmented, and corresponding orientation dependent R2 profiles were quantified based on a recently developed model.
Results: Results suggested that anisotropic R2 could be extracted effectively from DTI, facilitating easy access to a potential myelin specific biomarker.
Impact: In this work, we demonstrated that a single T2-weighted image (i.e., b=0) effectively separates anisotropic R2 from its isotropic counterpart offering an efficient alternative to conventional lengthy R2 mapping method of incorporating in-vivo axon fiber orientation information from DTI.
Introduction
Water proton MR transverse relaxation rate R2 in the human brain white matter (WM) depends on the orientation of axon fibers.1 This phenomenal observation could be exploited to assess WM microstructural alterations secondary to brain early development, ageing, and other neuro pathologies. Conventionally, R2 is derived from lengthy multiple T2 weighted imaging measurements. An anisotropic (i.e., orientation-dependent) component of R2 could be separated from its isotropic (i.e., orientation-independent) counterpart based on the axon fiber orientation information inferred from standard diffusion tensor imaging (DTI).2,3 Since only the anisotropic R2 is pertinent, a single T2 weighted (T2W) image is adequate for distinguishing it from the isotropic R2 contribution given the same orientation information.4 In this work, we demonstrate that the fiber tract specific anisotropic R2 can be extracted and characterized based exclusively on standard DTI.Methods
A high-resolution (760 μm3) Connectome DTI dataset of in vivo human brain in public domain5 was utilized, where six (b=1000 s/mm2) and twelve (b=2500 s/mm2) preprocessed data subsets from a single subject were separately analyzed using FSL DTIFIT software.6 The fitted model parameters included eigenvalues ($$$λ_1$$$, $$$λ_2$$$, $$$λ_3$$$), eigenvectors ($$$e ̂_1$$$,$$$e ̂_2$$$,$$$e ̂_3$$$) ), FA (fractional anisotropy), MO (mode of anisotropy), and T2W signal ($$$SO$$$) with $$$b=0$$$. With a known TE=75ms used in DTI, anisotropic R2 can be extracted based on orientation dependent $$$SO$$$ as shown in Eq.1,$$ ln SO / TE = C_0 - R_2^a * f(α, φ - ε_0) (Eq.1)$$
$$ f(α,ε) = 1/4 (3 cos^2α - 1)^2 (3cos^2ε - 1)^2 + 9/8 (sin^4α sin^4ε + sin^22α sin^22ε) (Eq.2)$$
Herein, a constant $$$C_0$$$ denotes $$$ln S_0 / TE - R_2^i$$$, with $$$SO = S_0 *exp(-R_2*TE)$$$ and $$$SO$$$ equal to $$$S_0$$$ when $$$TE=0$$$. $$$R_2^i$$$ and $$$R_2^a$$$ respectively represent isotropic and anisotropic R2. An orientation dependent function,7 f(α,ε), is expressed by Eq.2, with $$$α$$$ and $$$ε$$$ (i.e., $$$Φ-ε_0$$$) specifying, respectively, an open angle of the cone model characterizing a residual dipolar coupling (or bound water) distribution and an axon fiber angle relative to the static magnetic field $$$B_0$$$ direction. $$$Φ$$$ was calculated from the primary eigenvector $$$e ̂_1$$$, i.e., $$$cosΦ=(e ̂_1.B_0) ⁄ ‖e ̂_1.B_0 ‖ $$$, and $$$ε_0$$$ was a phase shift.8
The corpus callosum (CC) and the corticospinal tract (CST) were segmented using the TractSeg tool.9 Specifically, the preprocessed DTI data were first aligned with the Montreal Neurological Institute (MNI) space using the standard FA template from FSL. The aligned data were used as input for TractSeg tool to generate the Fiber Orientation Distribution (FOD) peak images and thus to pinpoint the white matter tracts of interest. Finally, these selected tracts in the MNI space served as WM voxel masks that were transformed back to their original space. The masked voxels from these two tracts were further refined by application of thresholds of 0.5< FA <0.9 and 0.5< MO <1.0. The measured SO (in a logarithmic scale) from these selected voxels in the two tracts were separately sorted, based on their respective $$$Φ$$$, and then averaged into 30 different bins spanning from 0 to 90°.
Results and Discussion
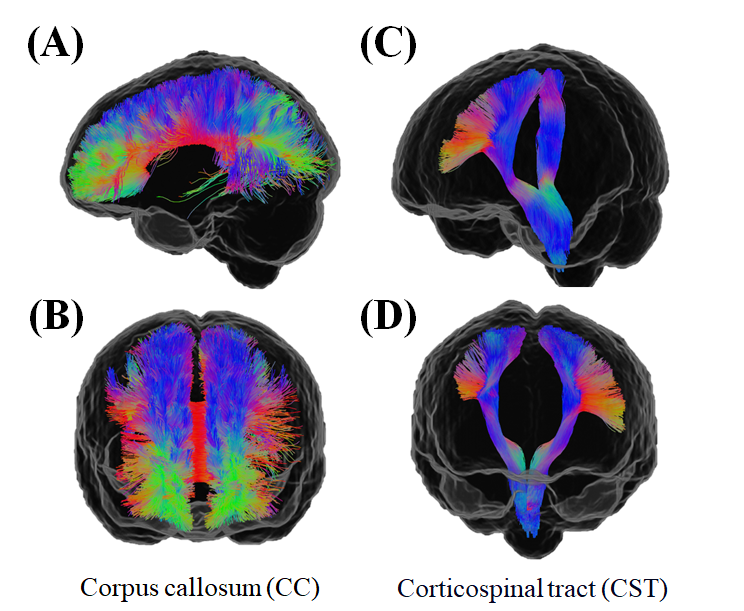
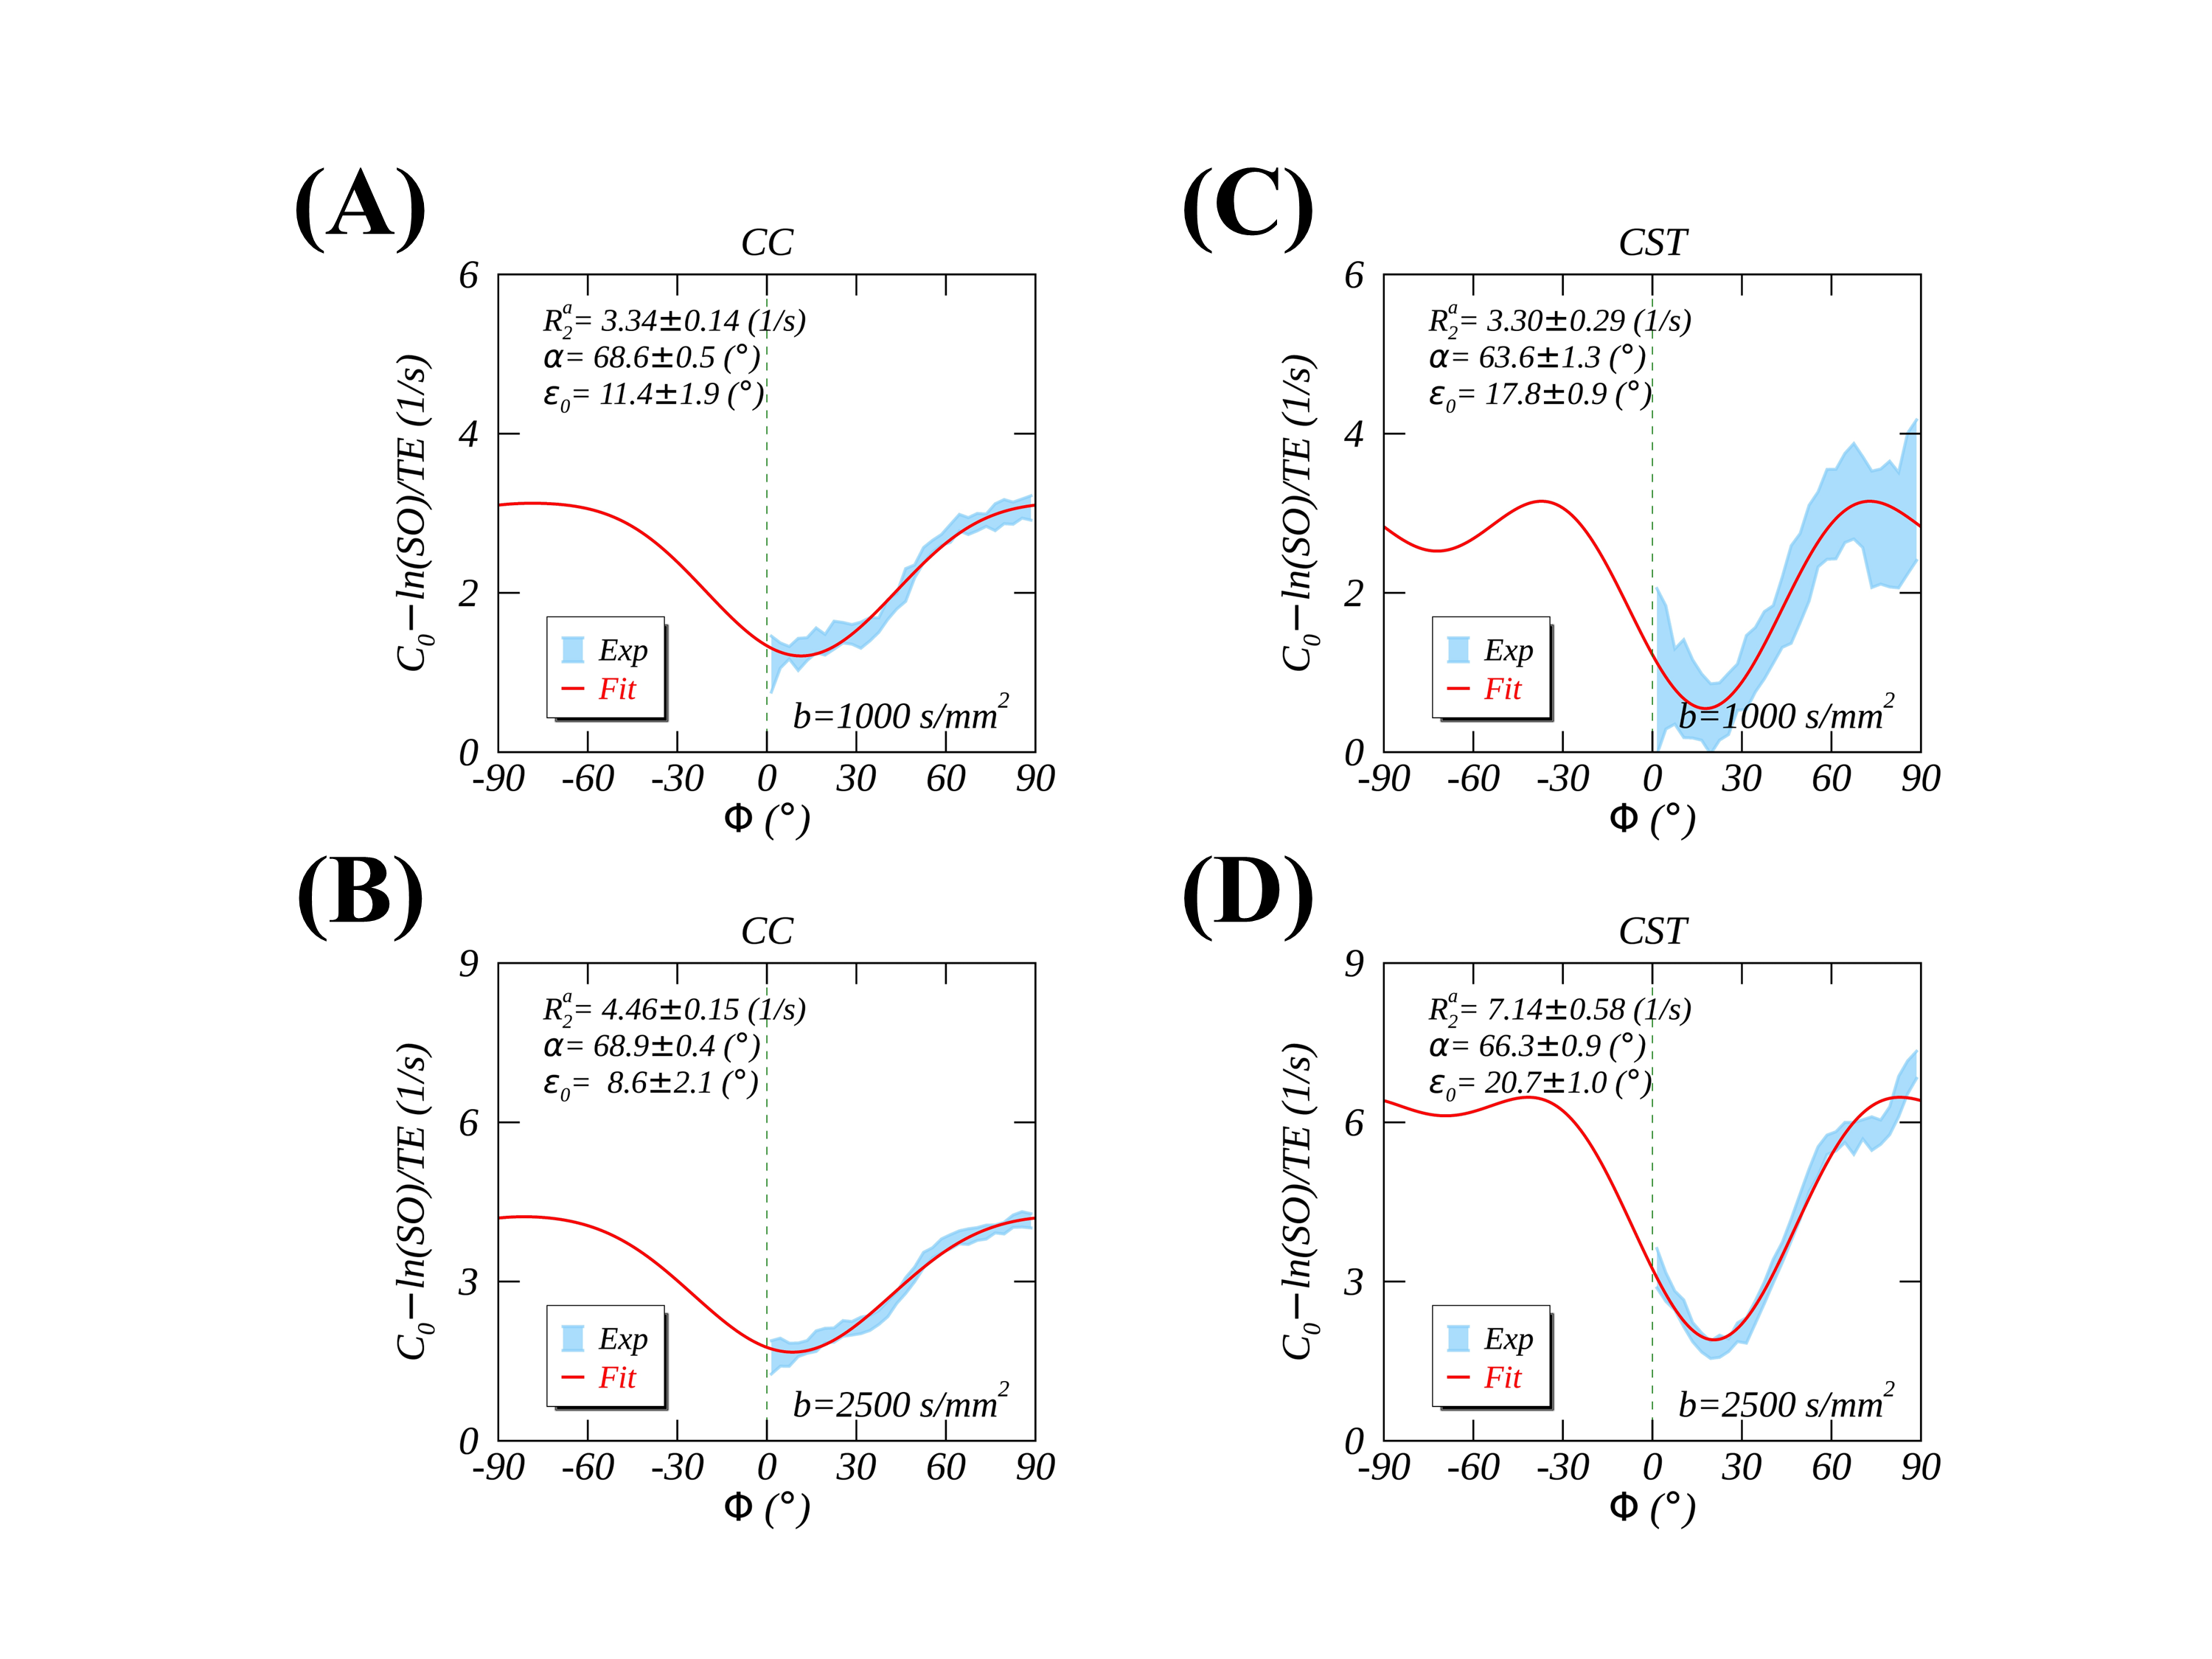
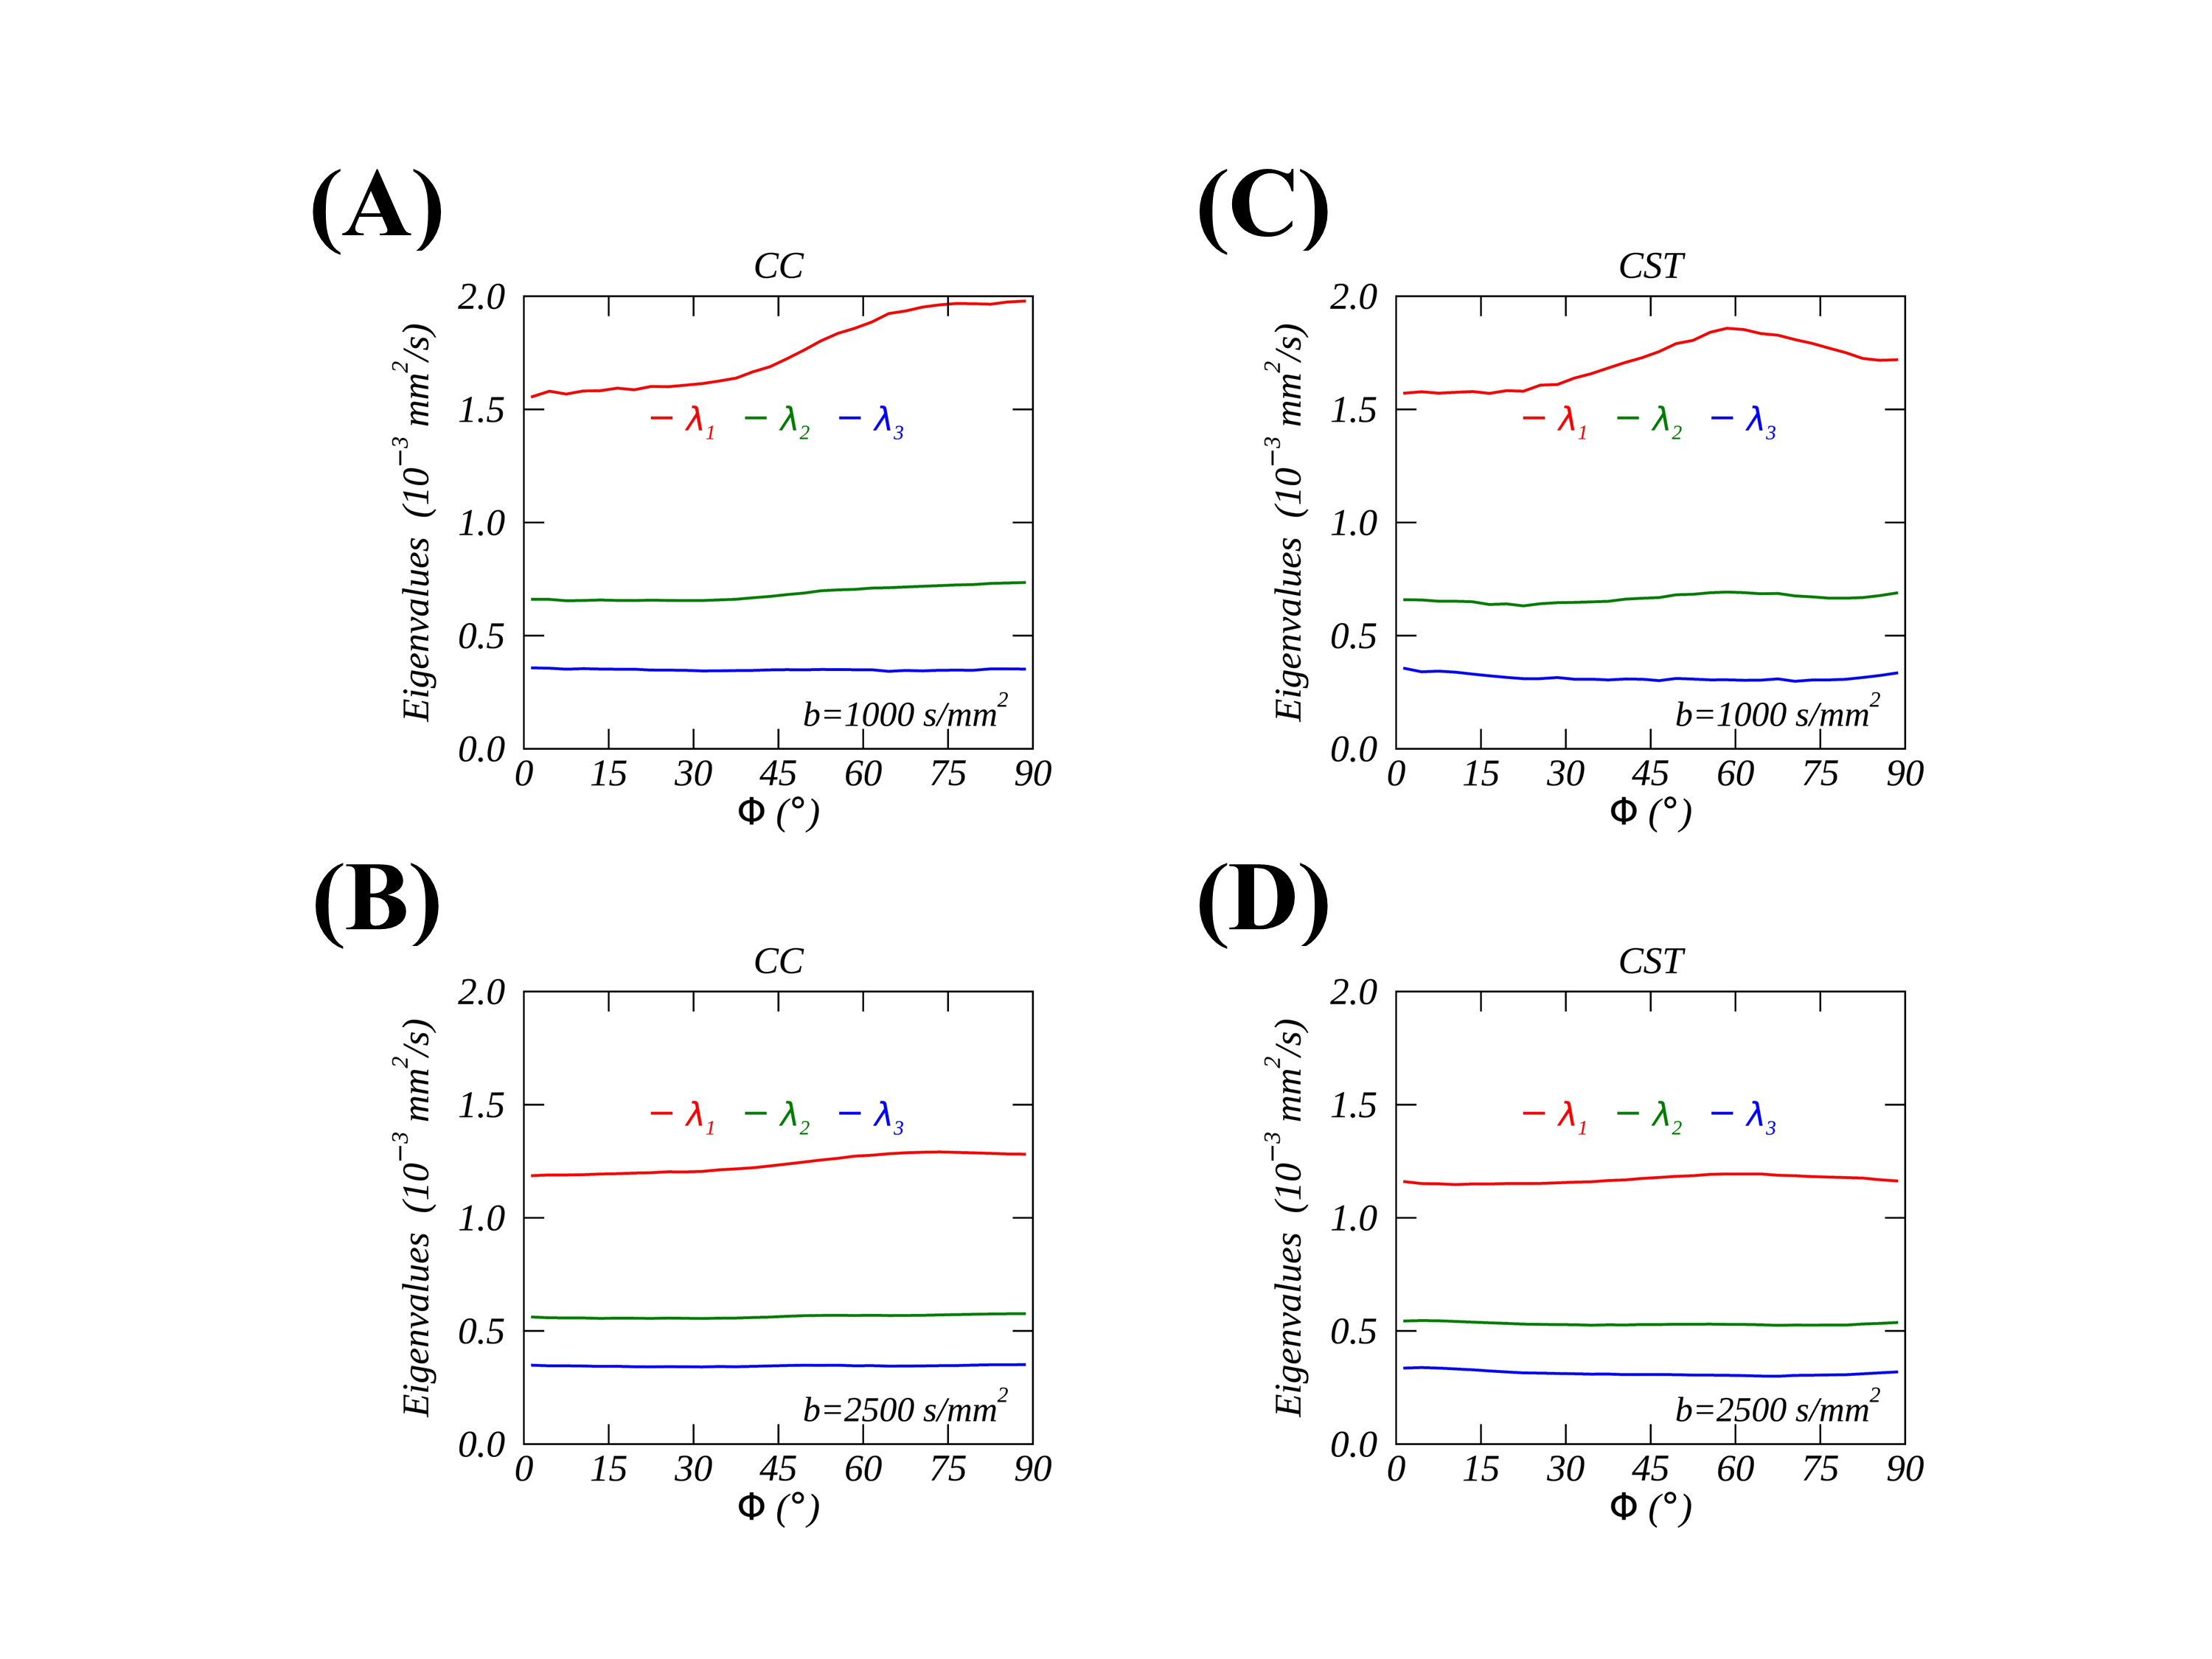
Fig.1 presents the CC (A and B) and CST (C and D) fiber tracts in the sagittal (A and C) and axial (B and D) views. Compared with CC, CST appears more coherent and is thus represented by a smaller number of voxels (data not shown). The measured (light blue ribbons) and fitted (red solid lines) orientation (Φ) dependences of R2 are profiled in Fig. 2 for CC (A and B) and CST (C and D) with b=1000 (A and C) and 2500 s/mm2 (B and D). The fitted model parameters are also embedded in individual figures. All profiles are phase shifted, i.e., $$$ε_0>0$$$ and $$$α$$$ is close to 70° except for CST at a lower b value (C). More importantly, $$$R_2^a$$$ increases with an increasing b value. Fig. 3 shows the orientation dependent DTI eigenvalues for CC (A and B) and CST (C and D) with two b values, revealing a substantial nonuniform primary diffusivity $$$λ_1$$$. This finding is consistent with previously reported orientation-dependent FA and mean diffusivity (MD).10 Furthermore, $$$λ_1$$$ decreases more at a higher b value when compared with the secondary $$$λ_2$$$ and the tertiary $$$λ_3$$$ diffusivities, which contributes significantly to the reduced FA and MD as previously reported.11Conclusion
An orientation-dependent R2 relaxation profile can be derived from the standard DTI and further quantified to provide a myelin specific relaxation biomarker. The proposed method thus offers a unique opportunity to reassess the existing and to optimize new clinical DTI studies for characterizing WM microstructural changes in both healthy and diseased subjects.Acknowledgements
This work was partially supported by the American Lebanese Syrian Associated Charities (ALSAC) at St. Jude Children’s Research Hospital.References
1. Tax CMW, Kleban E, Chamberland M, Baraković M, Rudrapatna U, Jones DK. Measuring compartmental T(2)-orientational dependence in human brain white matter using a tiltable RF coil and diffusion-T(2) correlation MRI. Neuroimage. 2021;236:117967.
2. Bartels LM, Doucette J, Birkl C, Zhang Y, Weber AM, Rauscher A. Orientation dependence of R2 relaxation in the newborn brain. NeuroImage. 2022;264:119702.
3. Knight MJ, Smith‐Collins A, Newell S, Denbow M, Kauppinen RA. Cerebral white matter maturation patterns in preterm infants: an MRI T2 relaxation anisotropy and diffusion tensor imaging study. J Neuroimaging. 2018;28(1):86-94.
4. Pang Y, Palmieri-Smith RM, Malyarenko DI, Swanson SD, Chenevert TL. A unique anisotropic R2 of collagen degeneration (ARCADE) mapping as an efficient alternative to composite relaxation metric (R2 -R1 rho ) in human knee cartilage study. Magn Reson Med. 2019;81(6):3763-3774.
5. Wang F, Dong Z, Tian Q, et al. In vivo human whole-brain Connectom diffusion MRI dataset at 760 µm isotropic resolution. Sci Data. 2021;8(1):1-12.
6. Smith SM, Jenkinson M, Woolrich MW, et al. Advances in functional and structural MR image analysis and implementation as FSL. Neuroimage. 2004;23:S208-S219.
7. Pang Y. Orientation dependent proton transverse relaxation in human brain white matter: The magic angle effect on a cylindrical helix. Magnetic Resonance Imaging. 2023;100:73-83.
8. Pang Y. Phase shifted transverse relaxation orientation dependences in human brain white matter. NMR Biomed. 2023;10.1002/nbm.4925doi:10.1002/nbm.4925
9. Wasserthal J, Neher P, Maier-Hein KH. TractSeg-Fast and accurate white matter tract segmentation. NeuroImage. 2018;183:239-253.
10. Kleban E, Jones DK, Tax CM. The impact of head orientation with respect to B0 on diffusion tensor MRI measures. Imaging Neuroscience. 2023;1:1-17.
11. Yao J, Tendler BC, Zhou Z, et al. Both noise‐floor and tissue compartment difference in diffusivity contribute to FA dependence on b‐value in diffusion MRI. Hum Brain Mapp. 2022:1-18.
Figures