2050
Comparison of white matter bundle structure between humans and macaques.1Faculty of Engineering, Information and Systems, University of Tsukuba, Ibaraki, Japan, 2National Institute of Advanced Industrial Science and Technology (AIST), Ibaraki, Japan, 3Jikei University School of Medicine, Tokyo, Japan, 4Graduate School of Comprehensive Human Sciences, University of Tsukuba, Ibaraki, Japan
Synopsis
Keywords: Structural Connectivity, White Matter
Motivation: Comparative studies on brain structure between humans and macaques across entire brain have not been thoroughly conducted.
Goal(s): The goal of this study is to show the similarities and differences of structural connectivity (SC) in humans and macaques.
Approach: SC was calculated from diffusion-weighted imaging. Based on the SC, the similarity and Least Absolute Shrinkage and Selection Operator (LASSO) were used.
Results: High similarity of SC between and within species was observed. LASSO yielded feature extraction of 12 connections.
Impact: This study clearly showed the similarity of white matter structure between and within species in humans and macaques. The method of this study is quantitative and provides valuable insights in translational research.
Introduction
Magnetic resonance imaging (MRI) is a promising tool to acquire brain images in between humans and animal models. However, it is not enough to understand the difference in white matter structure between and within species. The similarity between the human and the macaque local brain has been investigated1,2, but there are few reports comparing the similarity of white matter structure between species across the entire brain. In this study, using structural connectivity (SC), we investigated the similarity of white matter structure between humans and macaques, or within individuals. Furthermore, the feature connections that characterized the difference between species were estimated.Method
Ten healthy adults (5 males, 5 females, mean age 27.0 ± 7.6 years old) and ten macaques (Macaca fuscata, male, mean age 6.0 ± 1.0 years old) were used. Brain images were acquired using a 3T MRI with 32 channel head coil for humans and 8 channel brain array coil for macaques. The macaques were anesthetized using a mixture of medetomidine (0.05 mg/kg), midazolam (0.3 mg/kg), and ketamine (0.4 mg/kg). We used a diffusion-weighted spin-echo planer imaging (EPI) sequence for diffusion weighted imaging (DWI). DWI for humans was following parameters: TR/TE = 7,950/95 ms, 2.0 mm iso-voxel, b-value = 1000 s/mm2, and 32 directions. For the macaques, the DWI parameters were TR/TE = 20,000/93 ms, 1.2 mm iso-voxel, b-value = 1000 s/mm2, and 32 directions. The preprocessing of DWI data, including denoising, distortion correction, eddy current correction, motion correction, B1 field inhomogeneity correction, and registration of template images to DWI images was performed. Fiber tracking was conducted with probabilistic streamlines algorithm3. SC matrix in each individual was calculated using regions of interest (ROIs) in humans and macaques and transformed into a single vector. The inter-individual similarity within each species was assessed by the correlation coefficients of SC vectors between individuals. Inter-species similarity was calculated based on the correlation coefficients from the SCs in 26 ROIs that are associated with common functions, such as motion regulation, sensation, and memory. Furthermore, we performed a Least Absolute Shrinkage and Selection Operator (LASSO) regression analysis to extract feature connections that characterize the differences in white matter structure between the two species.Result
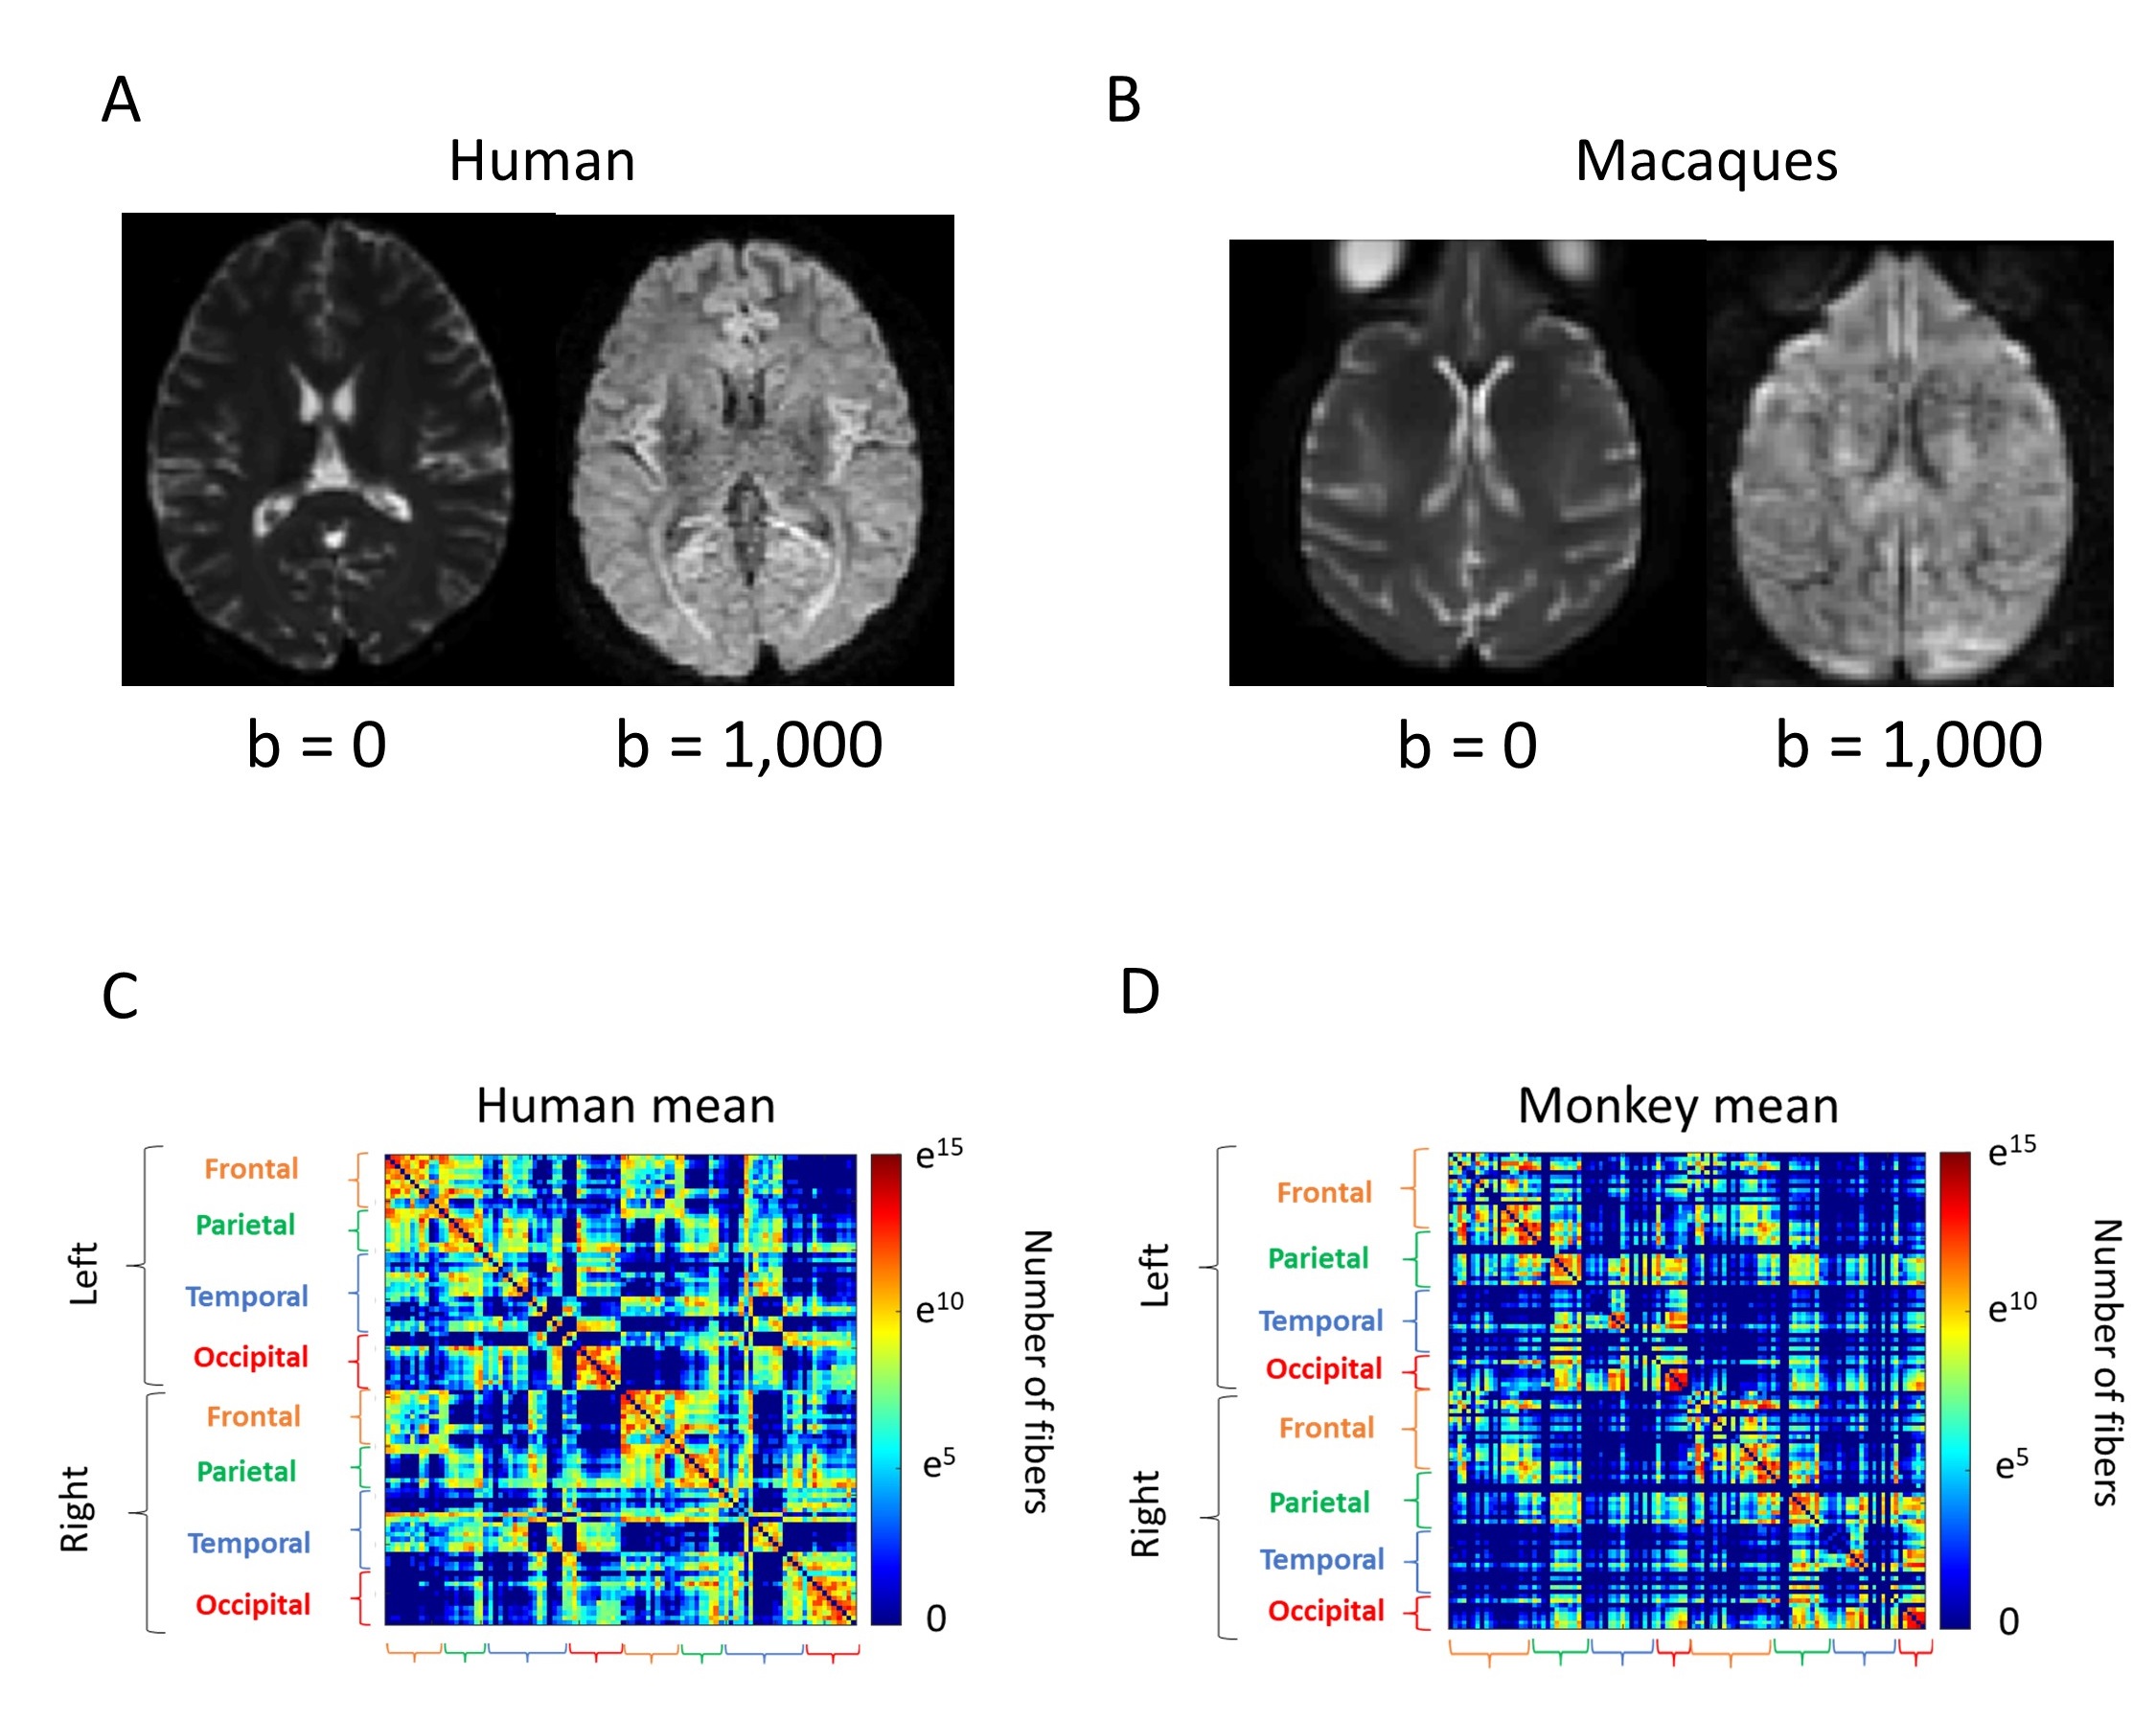
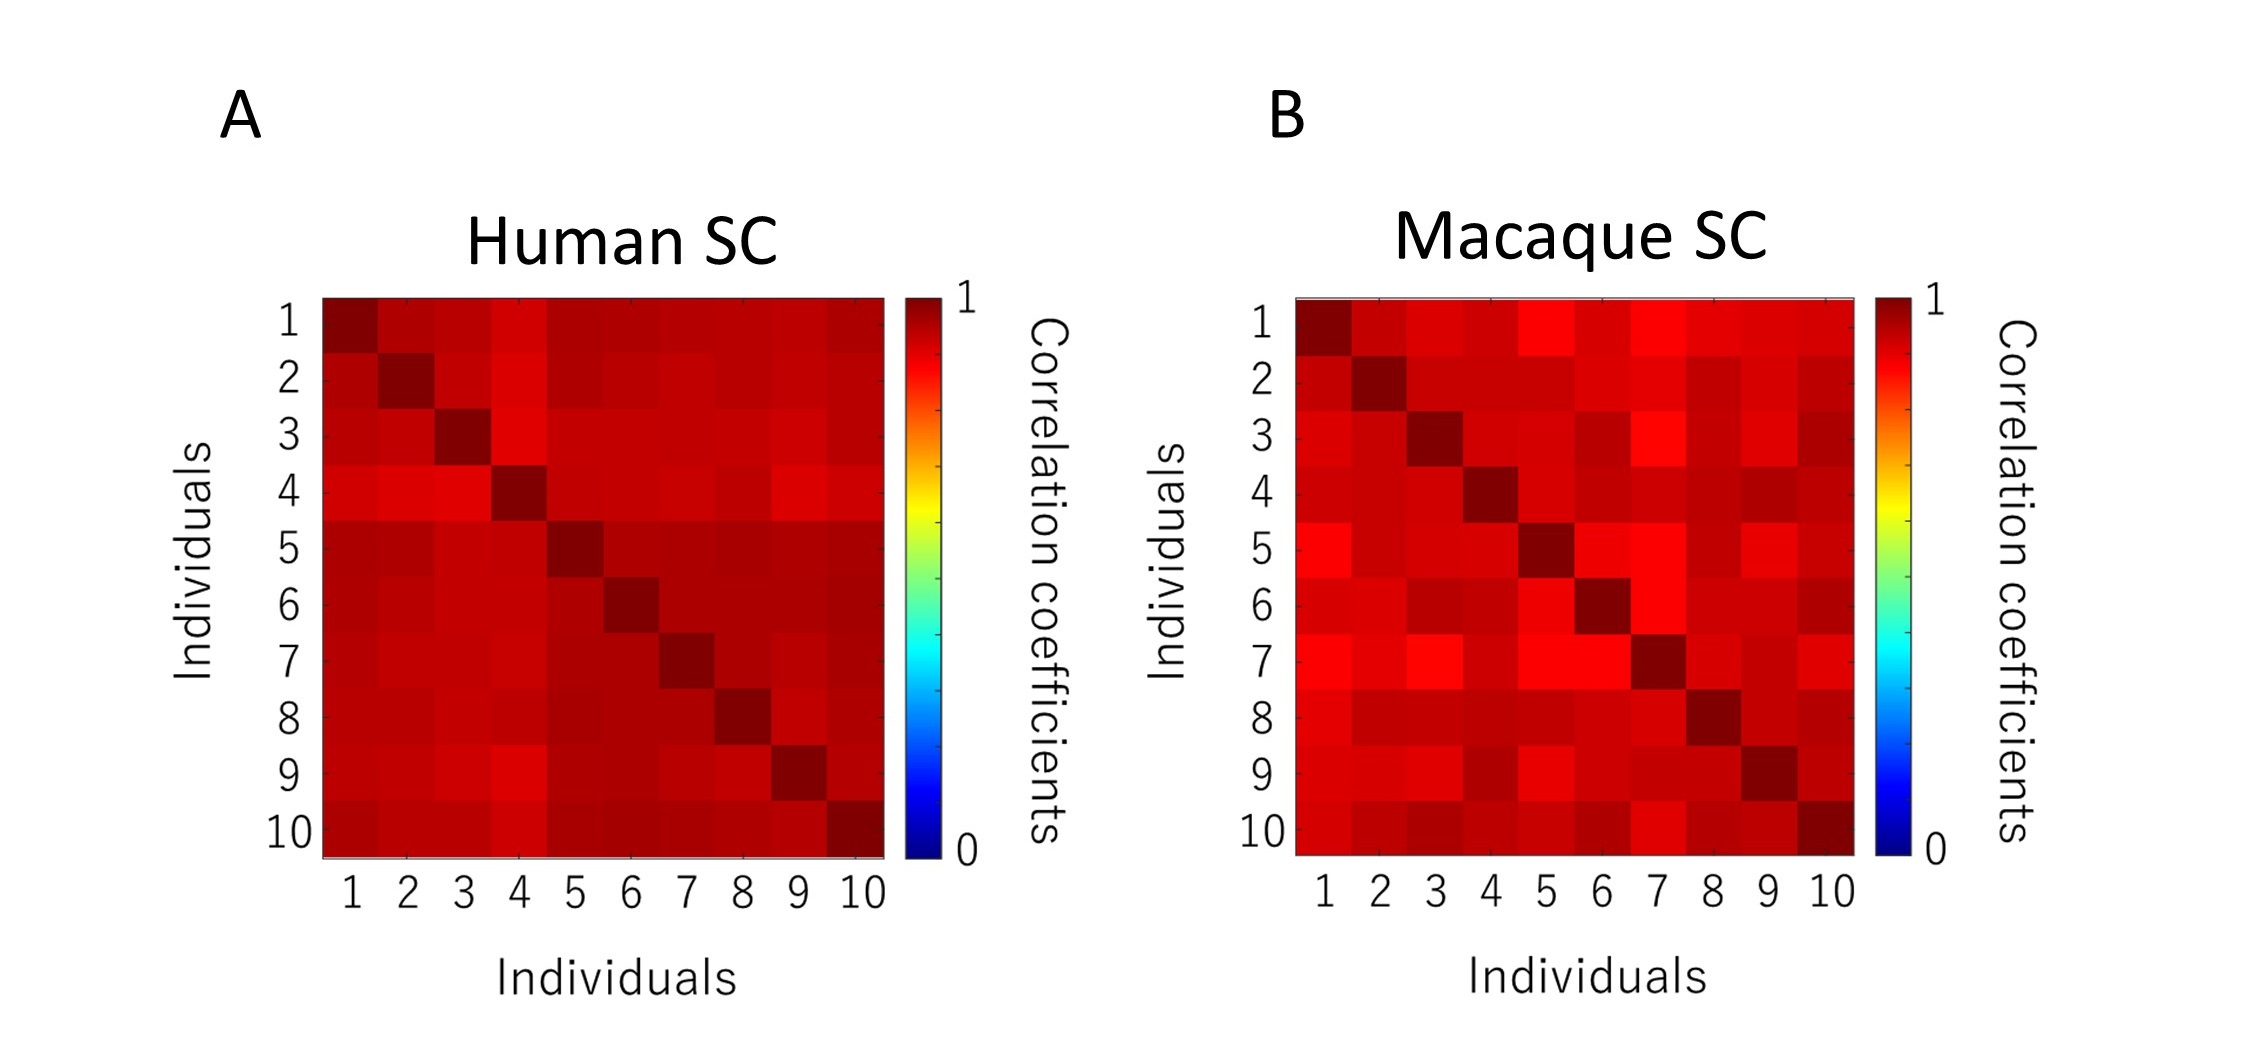
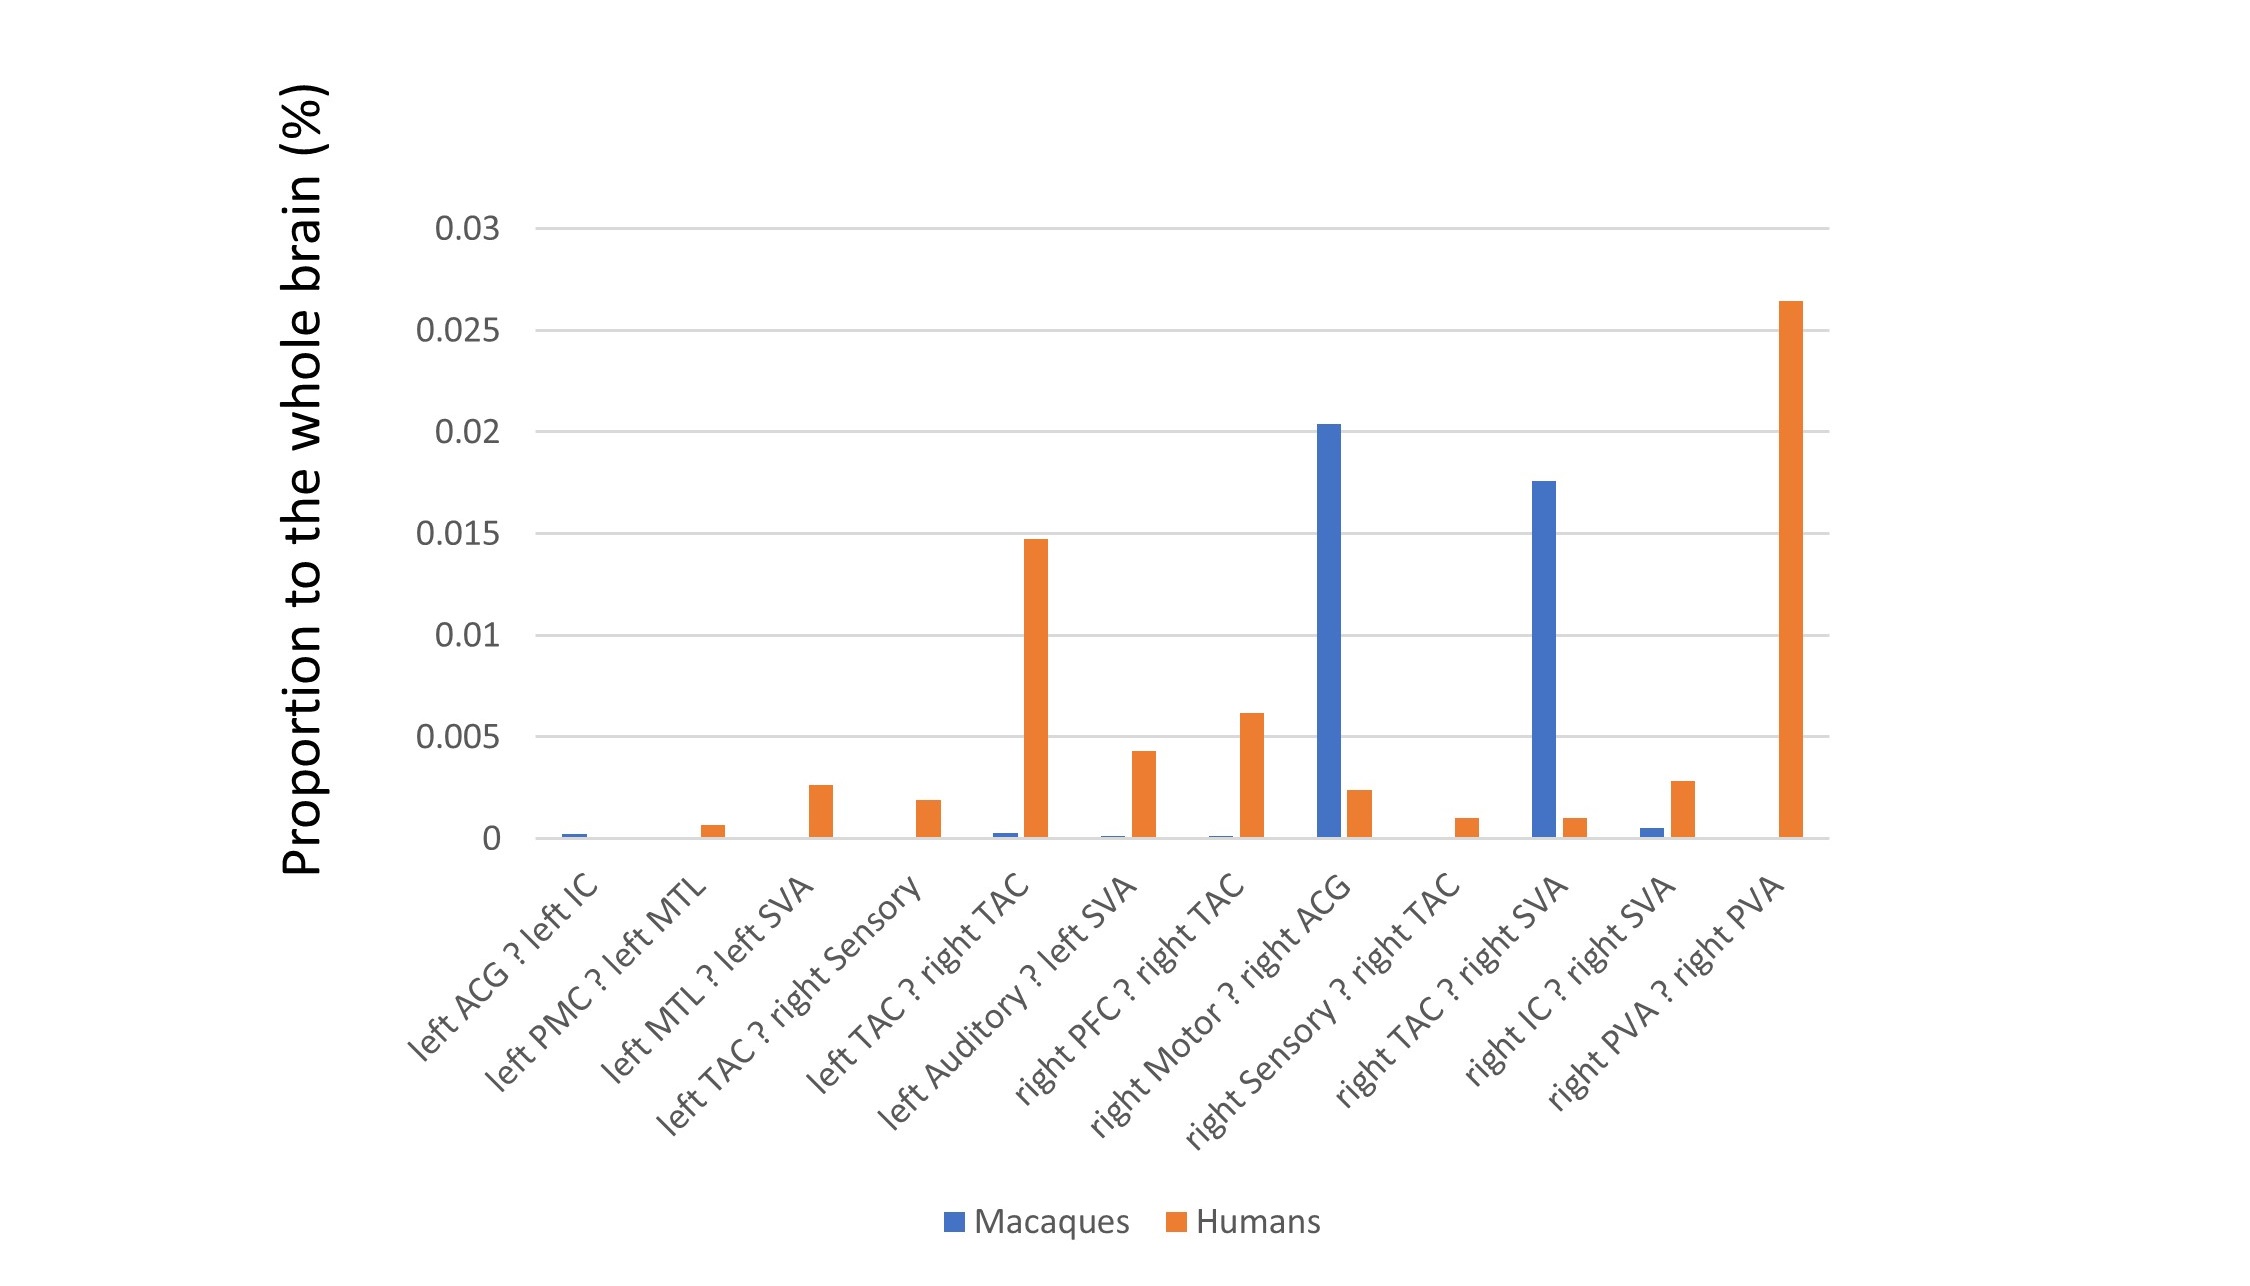
The representative images of the diffusion MRI are shown in Fig. 1. In humans, the correlation coefficients for SC were between 0.91 and 0.96 (Fig. 2A). In macaques, the correlation coefficients for SC were between 0.87 and 0.96 (Fig. 2B). The correlation coefficient of SC between species was 0.70. The result of LASSO yielded 12 feature connections (Fig. 3). Mean squared error (MSE) was 0.001.Discussion
The result demonstrated that the structure of white matter fibers is similar between both humans and macaques and within each species. It is reported that there is high similarity in SC between individuals, in humans and macaques4, supporting the results of this study. Tractography study reveals that several fibers in the occipital lobe are evidently homologous2. Moreover, tractography study comparing macaques with humans showed the overlap in the frontal, the temporal, and the occipital lobes6. In addition to demonstrating a high similarity in SC between species, this study identified 12 specific connections that explains the differences in white matter structure between humans and macaques. These findings provide insights into the suitability of macaques as animal models for humans.Acknowledgements
We would like to express our gratitude to the members of AIST for their support in the MRI experiment.References
- Xu, T. et al. Cross-species functional alignment reveals evolutionary hierarchy within the connectome. Neuroimage 223, (2020).
- Takemura, H. et al. Occipital White Matter Tracts in Human and Macaque. Cerebral Cortex 27, 3346–3359 (2017).
- Smith, R. E., Tournier, J. D., Calamante, F. & Connelly, A. Anatomically-constrained tractography: Improved diffusion MRI streamlines tractography through effective use of anatomical information. Neuroimage 62, 1924–1938 (2012).
- Yeh, F. C. Population-based tract-to-region connectome of the human brain and its hierarchical topology. Nat Commun 13, (2022).
- Goulas, A. et al. Comparative Analysis of the Macroscale Structural Connectivity in the Macaque and Human Brain. PLoS Comput Biol 10, (2014).
Figures