2048
Brain Connectivity and Intelligence: A Comprehensive Magnetic Resonance Imaging Analysis Illuminating the Neural Underpinnings1Department of Radiology, Juntendo University Graduate School of Medicine, Tokyo, Japan, 2Department of Data Science, Juntendo University Graduate School of Medicine, Tokyo, Japan, 3Faculty of Health Data Science, Juntendo University, Chiba, Japan
Synopsis
Keywords: Structural Connectivity, Diffusion/other diffusion imaging techniques
Motivation: To the best of our knowledge, no study in neuroscience has been conducted based on high intelligence (HI) and low intelligence (LI) groups young healthy adults.
Goal(s): This study aims to explore the effect of brain network structures on the intelligence quotient and brain efficiency of healthy adults.
Approach: We focused on the white matter’s topological traits, which demonstrate network performance and structural connectivity differences between the HI and LI groups.
Results: We found structural differences in connections between specific nodes in the HI and LI groups. Intelligence correlated positively with network efficiency and negatively with path length.
Impact: This study innovatively explores the relationship between brain network structures and intelligence in healthy young adults. This study revealed that higher intelligence is associated with efficient brain networks and greater resilience in targeted network disturbances.
Background and Purpose
In previous studies, adult data research on brain function mainly relied on functional magnetic resonance imaging (fMRI) and diffusion-weighted magnetic resonance imaging (DWI) data collected from patients [1]. Investigations based on DWI for intelligence or behavioral capability testing primarily focused on comparative analyses performed during brain development in minors [2] [3]. Previous research did not identify structural network alterations associated with the intelligence in normal adults.This study aims to investigate the effect of brain network structures on intelligence and brain efficiency in healthy adults and to verify changes in the whole-brain network (i.e., resilience) using attack simulation.Methods
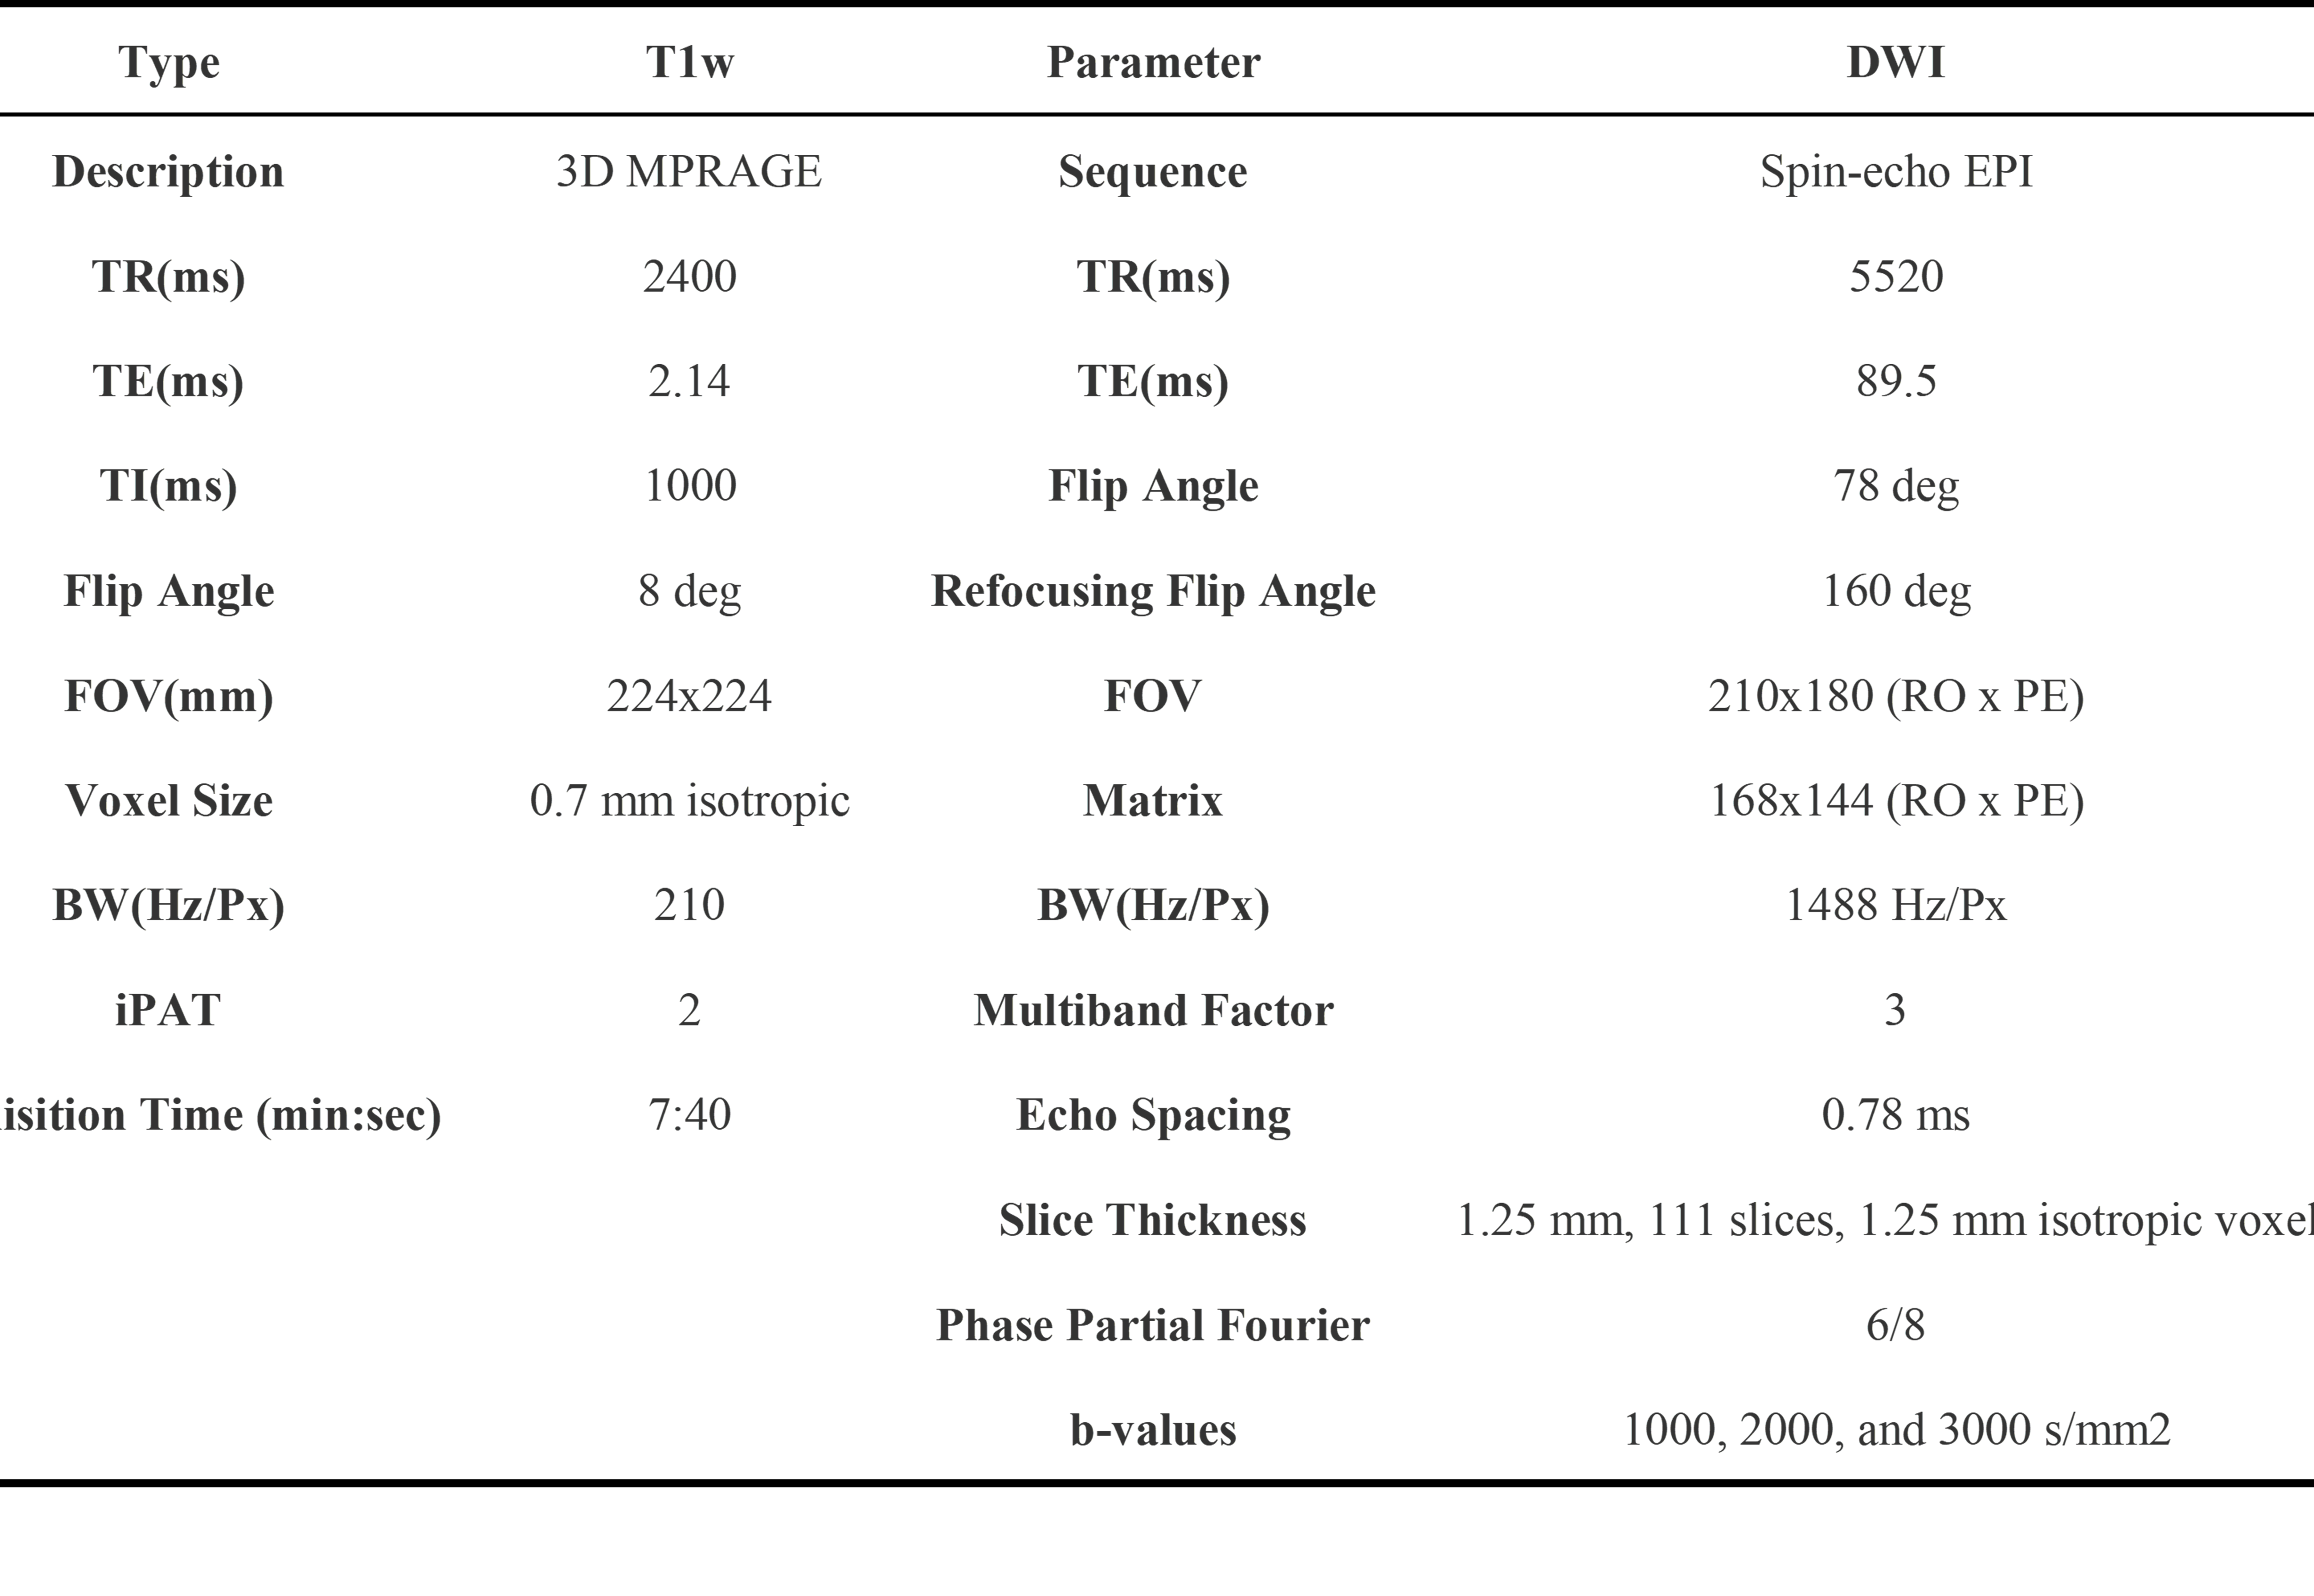
Participants and image acquisitionIn this study, we included 416 participants (age: 28.79 ± 3.68 y, Men : Women = 3:5) from the Human Connectome Project [4]. The comprehensive intelligence score was calculated based on a principal component analysis using 10 cognitive test questionnaires [5]. Based on the median values of the comprehensive intelligence scores, we categorized participants into high intelligence (HI) and low intelligence (LI) groups. Minimally preprocessed T1-weighted images (T1WI) and DWI were acquired using 3T MRI [6] equipped with a 300 mT/m with the acquisition parameters presented in Figure 1.
Brain network construction
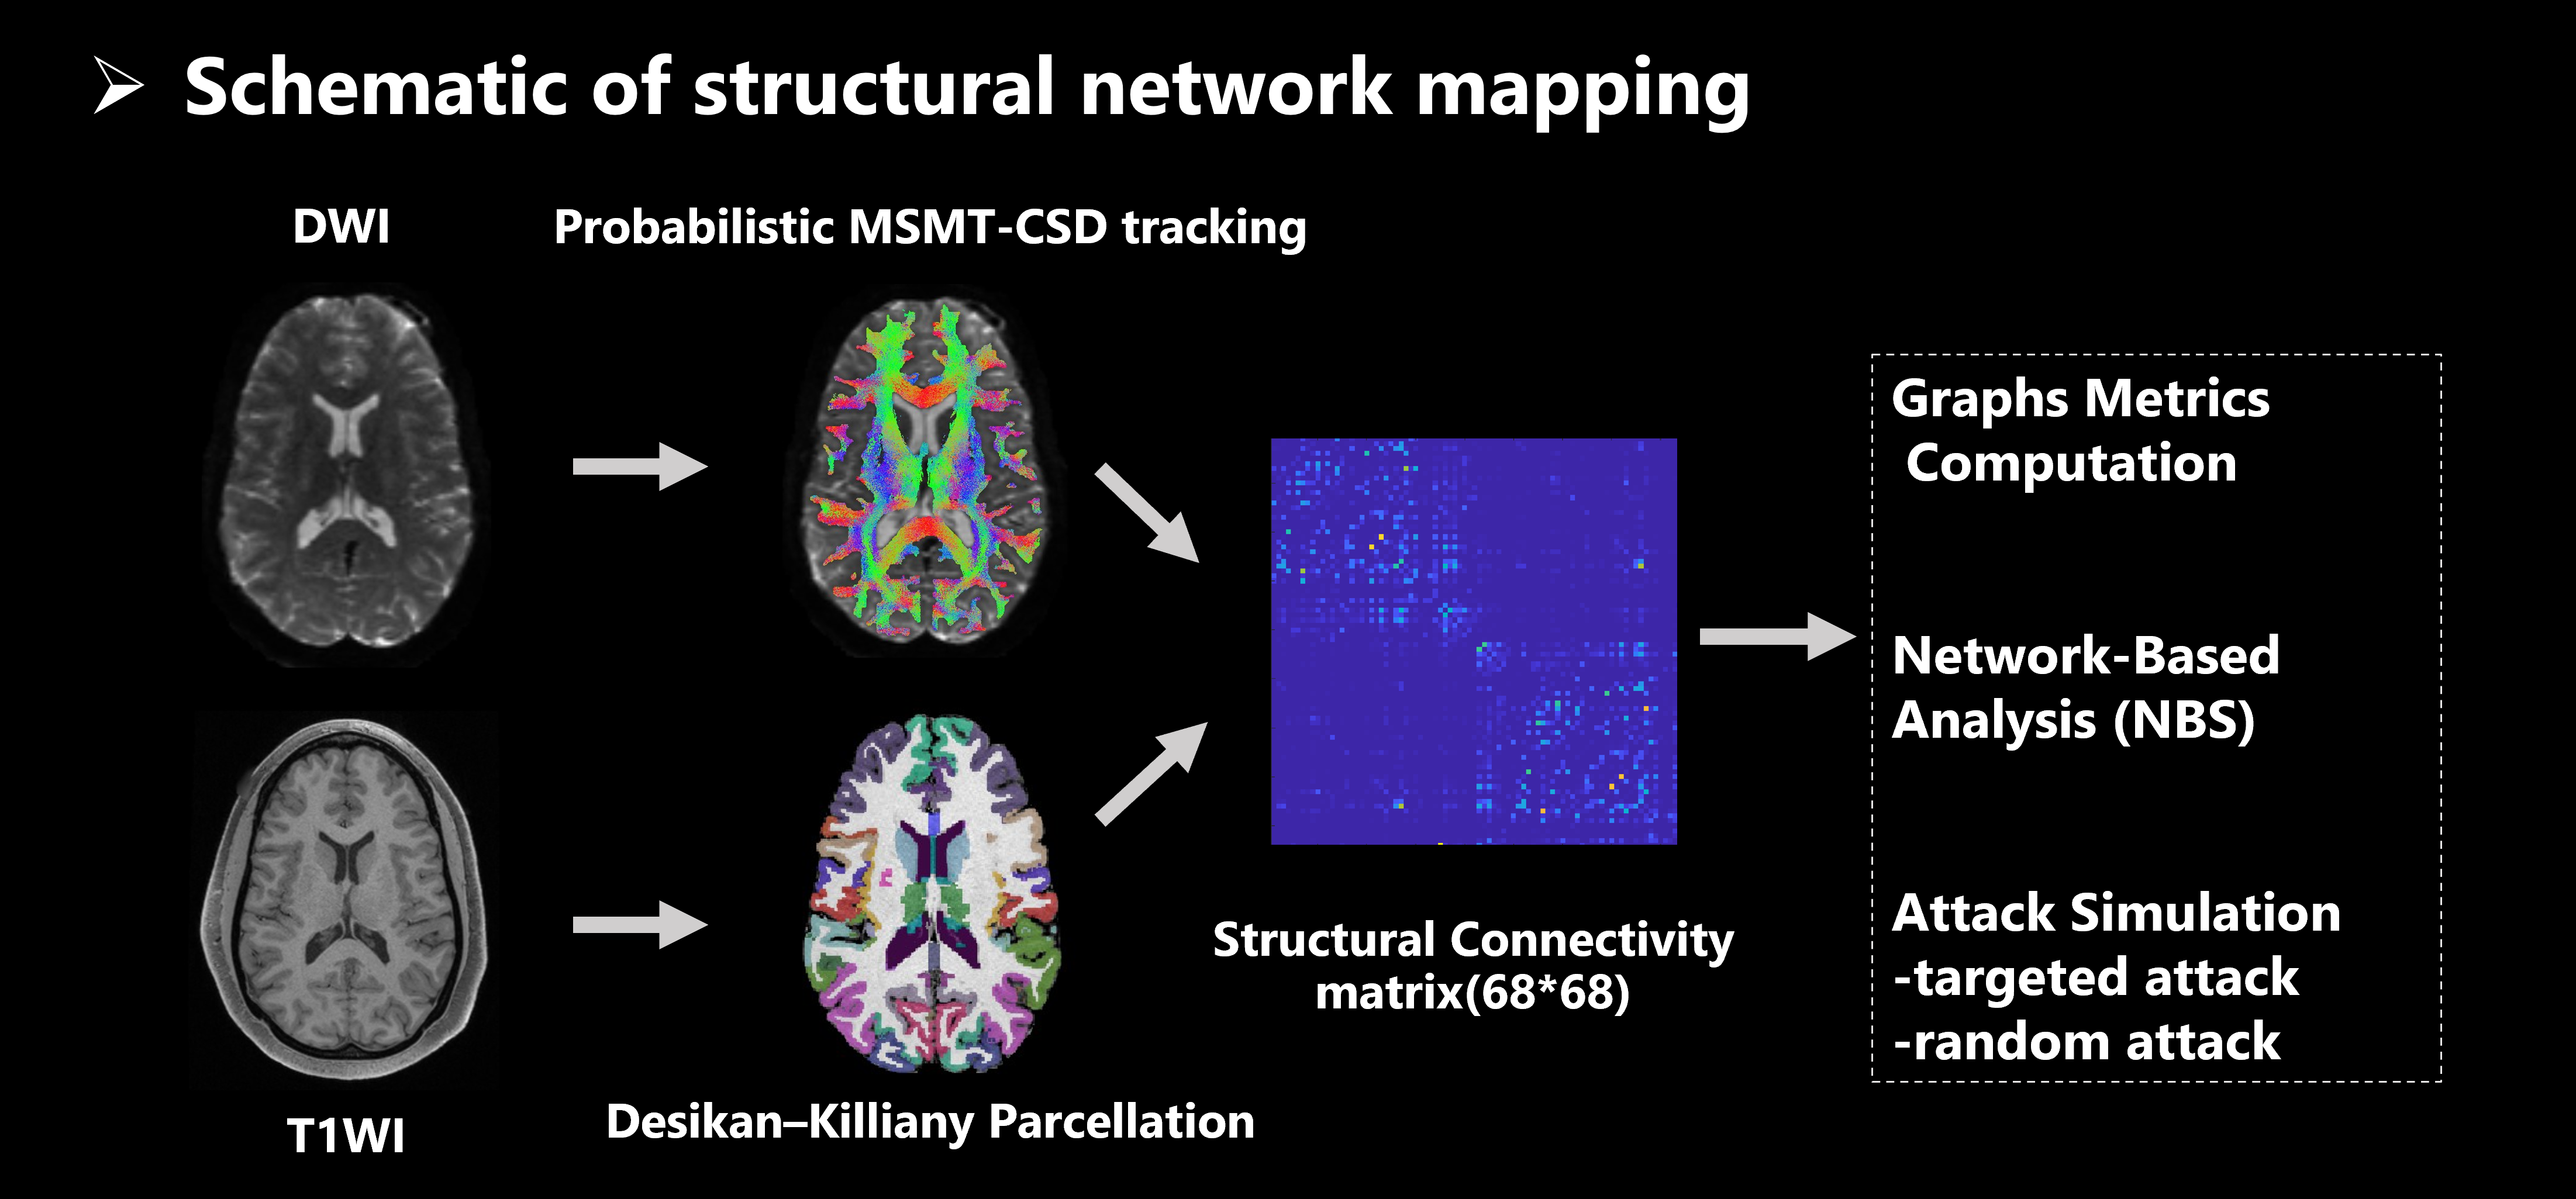
Structural brain networks were created using a method outlined in Figure 2, involving whole-brain tractography via MRtrix3, refined by Spherical Deconvolution Informed Filtering [7]. The cerebral cortex's 68 nodes were mapped using the Desikan–Killiany Atlas[8] in FreeSurfer 6.0.0, aligned to DWI space with FMRIB Software. Connections, or edges, were based on streamline counts between node pairs, forming a weighted network. Network-based statistics identified significant connectivity variations in brain networks between high and low-intensity groups, using four t-threshold levels (0.05, 0.01, 0.005, and 0.001)for structural network assessment.
Graph theory
Global network properties such as global efficiency (Eglob), largest component size (LCC), betweenness centrality (BC), and characteristic path length (Lp) were computed based on the graph theory [10].
Attack simulations
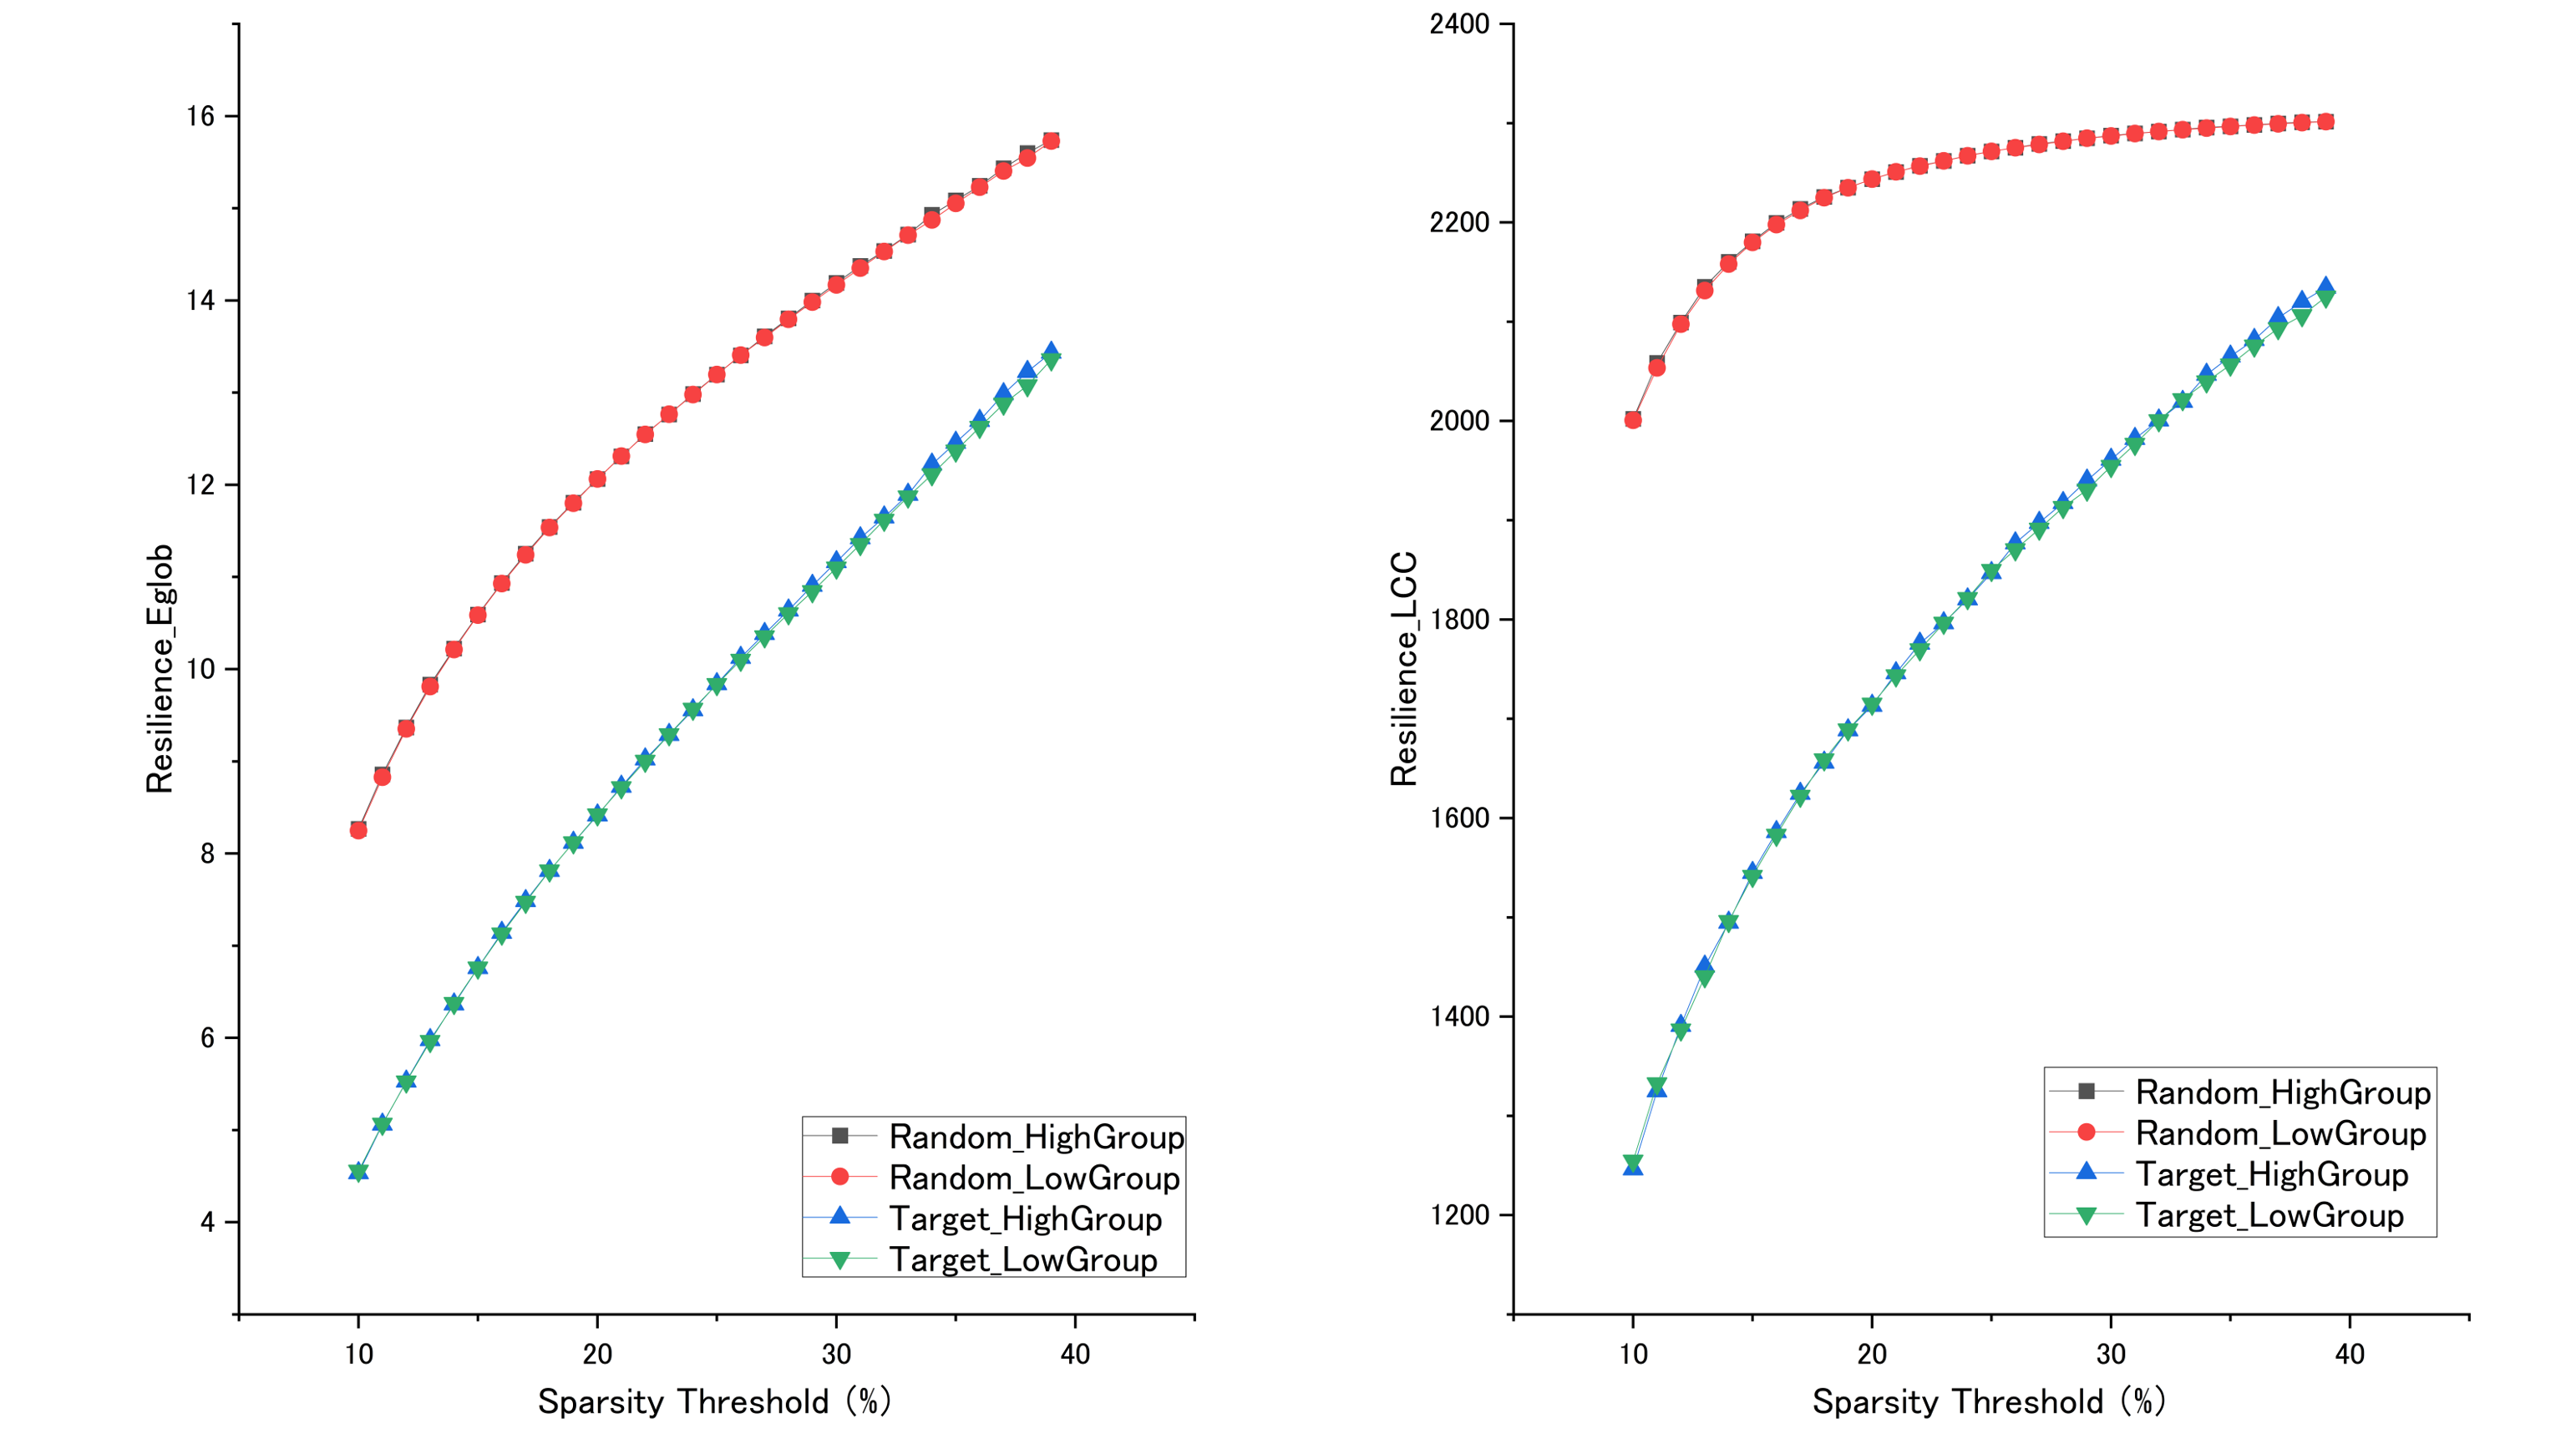
Two types of attack simulations, target and random attack, gauged network resilience at thresholds [11]. Resilience, the area under the curve (AUC) in a 2D space, reflects metric changes as nodes are removed. The weighted network was binarized at sparsity thresholds from 10% to 40% by 1% steps[11]. “Eglob” and “LCC” were used as the brain network metrics to compute resilience.
Statistical analysis
The study employed an independent samples t-test to assess differences between the HI and LI groups to ascertain if distinct structural variances existed in the connections of particular nodes with p < 0.05 indicating significance.
Results
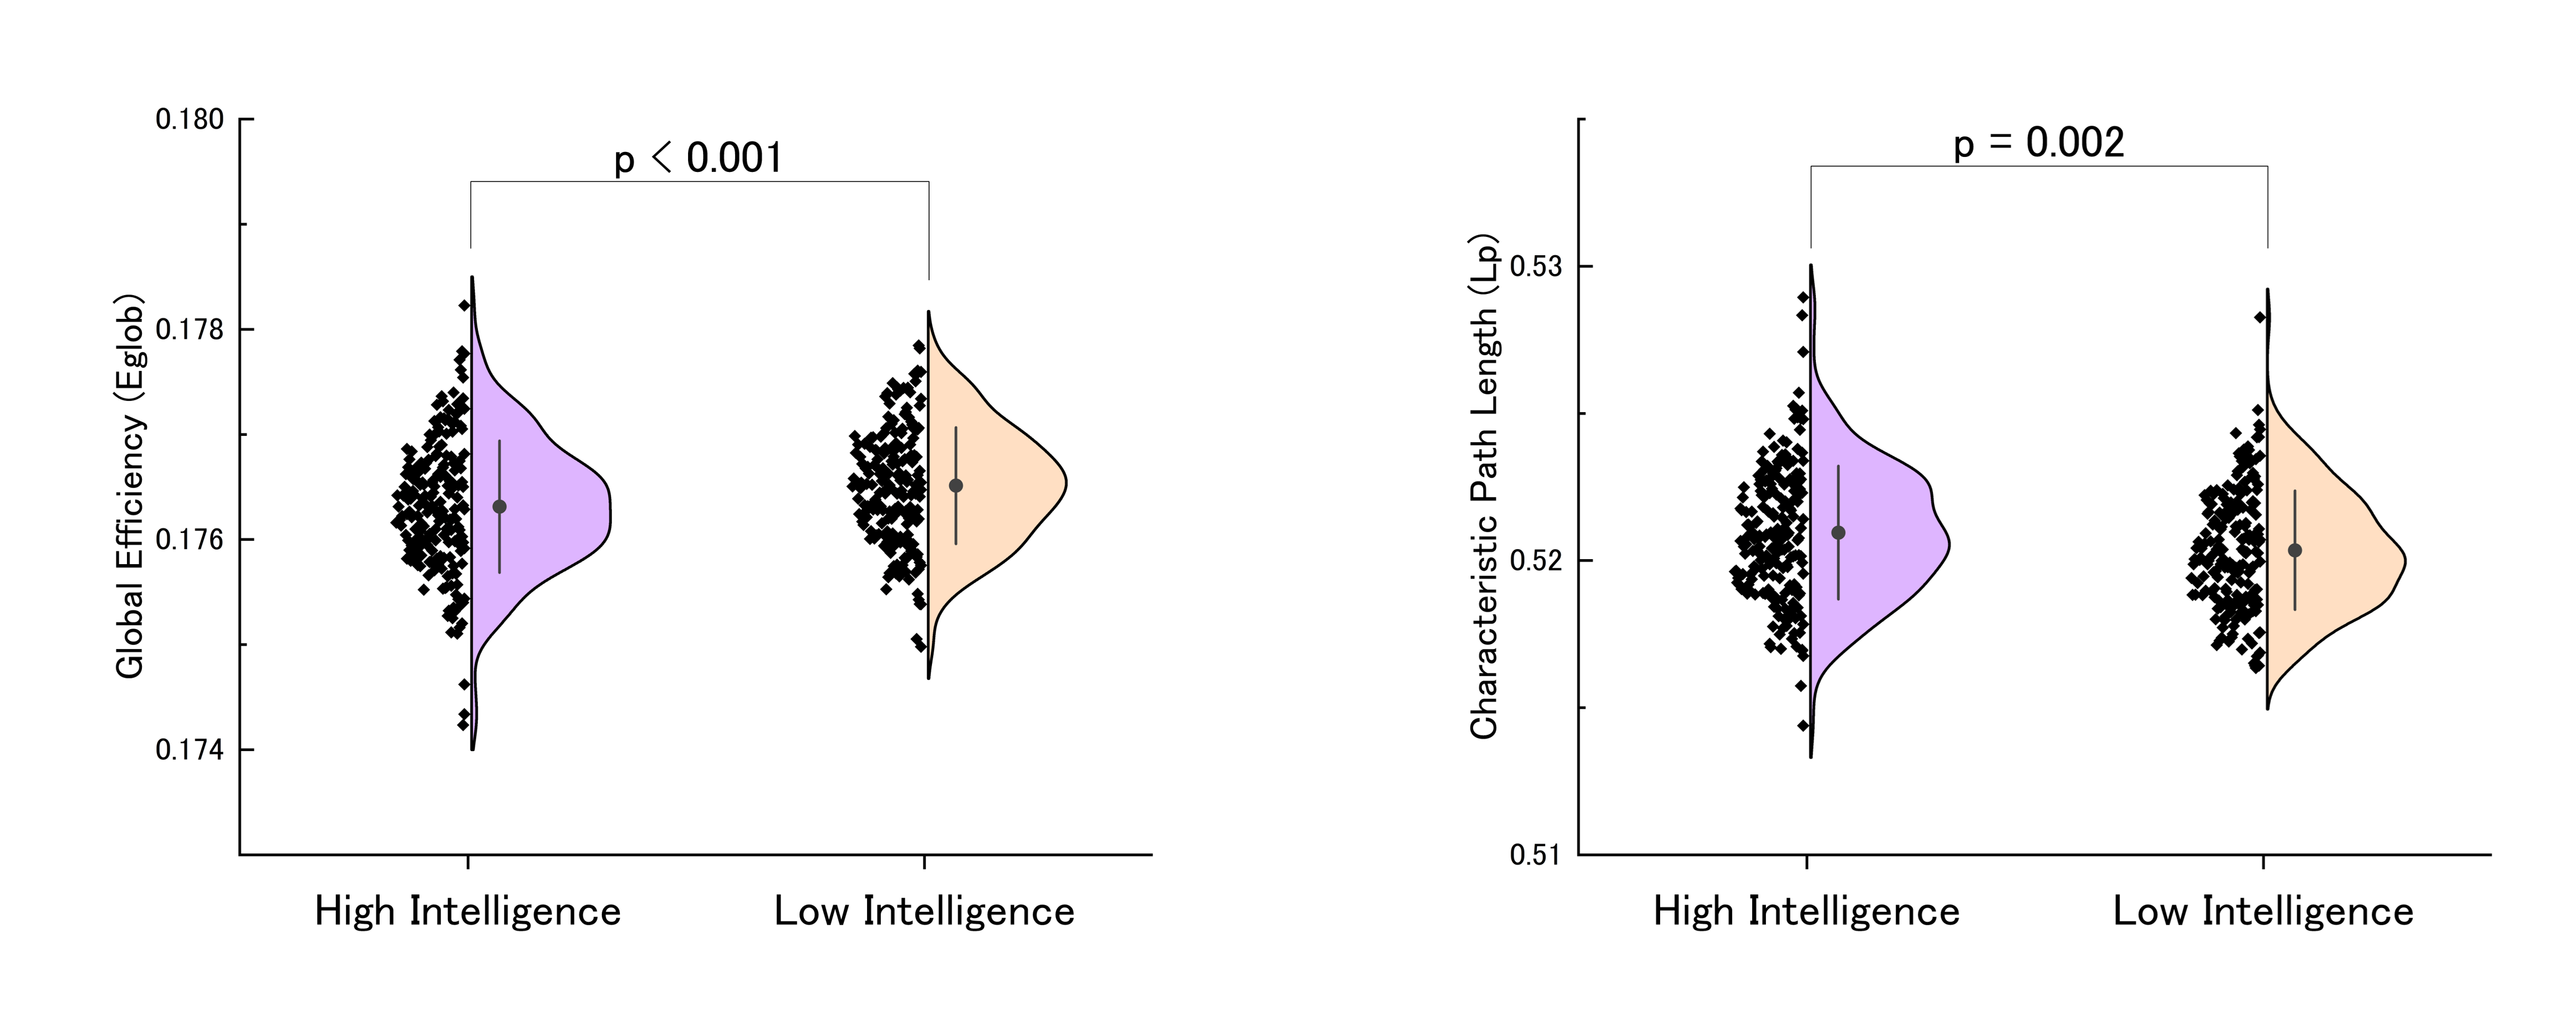
Comparison of graph metrics between HI and LIWhen comparing the AUC of global metrics within the threshold range, the Eglob of HI was significantly higher than that of LI, whereas the Lp of the HI group was significantly lower than that of the LI group, as depicted in Figure 3. Regarding node metrics, our results indicate that the BC in the r.fusiform and r.inferiortemporal brain regions of HI was significantly lower than that of LI.
Network-based statistics
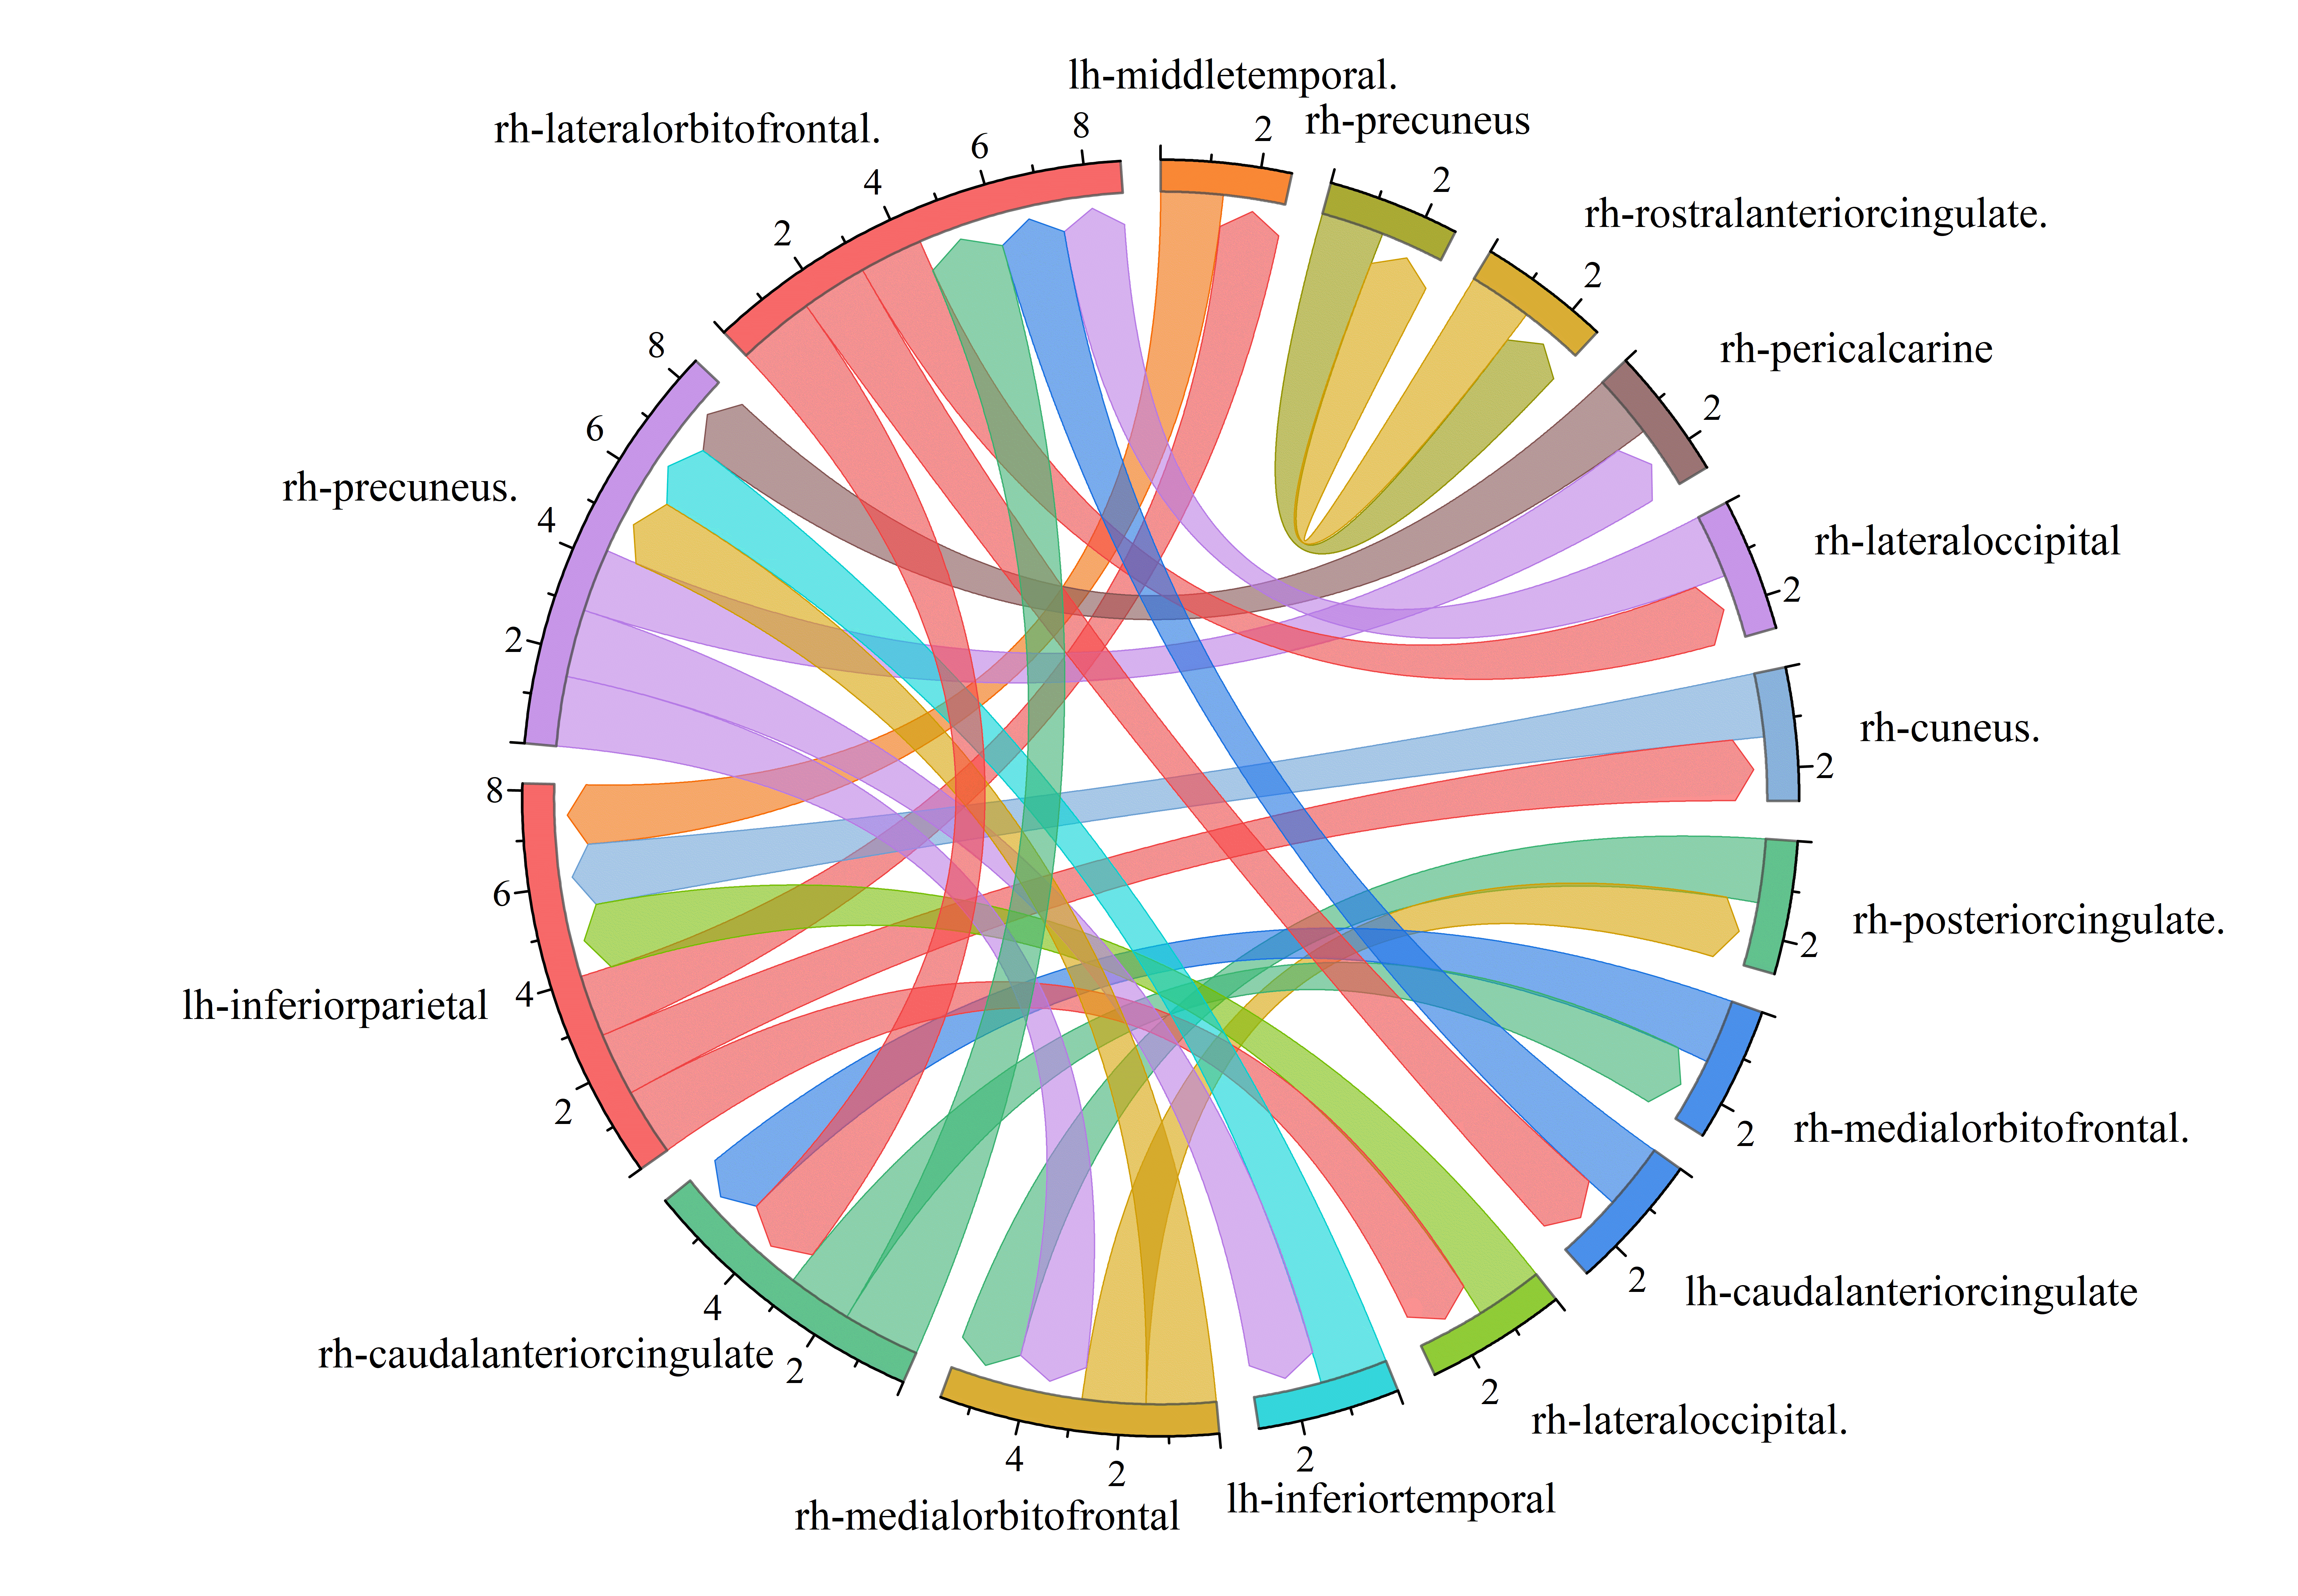
Through NBS, compared to LI, HI had a subnetwork with reduced strength composed of 13 nodes and 12 edges, as shown in Figure 4. No subnetworks with enhanced connectivity strength were found.
Brain Resilience
In the original matrix, HI's resilience is generally lower than LI's, regardless of thresholds.
Figure 5's upper half displays resilience against targeted attacks at various thresholds. With Eglob, HI's resilience outdoes LI's at 29%, 30%, 31%, 34%, 35%, 37%, and 38% thresholds during targeted attacks.
During random attacks at a 34% threshold, HI's resilience always tops LI's. Using LCC, at a 38% threshold under targeted attacks, HI's resilience surpasses LI's. However, for the global LCC, HI and LI show no notable resilience difference.
Discussion
Our research confirms that intelligence correlates with Eglob of brain connectivity and opposes the characteristic of Lp, which is in line with earlier findings of efficient information processing in smarter brains. Notably, those regions with higher intelligence showed reduced BC in the right fusiform and inferior temporal gyrus, indicating alternative principal processing areas. This may imply that information bypasses these nodes in them. Contextually, this aligns with past studies on the functional specialization of the fusiform gyrus. Our data also unveiled an intensified subnetwork in the LI group, possibly due to redundant connections. This strengthens the speculated link between intelligence and comprehensive brain imaging.Conclusion
Our results indicate the existence of a positive correlation between intelligence levels and Eglob of structural connectivity networks as well as a negative correlation with the Lp.Acknowledgements
This work was supported by the Brain/MINDS Beyond program of the Japan Agency for Medical Research and Development (AMED) under Grant Number JP19dm0307101 and the Japan Agency for Medical Research and Development (AMED) under Grant Number JP21wm0425006.
This work was also supported by the Otsuka Toshimi Scholarship Foundation (to S. Guo.). S.Guo was a scholar of the Otsuka Toshimi Scholarship Foundation.
References
1. Smith SM, Vidaurre D, Beckmann CF, Glasser MF, Jenkinson M, Miller KL, et al. Functional connectomics from resting-state fMRI. Trends in cognitive sciences. 2013;17(12):666-82.
2. Grayson DS, Fair DA. Development of large-scale functional networks from birth to adulthood: A guide to the neuroimaging literature. Neuroimage. 2017;160:15-31.
3. Van Essen DC, Ugurbil K, Auerbach E, Barch D, Behrens TE, Bucholz R, et al. The Human Connectome Project: a data acquisition perspective. Neuroimage. 2012;62(4):2222-31.
4. van der Linden D, Dunkel CS, Madison G. Sex differences in brain size and general intelligence (g). Intelligence. 2017;63:78-88.
5. Glasser MF, Smith SM, Marcus DS, Andersson JL, Auerbach EJ, Behrens TE, et al. The human connectome project's neuroimaging approach. Nature neuroscience. 2016;19(9):1175-87.
6. Kamagata K, Zalesky A, Hatano T, Di Biase MA, El Samad O, Saiki S, et al. Connectome analysis with diffusion MRI in idiopathic Parkinson's disease: Evaluation using multi-shell, multi-tissue, constrained spherical deconvolution. NeuroImage: Clinical. 2018;17:518-29.
7. Desikan RS, Ségonne F, Fischl B, Quinn BT, Dickerson BC, Blacker D, et al. An automated labeling system for subdividing the human cerebral cortex on MRI scans into gyral based regions of interest. Neuroimage. 2006;31(3):968-80.
8. Zalesky A, Fornito A, Bullmore ET. Network-based statistic: identifying differences in brain networks. Neuroimage. 2010;53(4):1197-207.
9. Rubinov M, Sporns O. Complex network measures of brain connectivity: uses and interpretations. Neuroimage. 2010;52(3):1059-69.
10. Albert R, Jeong H, Barabási A-L. Error and attack tolerance of complex networks. nature. 2000;406(6794):378-82.
Figures