2046
Intracranial EEG information flow is associated with metabolic and structural connectivity in temporal lobe epilepsy1School of Biomedical Engineering, Shanghai Jiao Tong University, Shanghai, China, 2Department of Neurosurgery, Huashan Hospital, Fudan University, Shanghai, China
Synopsis
Keywords: Structural Connectivity, Brain Connectivity, Functional connectivity
Motivation: EEG measured directional information flow, cerebral metabolism and structural connectivity are altered in temporal lobe epilepsy, although their interplay have not been elucidated.
Goal(s): To investigate whether and how structural and metabolic connectivity may separately or jointly affect the directional information flow.
Approach: This study proposed a step-wise analysis to study the correlation between directional information flow measured by SEEG and glucose metabolism measured by FDG PET, and to explore their associations with different structural connectivity.
Results: The inward information flow was negatively correlated with FDG uptake. White matter structural connectivity modulated the relationship between SEEG information flow and metabolism.
Impact: Unraveling the underlying association of white matter connectivity and FDG metabolism with directional information flow strength could offer a comprehensive view of neuronal signal propagation and potentially improve seizure onset localization of focal epilepsy.
Introduction
The directed transfer function (DTF) of SEEG functional connectivity in regions throughout the epilepsy network has proved to be capable of detecting the epileptogenic zones and predicting surgical outcomes1,2. Previous studies have attempted to investigate how structural connection may affect effective functional connectivity3,4. Further, alterations in metabolic connectivity have been widely reported in epileptic patients5. In this study, we investigate whether and how structural connectivity and metabolic connectivity may separately or jointly affect the directional information flow.Method
Data acquisition: In this IRB-approved study, 15 drug-refractory epilepsy patients with mesial temporal sclerosis were recruited. CT and MRI anatomical images were acquired on routine clinical systems. The SEEG system consisting of 8-16 contacts was used to continuously record patients’ neuronal activities, with a sampling rate of 2kHz. Two to three segments of SEEG recordings of typical ictal events of each patient were extracted for analysis. FDG PET scans were obtained approximately 30-50 minutes post a bolus injection of [18F] FDG, with a mean dose of 6-8mCi. The reconstruction matrix was 1.6×1.6×1.5 mm3, 145 slices, ensuring a comprehensive and detailed representation of brain anatomy and function.SEEG functional connectivity: Anatomical co-localization of SEEG electrodes was performed by the iEEGview toolbox with preoperative MRI and post-implanted CT images. The brain cortex is parcellated into different regions of interest according to Destrieux atlas6,7. All SEEG data were band-pass filtered at 1–512 Hz. The event of seizure and the seizure onset zone (SOZ) from SEEG recording were selected by experienced physicians. To study the propagation of the SEEG signal, the pre-ictal stage (1 minute before the seizure onset, and lasts 30 seconds) was extracted for analysis.
The within-frequency directional information flow—directed transfer function (DTF)8,9 was defined as:
$$DTF(i,j,f)=\frac{|h_{ij}\left(f\right)|}{\sqrt{{\bf h}_j^H\left(f\right){\bf h}_j\left(f\right)}}$$
where $$${\bf h}_j$$$ and $$$h_{ij}$$$ were the Fourier transform of the coefficients of the time series modeled by multivariate autoregressive (MVAR) models. The DTF was then averaged across the frequency bands: delta (1–4 Hz), theta (4–8 Hz), alpha (8–13 Hz), beta (13–30 Hz), gamma (30–80 Hz), high frequency of ripple (80-250 Hz) and fast ripple (250-500 Hz).
DTI structural connectivity: The HCP-1065 DTI template was applied for white matter connectivity analysis10. The tractography was performed automatically with DSI-studio (http://dsi-studio.labsolver.org). The anatomical scans were parcellated into 198 ROIs using the Destrieux atlas7. The count values of streamlines between two paired ROIs were extracted to generate the structural network for the template brain. For individual analysis, structural nodes in the regions sampled by SEEG electrodes and corresponding connectivity were extracted from the template brain.
PET metabolic network: PET image preprocessing was carried out using the standard statistical parametric mapping (SPM) software (MATLAB 2022b). The SUVRs were obtained via global mean scaling of PET images. The PET images were spatially normalized onto the MNI atlas. Individual t-maps of each patient were extracted by SPM analysis performed in comparison to healthy subjects, which were then inverse transformed back to individual space. The PET metabolic network was constructed by taking difference between brain regions $$$p_{ij}=p_j-p_i$$$.
Statistical tests: A step-wise analysis was performed: 1) explore the dominant direction of information flow between SOZ and non-SOZ; 2) evaluate the impact of structural connectivity on the SEEG information flow; 3) evaluate the associations of inward and outward DTF strength with level of FDG uptake; 4) investigate the associations between DTF strength and joint structural and metabolic connectivity. T-tests were performed for all pair-wise comparisons between SOZ and non-SOZ, and the structural features. Pearson’s correlation was performed for the inward/outward information strength and FDG uptakes, as well as for the DTF information strength and FDG metabolic networks with/without structural connectivity.
Results
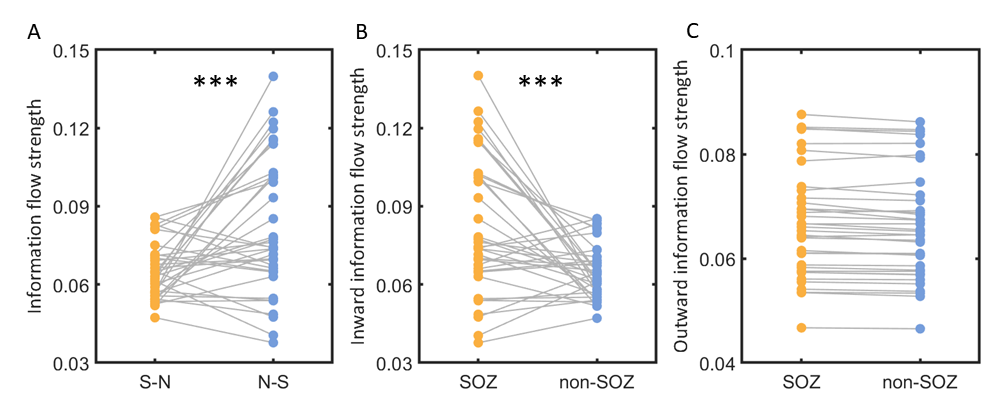
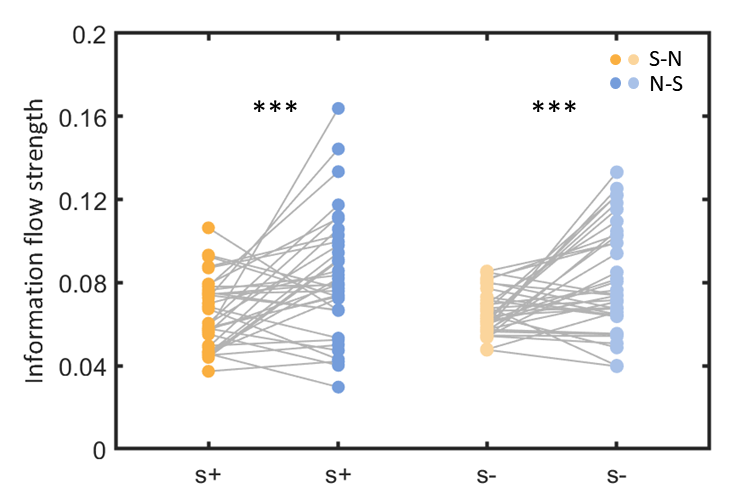
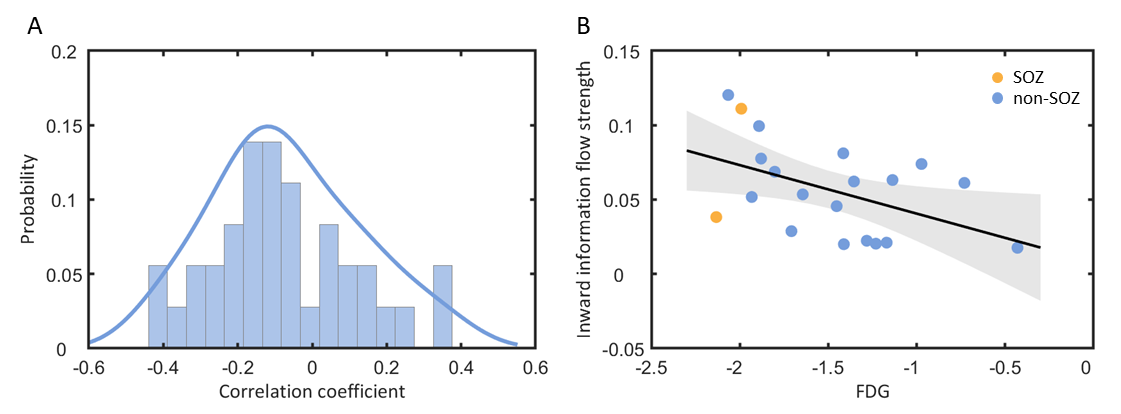
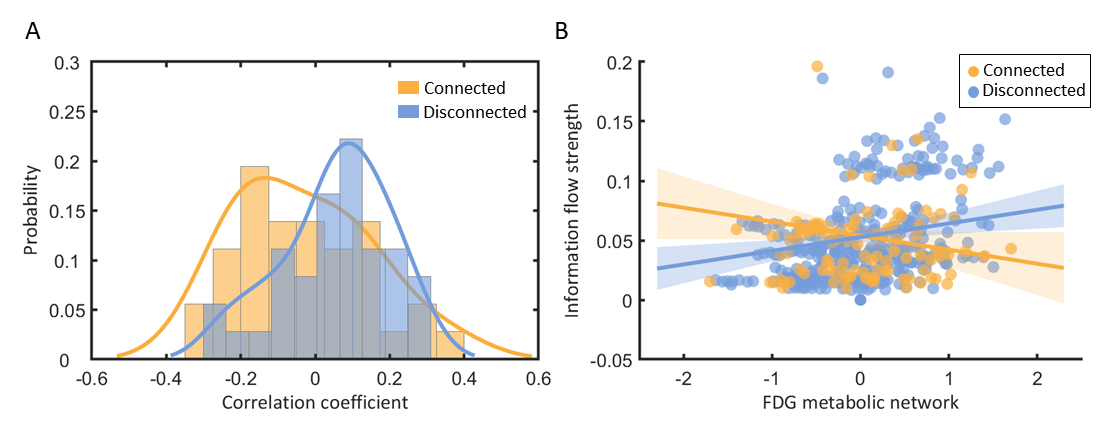
SEEG DTF analysis showed dominant information flow from non-SOZ to SOZ in all frequency bands (Fig.1) in pre-ictal state, while the difference is mainly attributed to inward information flow between non-SOZ and SOZ. For the electrodes with/without structural connectivity, the information flows have the same direction from non-SOZ to SOZ (Fig.2). Electrodes with and without structural connectivity had no difference in unidirectional information flow strength. The SEEG inward information flow was negatively correlated with FDG metabolism across patients (P=0.039) in all frequency bands as shown in Fig.3. For the electrodes without structural connectivity, the information flow positively correlated with FDG metabolism networks (P=0.011), which was significantly different with the electrodes with structural connectivity (P=0.019) in all frequency bands (Fig.4).Conclusion
Our study analyzed the relationship between directed neural information flow and FDG metabolism under different white matter connectivity conditions. These findings highlight the interdependence of functional and structural networks and the metabolism in temporal lobe epilepsy.Acknowledgements
N/AReferences
1. Jiang H, Kokkinos V, Ye S, et al. Interictal SEEG Resting-State Connectivity Localizes the Seizure Onset Zone and Predicts Seizure Outcome. Advanced Science. 2022;9(18):2200887.
2. Narasimhan S, Kundassery KB, Gupta K, et al. Seizure-onset regions demonstrate high inward directed connectivity during resting-state: An SEEG study in focal epilepsy. Epilepsia. 2020;61(11):2534-2544.
3. Chu CJ, Tanaka N, Diaz J, et al. EEG functional connectivity is partially predicted by underlying white matter connectivity. Neuroimage. 2015;108:23-33.
4. Cadotte AJ, Mareci TH, DeMarse TB, et al. Temporal lobe epilepsy: anatomical and effective connectivity. IEEE Trans Neural Syst Rehabil Eng. 2009;17(3):214-223.
5. Shim HK, Lee HJ, Kim SE, Lee BI, Park S, Park KM. Alterations in the metabolic networks of temporal lobe epilepsy patients: A graph theoretical analysis using FDG-PET. Neuroimage Clin. 2020;27:102349.
6. Li G, Jiang S, Chen C, et al. iEEGview: an open-source multifunction GUI-based Matlab toolbox for localization and visualization of human intracranial electrodes. J Neural Eng. 2019;17(1):016016.
7. Destrieux C, Fischl B, Dale A, Halgren E. Automatic parcellation of human cortical gyri and sulci using standard anatomical nomenclature. Neuroimage. 2010;53(1):1-15.
8. He B, Astolfi L, Valdés-Sosa PA, et al. Electrophysiological Brain Connectivity: Theory and Implementation. IEEE Transactions on Biomedical Engineering. 2019;66(7):2115-2137.
9. Kaminski MJ, Blinowska KJ. A new method of the description of the information flow in the brain structures. Biological Cybernetics. 1991;65(3):203-210.
10. Yeh FC, Panesar S, Fernandes D, et al. Population-averaged atlas of the macroscale human structural connectome and its network topology. Neuroimage. 2018;178:57-68.
Figures