2045
Retrieving fiber orientations from any brain histology section and comparison to diffusion MRI1Stanford University School of Medicine, Stanford, CA, United States, 2Forschungszentrum Jülich GmbH, Julich, Germany, 3Delft University of Technology, Delft, Netherlands
Synopsis
Keywords: Structural Connectivity, Brain Connectivity
Motivation: Neuronal axons (nerve fibers) facilitate complex connectivity patterns, but retrieving fiber architecture with micrometer resolution remains elusive. Meanwhile, thousands of brain histology sections are produced and archived daily.
Goal(s): Here, we show that fiber architecture can be derived with micrometer resolution from new and archived histology sections.
Approach: Using Computational Scattered Light Imaging (ComSLI), we generate detailed microscopic maps of nerve fiber orientations in healthy and diseased, animal and human brain sections prepared with various protocols and stains.
Results: We compare whole-brain results to diffusion MRI. This opens new avenues to studying microscopic brain fiber architecture in a time- and cost-effective manner.
Impact: Using scattered light, we generate micrometer maps of nerve fiber orientations in new and archived histology sections of healthy and diseased, animal and human brains prepared with various protocols and stains. We compare whole-brain fiber orientations to diffusion MRI.
Introduction
Detailed maps of neuronal orientations are necessary to determine accurate neuronal trajectories. Diffusion MRI can map these trajectories, but its signal is influenced by multiple brain structures and requires validation. At the same time, thousands of histology sections, usually formalin-fixed paraffin-embedded (FFPE), are produced every day, with billions already archived. Computational Scattered Light Imaging (ComSLI) has previously been used in hydrated cryo-sections only1–3. Here, we use an enhanced setup to reveal microscopic orientations of neuronal axons in standard histology sections from healthy and diseased, animal and human brains prepared with various protocols and stains. We compare our whole-brain results to diffusion MRI fiber orientations.Methods
Samples: The whole human brain section is section no. 3452 from the Julich BigBrain project4–6: briefly, a 30yo male brain underwent FFPE processing, was cut in 20μm coronal sections and silver-stained7. The standard-sized histology sections were produced following standard protocols, resulting in 5 or 10μm FFPE sections stained using various staining protocols (see text and figures).Computational Scattered Light Imaging (ComSLI): Measurements were performed using a high sensitivity custom apparatus, Fig. 1A, using a Flexacam C3 12 MP microscope camera (Leica) and a Navitar 12X Zoom Lens with a 0.67X Standard Adapter and a 0.5X Lens Attachment, with 9μm pixel size. The lightsource was a ADJ Pinspot LED II at 45o from the section plane, with 4.5cm diameter and 3o angle of divergence. A motorized stage enabled whole-brain section scanning in 8x5 tiles. Images were acquired at 10o rotation steps (36 images/sample). SLIX software8 quantified and visualized axon orientations by detecting the azimuthal peaks and identifying their position, Fig. 1.
dMRI: The diffusion MRI dataset is from a 30yo male who underwent 18 hours of diffusion MRI scanning in the MGH-USC 3 T Connectom scanner9 using gSlider-SMS10, with TE=75ms, TR=17.5s, at 1260 q-space points (420@b=1000s/mm2, 840@b=2500s/mm2) and 144@b=0s/mm2, with 0.76mm isotropic voxels. After manually identifying the MR plane most closely matching the BigBrain histology section, the entire dataset was rotated using freeview, the b-vectors were rotated, and fiber responses and orientation distributions were computed using the dwi2response and dwi2fod functions in mrtrix3, using multi-tissue, multi-shell algorithms, and visualized in mrview.
Results
ComSLI reliably retrieved fiber orientations with micrometer resolution from all histology sections. Figure 2 shows the whole coronal BigBrain section, where single or crossing fiber orientations for each image pixel are color-encoded by the color wheel. The corona radiata appears darker because multiple colors are encoded per pixel due to fiber crossings, visualized in Fig. 5. The zoom-ins in Fig. 2C-D show the detailed fiber orientations in the corpus callosum and fornix (C) and in a U-fiber region (D), down-scaled for visualization.The flexibility of ComSLI to scan histology sections prepared under various protocols is demonstrated in Fig. 3. A 100-year-old myelin-stained human section yields robust signal, Fig. 3A, and consecutive hippocampal sections stained for different targets (iron, microglia, tau, and amyloid) show identical orientations, Fig. 3B, unperturbed by stain colors and intensities. This is further shown in Fig. 4, where the scope of applications is expanded to pathology sections including a multiple sclerosis peri-ventricular lesion, Fig. 4A-D, and to animal brain tissue including a pig half-brain section with multiple white matter tracts visualized at a microscopic scale, Fig. 4E-H.
Finally, a comparison of ComSLI and diffusion MRI fiber orientations shows an overall correspondence in Fig. 5. Examining in greater detail, in a similar region of the corpus callosum and part of the corona radiata (Fig. 5C,E), ComSLI strong crossings are more conspicuous compared to diffusion MRI.
Discussion and Conclusion
We showed that ComSLI can robustly provide micrometer resolution 2-D fiber orientation maps in brain histology sections prepared with various protocols. We applied that on whole-brain human sections, hippocampus sections with different stains, a 100-year-old human coronal section, pathology and animal sections. We also compared fiber orientations to in vivo diffusion MRI, showing potentially higher sensitivity, presumably due to ComSLI’s superior 2-D spatial resolution. To our knowledge, only structure tensor analysis of histology images11 can provide orientations from FFPE histology sections, but only with specific stains, and not e.g., the most routinely performed hematoxylin and eosin stain. ComSLI can also provide out-of-plane orientation information1,12, with quantification possible with future advancements. Unlike other excellent microscopy methods that require expensive setups and specially-prepared sections, such as 3D-PLI13–15, PS-OCT16,17, X-ray scattering18,19, the fast, non-destructive, and cost-effective ComSLI could become a routine tool to provide micrometer fiber orientation mapping of histology sections in any lab. This could also provide the much needed validation of post-mortem MRI20.Acknowledgements
The present work was supported by the National Institutes of Health (NIH), award numbers R01NS088040, P41EB017183, R01AG061120-01, R01MH092311, 5P40OD010965, Deutsche Forschungsgemeinschaft (DFG) 498596755, and by the European Union’s Horizon 2020 Research and Innovation Programme under Grant Agreement No. 945539 (“Human Brain Project” SGA3).References
1. Menzel, M., Reuter, J. A., Gräßel, D., Huwer, M., Schlömer, P., Amunts, K. & Axer, M. Scattered Light Imaging: Resolving the substructure of nerve fiber crossings in whole brain sections with micrometer resolution. Neuroimage 233, 117952 (2021). https://doi.org/https://doi.org/10.1016/j.neuroimage.2021.117952
2. Menzel, M., Axer, M., De Raedt, H., Costantini, I., Silvestri, L., Pavone, F. S., Amunts, K. & Michielsen, K. Toward a High-Resolution Reconstruction of 3D Nerve Fiber Architectures and Crossings in the Brain Using Light Scattering Measurements and Finite-Difference Time-Domain Simulations. Phys. Rev. X 10, 21002 (2020). https://doi.org/10.1103/PhysRevX.10.021002
3. Menzel, M., Gräßel, D., Rajkovic, I., Zeineh, M. & Georgiadis, M. Using light and X-ray scattering to untangle complex neuronal orientations and validate diffusion MRI. bioRxiv 2022.10.04.509781 (2022) doi:10.1101/2022.10.04.509781. https://doi.org/10.1101/2022.10.04.509781
4. The Julich Big Brain Atlas. https://julich-brain-atlas.de/atlas/bigbrain
5. Amunts, K., Mohlberg, H., Bludau, S. & Zilles, K. Julich-Brain: A 3D probabilistic atlas of the human brain’s cytoarchitecture. Science (80-. ). 369, 988–992 (2020). https://doi.org/10.1126/science.abb4588
6. Amunts, K., Lepage, C., Borgeat, L., Mohlberg, H., Dickscheid, T., Rousseau, M.-É., Bludau, S., Bazin, P.-L., Lewis, L. B., Oros-Peusquens, A.-M., et al. BigBrain: An Ultrahigh-Resolution 3D Human Brain Model. Science (80-. ). 340, 1472–1475 (2013). https://doi.org/10.1126/science.1235381
7. Merker, B. Silver staining of cell bodies by means of physical development. J. Neurosci. Methods 9, 235–241 (1983). https://doi.org/https://doi.org/10.1016/0165-0270(83)90086-9
8. Reuter, J. A. & Menzel, M. SLIX: A Python package for fully automated evaluation of Scattered Light Imaging measurements on brain tissue. J. Open Source Softw. 5, 2675 (2020)
9. Wang, F., Dong, Z., Tian, Q., Liao, C., Fan, Q., Hoge, W. S., Keil, B., Polimeni, J. R., Wald, L. L., Huang, S. Y., et al. In vivo human whole-brain Connectom diffusion MRI dataset at 760 µm isotropic resolution. Sci. data 8, 122 (2021). https://doi.org/10.1038/s41597-021-00904-z
10. Setsompop, K., Fan, Q., Stockmann, J., Bilgic, B., Huang, S., Cauley, S. F., Nummenmaa, A., Wang, F., Rathi, Y., Witzel, T., et al. High-resolution in vivo diffusion imaging of the human brain with generalized slice dithered enhanced resolution: Simultaneous multislice (gSlider-SMS). Magn. Reson. Med. 79, 141–151 (2018). https://doi.org/10.1002/mrm.26653
11. Roey, S. & A., M. A. The glial framework reveals white matter fiber architecture in human and primate brains. Science (80-. ). 374, 762–767 (2021). https://doi.org/10.1126/science.abj7960
12. Menzel, M., Gräßel, D., Rajkovic, I., Zeineh, M. M. & Georgiadis, M. Using light and X-ray scattering to untangle complex neuronal orientations and validate diffusion MRI. Elife 12, (2023). https://doi.org/https://doi.org/10.7554/eLife.84024
13. Zeineh, M. M., Palomero-Gallagher, N., Axer, M., Grassel, D., Goubran, M., Wree, A., Woods, R., Amunts, K. & Zilles, K. Direct Visualization and Mapping of the Spatial Course of Fiber Tracts at Microscopic Resolution in the Human Hippocampus. Cereb Cortex 27, 1779–1794 (2017). https://doi.org/10.1093/cercor/bhw010
14. Axer, M., Amunts, K., Grässel, D., Palm, C., Dammers, J., Axer, H., Pietrzyk, U. & Zilles, K. A novel approach to the human connectome: Ultra-high resolution mapping of fiber tracts in the brain. Neuroimage 54, 1091–1101 (2011). https://doi.org/http://dx.doi.org/10.1016/j.neuroimage.2010.08.075
15. Stacho, M., Herold, C., Rook, N., Wagner, H., Axer, M., Amunts, K. & Güntürkün, O. A cortex-like canonical circuit in the avian forebrain. Science (80-. ). 369, eabc5534 (2020). https://doi.org/10.1126/science.abc5534
16. Wang, H., Zhu, J., Reuter, M., Vinke, L. N., Yendiki, A., Boas, D. A., Fischl, B. & Akkin, T. Cross-validation of serial optical coherence scanning and diffusion tensor imaging: A study on neural fiber maps in human medulla oblongata. Neuroimage 100, 395–404 (2014). https://doi.org/https://doi.org/10.1016/j.neuroimage.2014.06.032
17. Jones, R., Grisot, G., Augustinack, J., Magnain, C., Boas, D. A., Fischl, B., Wang, H. & Yendiki, A. Insight into the fundamental trade-offs of diffusion MRI from polarization-sensitive optical coherence tomography in ex vivo human brain. Neuroimage 214, 116704 (2020). https://doi.org/https://doi.org/10.1016/j.neuroimage.2020.116704
18. Georgiadis, M., Schroeter, A., Gao, Z., Guizar-Sicairos, M., Novikov, D. S., Fieremans, E. & Rudin, M. Retrieving neuronal orientations using 3D scanning SAXS and comparison with diffusion MRI. Neuroimage 204, 116214 (2020). https://doi.org/10.1016/j.neuroimage.2019.116214
19. Georgiadis, M., Menzel, M., Reuter, J. A., Born, D. E., Kovacevich, S. R., Alvarez, D., Taghavi, H. M., Schroeter, A., Rudin, M., Gao, Z., et al. Imaging crossing fibers in mouse, pig, monkey, and human brain using small-angle X-ray scattering. Acta Biomater. 164, 317–331 (2023). https://doi.org/https://doi.org/10.1016/j.actbio.2023.04.029
20. Yendiki, A., Aggarwal, M., Axer, M., Howard, A. F. D., van Walsum, A.-M. van C. & Haber, S. N. Post mortem mapping of connectional anatomy for the validation of diffusion MRI. Neuroimage 256, 119146 (2022). https://doi.org/https://doi.org/10.1016/j.neuroimage.2022.119146
Figures
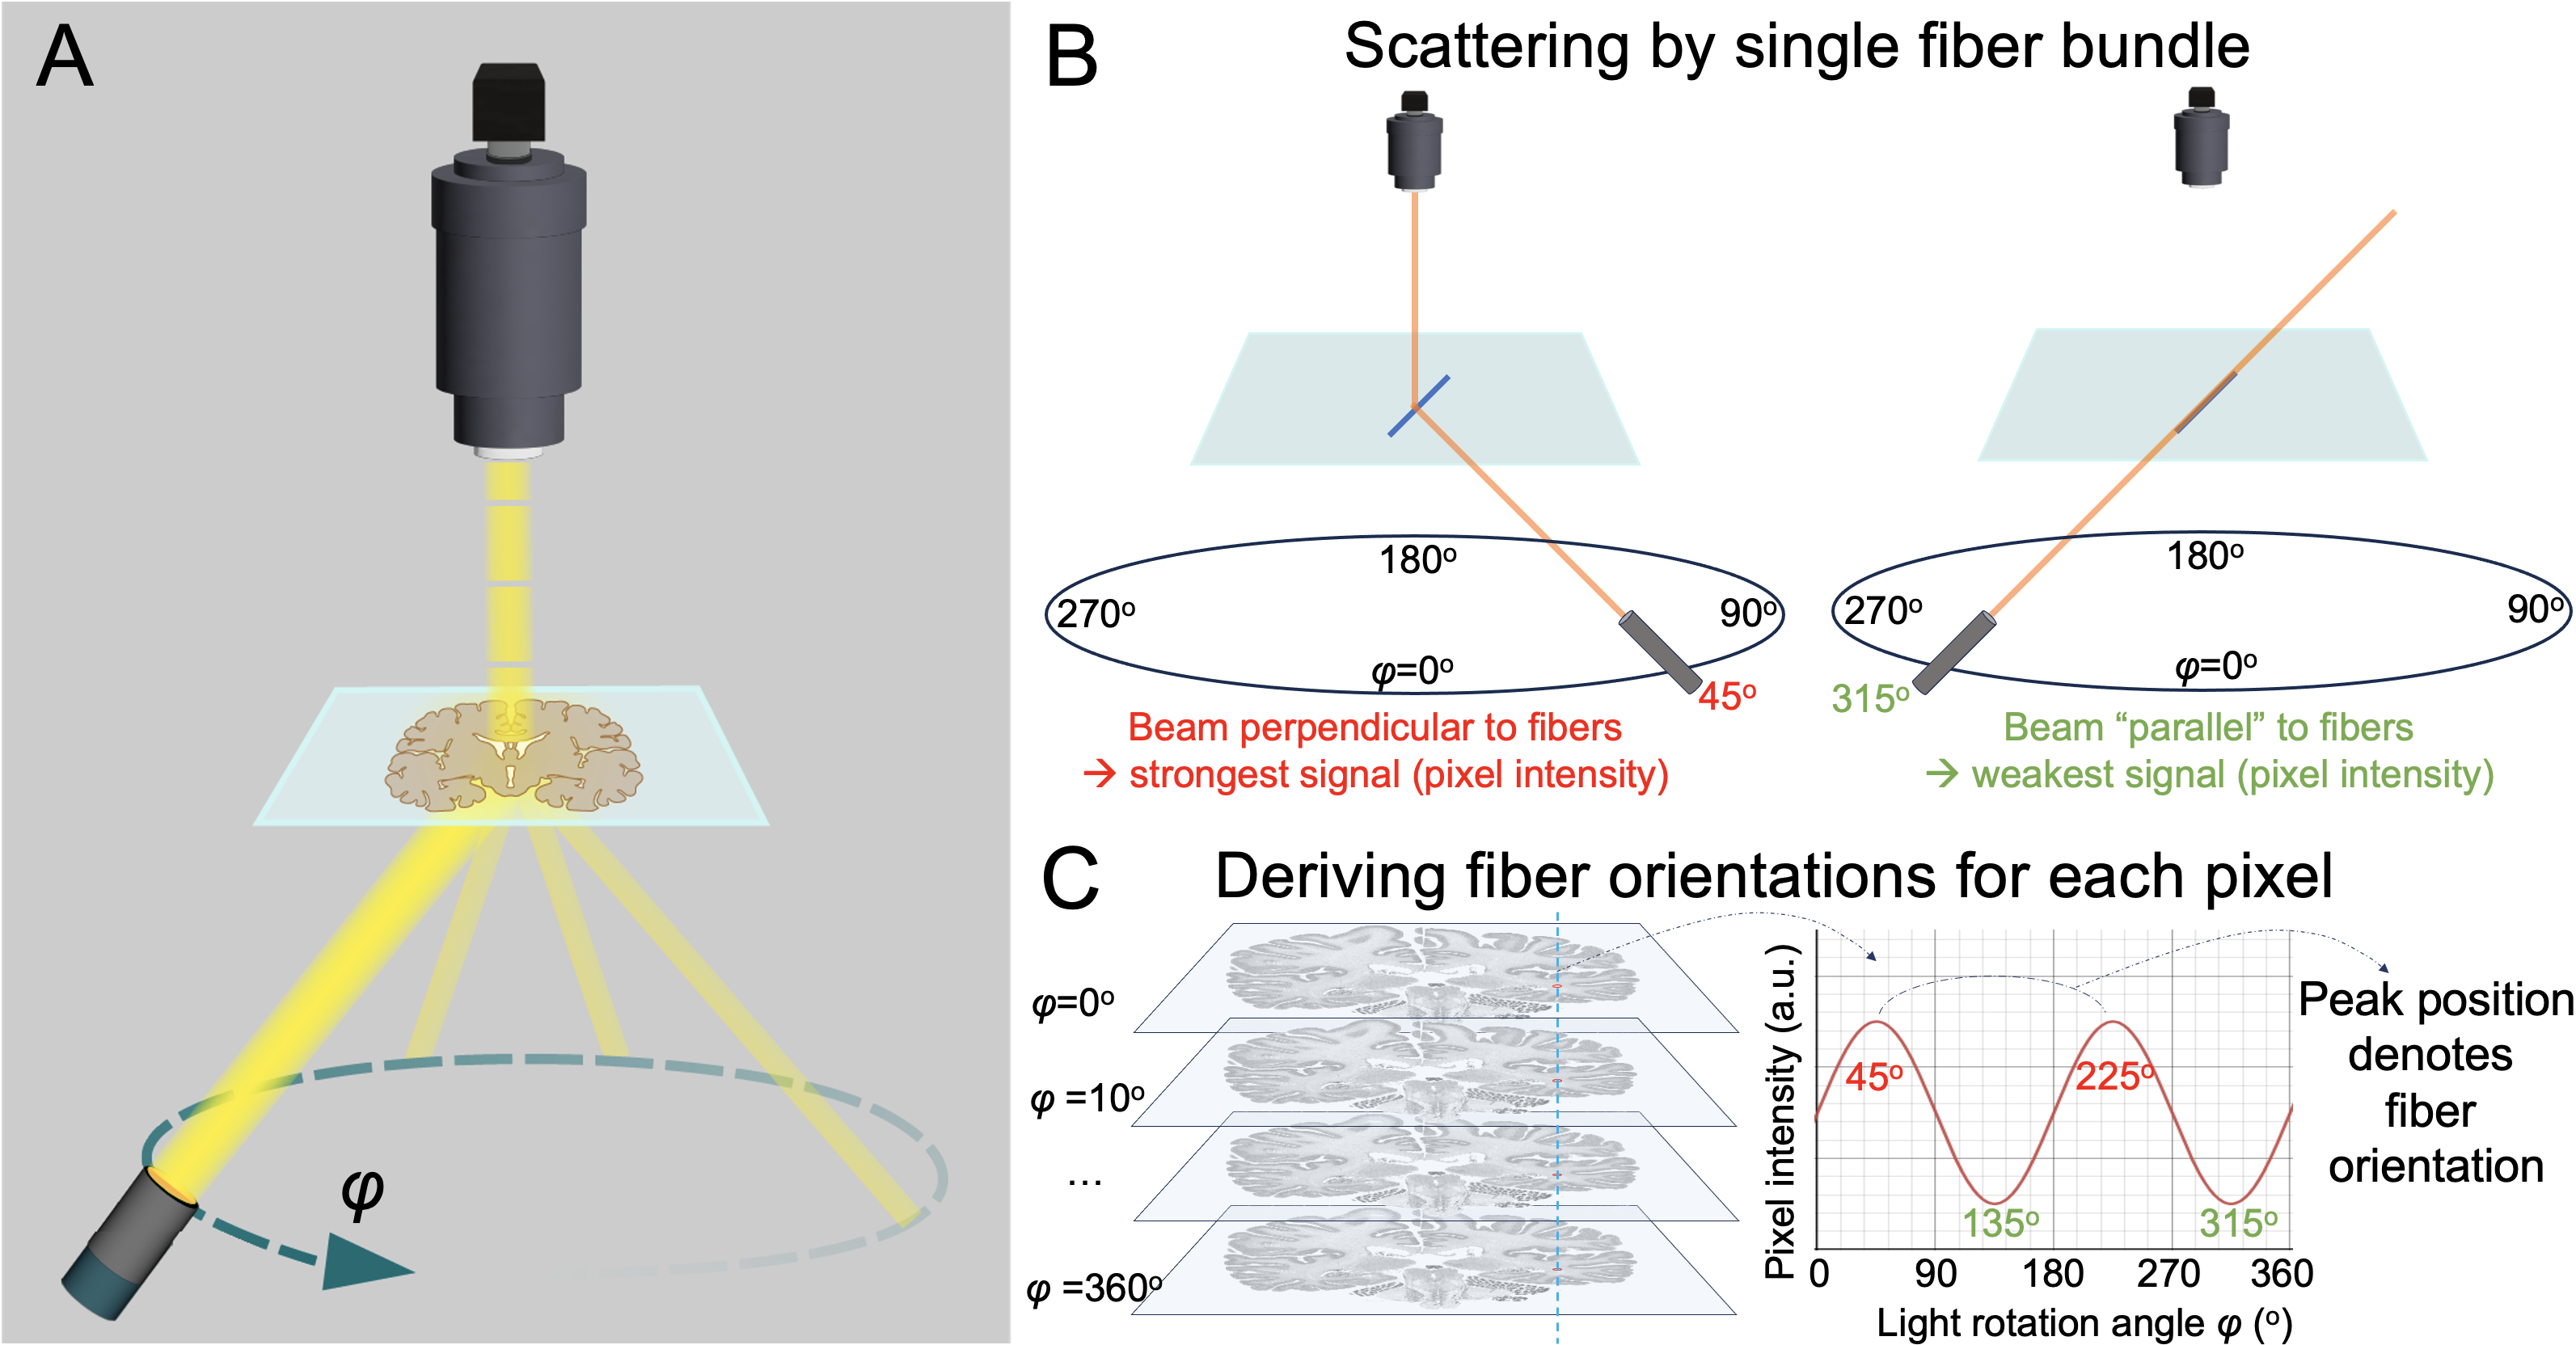
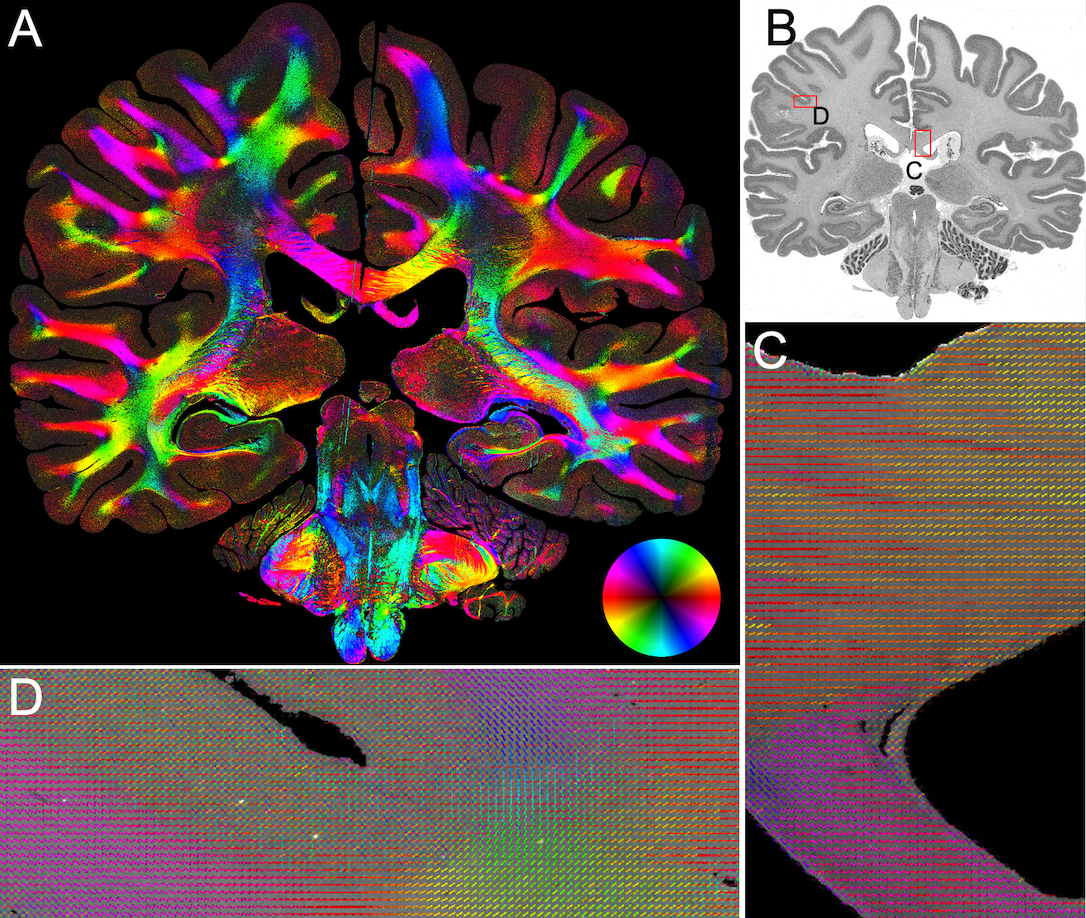
Figure 2. ComSLI on a Julich BigBrain human histology section (silver-stained). A) Fiber orientation map for the whole brain section, orientations are color-encoded according to the color wheel, obtained by tile-scanning the section in a 8x5 grid. B) Bright-field microscopy image of the brain section. Red boxes show areas depicted in (C) and (D), depicting detailed fiber orientations. The colored lines show the fiber orientations for an average of 5x5 pixels each, for visualization reasons, while orientation is actually derived for all pixels.
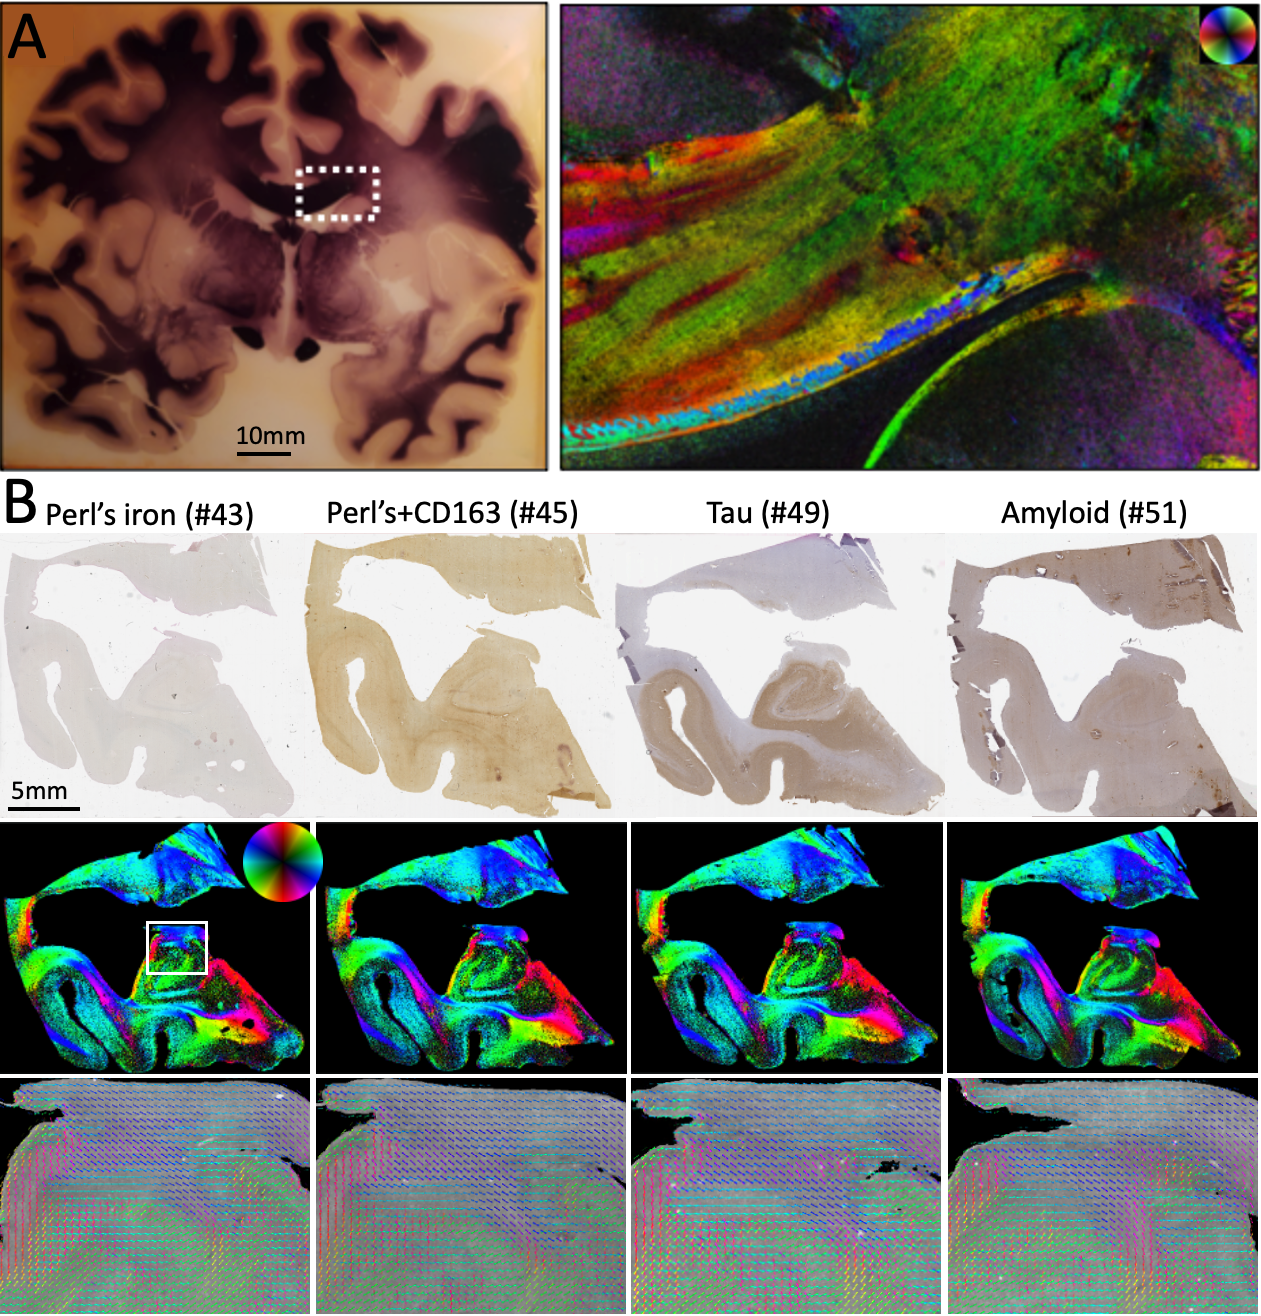
Figure 3. ComSLI applied to histology sections from various sample preparation protocols . A) ComSLI results on a 100-year-old coronal myelin-stained human brain section. Left: Photograph. Right: ComSLI fiber orientation map of rectangular marked region. B) Formalin-fixed paraffin-embedded sections of a human hippocampus stained with different agents. From top to bottom: Bright-field microscopy images, color-coded fiber orientation maps, and zoomed-in fiber orientation vectors (rectangular region marked by white box in first panel of second row).
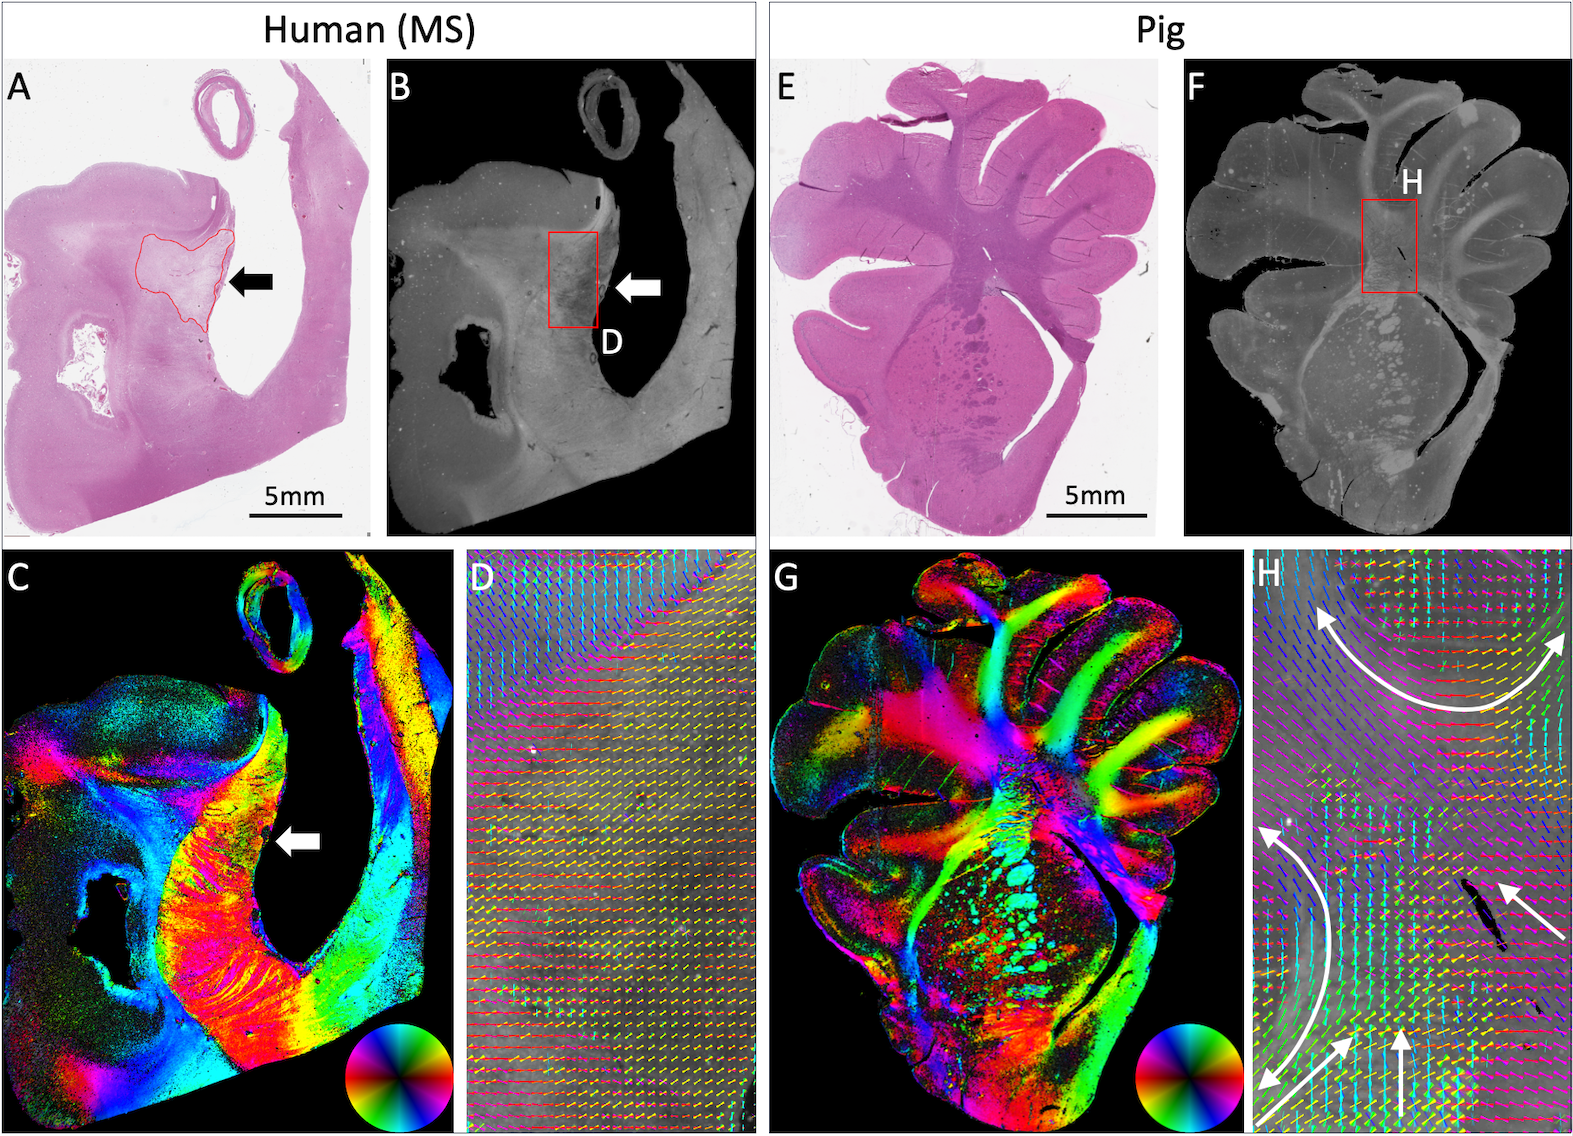
Figure 4. ComSLI on human pathology and pig brain sections. A) Multiple sclerosis section with white matter lesion next to ventricle. B) Average scattering image, showing reduced signal in lesion. C) Fiber orientation map, orientations coded by colorwheel. D) Zoom-in of box in (B) showing somewhat disrupted fiber orientations in the lesion area. E) Pig histology image. F) Average light scattering. G) Fiber orientation map. H) Zoom-in of box in (F), showing two U-fiber tracts and multiple crossings fibers, e.g., of external/internal capsule and corpus callosum fibers (white arrows).
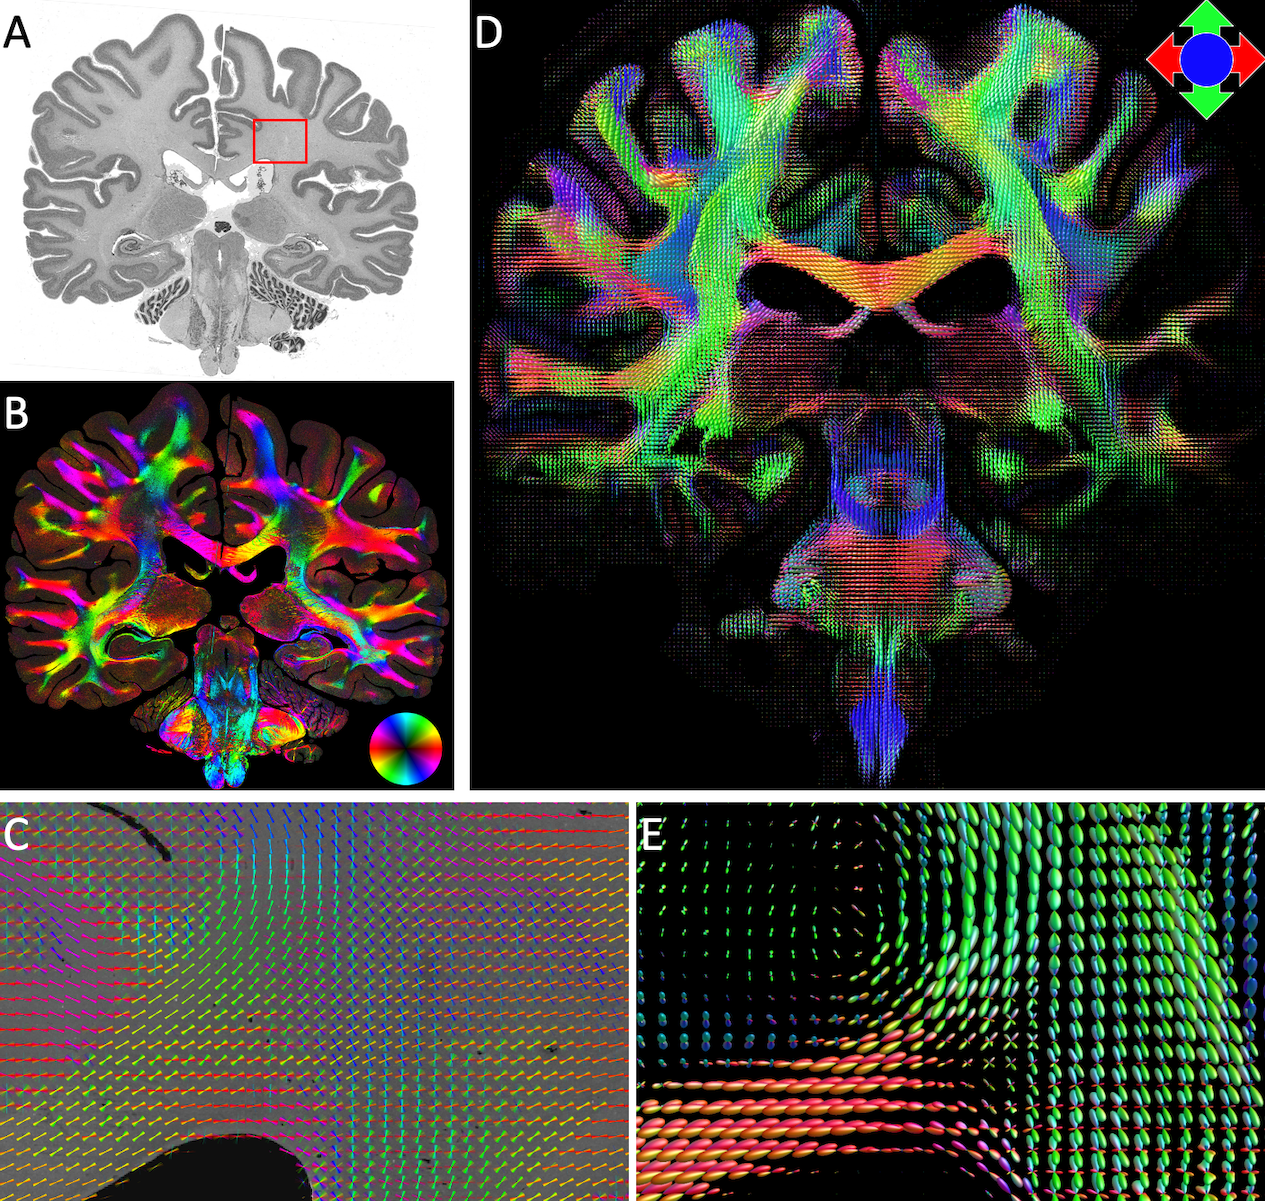
Figure 5. Comparison of ComSLI and diffusion MRI . A-B) Histology image and fiber orientation map of BigBrain section from Figure 2. C) Zoom-in of box in (A), with ComSLI showing fiber orientations and crossings in the corpus callosum and corona radiata region. Lines depicting fiber orientations are overlaid on 25x25 pixels for better visualization. D) Fiber orientations from similar section from in vivo diffusion MRI of an aged-matched male. E) Fiber orientations of region similar to (C), where less crossings can be observed.