2042
Exploring Correlations Between Imaging Biomarkers of Macromolecular, Myelin Water, and Myelin Content in the Brain1Department of Radiology, University of California San Diego, San Diego, CA, United States, 2Department of Bioengineering, University of California San Diego, San Diego, CA, United States, 3Radiology Service, Veteran Affairs San Diego Healthcare System, San Diego, CA, United States
Synopsis
Keywords: White Matter, White Matter, MMF, MWF, MPF, Myelin
Motivation: Myelin imaging metrics have varying degrees of association with histology but have not yet been correlated with each other.
Goal(s): To explore correlations between macromolecular protein, myelin water, and non-aqueous myelin content on a 3T clinical scanner.
Approach: Seven healthy volunteers were scanned using an MT-Cones sequence to provide for two-pool MT modeling of macromolecular proton fraction (MMF), a STAIR-STE-Cones sequence to quantify myelin water fraction (MWF), and a STAIR-UTE-Cone to estimate non-aqueous myelin proton fraction (MPF).
Results: Strong, significant correlations were found between these three myelin imaging biomarkers with R values of 0.856, 0.876, and 0.775, respectively
Impact: Strong positive correlations were found between the three imaging biomarkers of macromolecular, myelin water, and non-aqueous myelin components. This may help in understanding the value of these myelin imaging biomarkers in the assessment of neuroinflammatory and neurodegenerative diseases.
Introduction
Changes in the myelin content of brain are hallmarks of many neuroinflammatory and neurodegenerative diseases1–3. Advanced MR imaging techniques have been developed to directly or indirectly assess myelin changes in the brain 1–3. Quantitative two-pool magnetization transfer (MT) modeling has been used to indirectly assess semisolid tissue changes in the brain 4,5. Myelin water (MW) imaging and non-aqueous myelin imaging techniques have been used to directly assess myelin content changes 6–8. However, while there is evidence that MT, MW, and myelin imaging each correlate with histologically assessed myelin, there has not yet been a comparison between these biomarkers 9,10.In this study, we employed a 3D MT-prepared Cones (MT-Cones) sequence to obtain two-pool MT modeling of macromolecular proton fraction (MMF) 11, a short-TR adiabatic inversion recovery prepared single echo time Cones (STAIR-STE-Cones) sequence to quantify myelin water fraction (MWF) 8, and a STAIR ultrashort echo time Cones (STAIR-UTE-Cones) sequence to estimate non-aqueous myelin proton fraction (MPF) 7. We aimed to explore the correlations between these three imaging biomarkers in the brains of healthy volunteers using a 3T clinical scanner.
Methods
Seven healthy volunteers (mean age: 39±16 years, 6 females) were recruited and scanned using a 3T GE MR750 scanner. IRB approval was provided by the University of California, San Diego and informed consent was obtained from each volunteer.The detailed parameters for all the Cones sequences employed are listed in Table 1. MWF was estimated from STAIR-STE-Cones and PD-STE-Cones scans 8, while MPF was quantified from STAIR-UTE-Cones and PD-UTE-Cones scans 7. Non-aqueous myelin has a much shorter T2* than that of MW (~2ms vs. ~10ms) 7,8. A relatively long TE of 2 ms was chosen for STAIR-STE-Cones imaging to allow the ultrashort non-aqueous myelin signal to fully decay while preserving the longer MW signal to avoid contamination in the MWF estimation. A short TR (i.e., 250ms) in the STAIR-STE-Cones sequence enabled long T2 water signal suppression and selective imaging of MW content 8. A minimum TR (i.e., 140ms), restricted by SAR, was used with the STAIR-UTE-Cones sequence to enable both short and long-T2 water signal suppression as well as selective imaging of non-aqueous myelin 7. A 3D AFI-Cones sequence was utilized to map B1 and correct for B1 inhomogeneity in the MT modeling 12.
Regions of interest (ROIs) were drawn by a neuroradiologist with 15 years' experience on eight white matter (WM) regions in the brain of the volunteers: the left and right centrum semiovales, periventricular regions, subcortical white matter, and splenium and genu of the corpus callosum; as well as two grey matter (GM) regions: the putamen and thalamus. The MMF, MWF, and MPF values of these ROIs in all seven volunteers were correlated with each other using Pearson’s correlation.
Results and Discussion
Figure 1 shows the representative images acquired using MT-Cones, STAIR-STE-Cones, PD-STE-Cones, STAIR-UTE-Cones, and PD-UTE-Cones sequences in a 32-year-old volunteer. The MT-Cones images obtained with stronger MT contrast show higher contrast between fluid and WM and between fluid and GM. As shown in the STAIR-STE-Cones and STAIR-UTE-Cones images, WM regions have much higher MW and non-aqueous myelin content than GM regions.Figure 2 shows the representative MPF, MWF, and MPF maps. Morphological and structural similarities can be seen between all three fraction maps in corresponding slices. Higher MMF, MWF, and MPF values are seen in WM regions compared with those in GM regions. The MMF, MWF, and MPF values in WM ranged from 9 to 12%, 7 to 11%, and 5 to 7%, respectively. The MMF, MWF, and MPF values in GM ranged from 5 to 7%, 2 to 4%, and 2 to 4 %, respectively.
Table 2 shows the summarized quantitative measurements of the eight WM and two GM ROIs across MMF, MWF, and MPF in all seven volunteers. As can be seen, the GM regions have much lower values than the WM regions across all three fraction maps.
Figure 3 shows the linear correlation curves for MMF vs MWF, MMF vs MPF, and MWF vs MPF with each graph demonstrating a strong positive correlation with Pearson’s correlation coefficients of R= 0.856, 0.876, and 0.775, respectively. All achieved statistical significance with p-values <0.001.
Conclusion
Strong positive correlations were found between the three imaging biomarkers, i.e., MMF for macromolecular content, MWF for MW content, and MPF for non-aqueous myelin content. Each of them is likely to have high sensitivity for assessment of myelin changes and measurement of a single one of them may be sufficient to provide clinically useful quantitation.Acknowledgements
The authors acknowledge grant support from National Institutes of Health (R01AR062581, R01AR068987, R01AR075825, F32AG082458-01, K01AR080257, R01AR079484, and RF1AG075717), VA Research and Development Services (Merit Awards I01CX001388, I01CX002211, and I01BX005952), and GE Healthcare.
References
1. Laule C, Vavasour IM, Kolind SH, Li DK, Traboulsee TL, Moore GW, MacKay AL. Magnetic resonance imaging of myelin. Neurotherapeutics. 2007 Jul 1;4(3):460-84.
2. van der Weijden CW, García DV, Borra RJ, Thurner P, Meilof JF, van Laar PJ, Dierckx RA, Gutmann IW, de Vries EF. Myelin quantification with MRI: A systematic review of accuracy and reproducibility. Neuroimage. 2021 Feb 1;226:117561.
3. Piredda GF, Hilbert T, Thiran JP, Kober T. Probing myelin content of the human brain with MRI: A review. Magn Reson Med. 2021 Feb;85(2):627-52.
4. Tozer D, Ramani A, Barker GJ, Davies GR, Miller DH, Tofts PS. Quantitative magnetization transfer mapping of bound protons in multiple sclerosis. Magn Reson Med. 2003;50(1):83-91. doi:10.1002/mrm.10514
5. Quantitative imaging of magnetization transfer exchange and relaxation properties in vivo using MRI. Magn Reson Med. 2001;46(5):923-931. doi:10.1002/mrm.1278.
6. Laule C. Magnetic Resonance of Myelin Water: An in vivo Marker for Myelin. Zalc B, ed. Brain Plast. 2016;2(1):71-91. doi:10.3233/BPL-160033
7. Ma Y, Jang H, Wei Z, et al. Myelin Imaging in Human Brain Using a Short Repetition Time Adiabatic Inversion Recovery Prepared Ultrashort Echo Time (STAIR-UTE) MRI Sequence in Multiple Sclerosis. Radiology. 2020;297(2):392-404. doi:10.1148/radiol.2020200425
8. Ma Y, Jang H, Lombardi AF, Corey‐Bloom J, Bydder GM. Myelin water imaging using a short‐TR adiabatic inversion‐recovery (STAIR) sequence. Magn Reson Med. 2022;88(3):1156-1169. doi:10.1002/mrm.29287
9. Lankford CL, Does MD. On the inherent precision of mcDESPOT: On the Inherent Precision of mcDESPOT. Magn Reson Med. 2013;69(1):127-136. doi:10.1002/mrm.24241
9. Mancini M, Karakuzu A, Cohen-Adad J, Cercignani M, Nichols TE, Stikov N. An interactive meta-analysis of MRI biomarkers of myelin. eLife. 2020;9:e61523. doi:10.7554/eLife.61523
10. Laule C, Moore GRW. Myelin water imaging to detect demyelination and remyelination and its validation in pathology. Brain Pathol. 2018;28(5):750-764. doi:10.1111/bpa.12645
11. Ma Y, Chang EY, Carl M, Du J. Quantitative magnetization transfer ultrashort echo time imaging using a time-efficient 3D multispoke Cones sequence: 3D Multispoke UTE-Cones-MT Imaging. Magn Reson Med. 2018;79(2):692-700. doi:10.1002/mrm.26716
12. Ma Y, Zhao W, Wan L, Guo T, Searleman A, Jang H, Chang EY, Du J. Whole knee joint T1 values measured in vivo at 3T by combined 3D ultrashort echo time cones actual flip angle and variable flip angle methods. Magn Reson Med. 2019 Mar;81(3):1634-44.
Figures
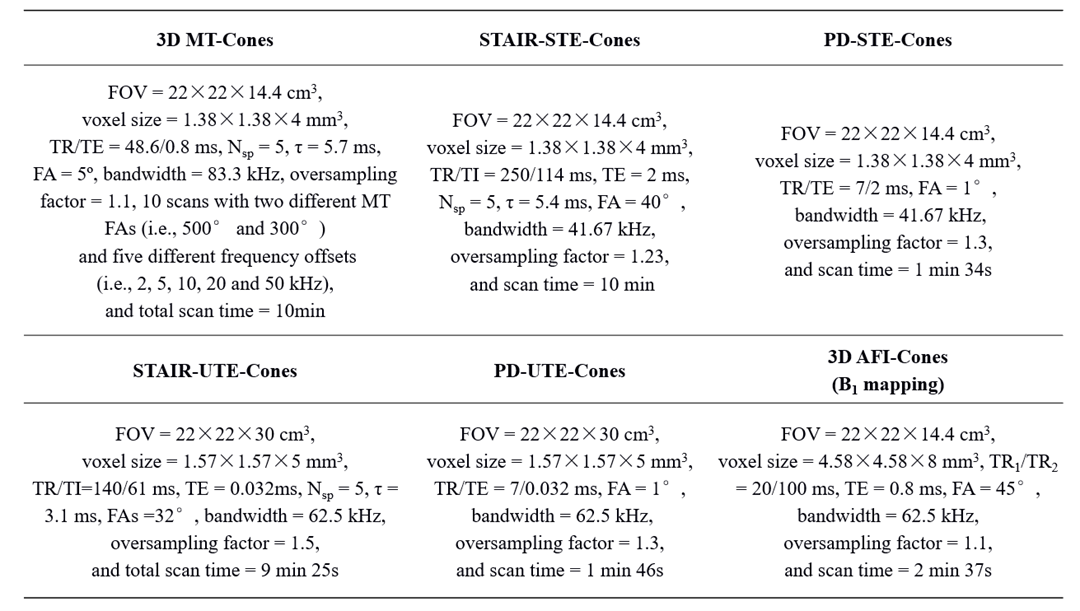
Table 1 Sequence parameters for MT, MW, and non-aqueous myelin imaging protocol.
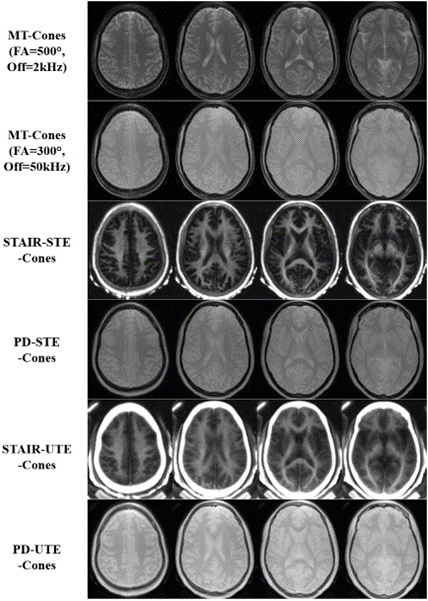
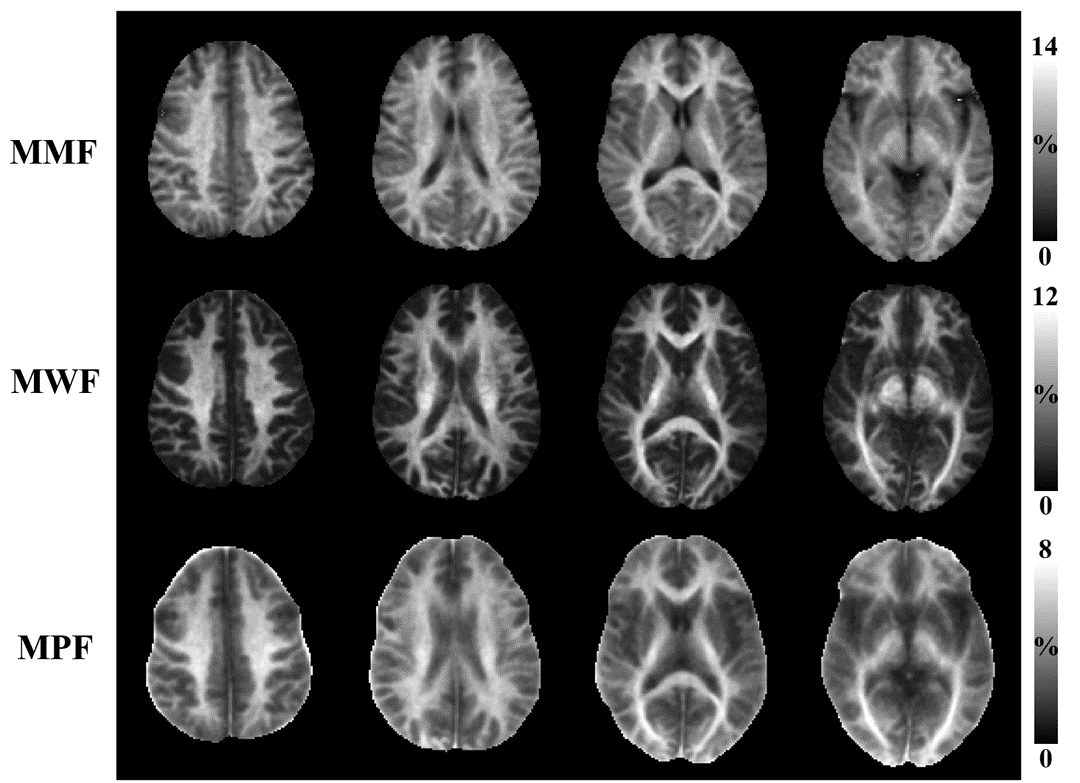
Figure 2 Representative MMF (first row), MWF (second row), and MPF (third row) maps in the brain. Higher MMF, MWF, and MPF values are observed in WM compared with GM.

Table 2 Summarized mean quantitative measurements of the eight WM ROIs (G= Genu, S= Splenium, LCS=Left centrum semiovale, LS= Left subcortical WM, LV =Left periventricular region, RCS=Right centrum semiovale, RS= Right subcortical WM, RV =Right periventricular region) and two GM ROIs (T= Thalamus, P=Putamen) regions across MMF (first row), MWF (second row), and MPF (third row) for all seven volunteers.
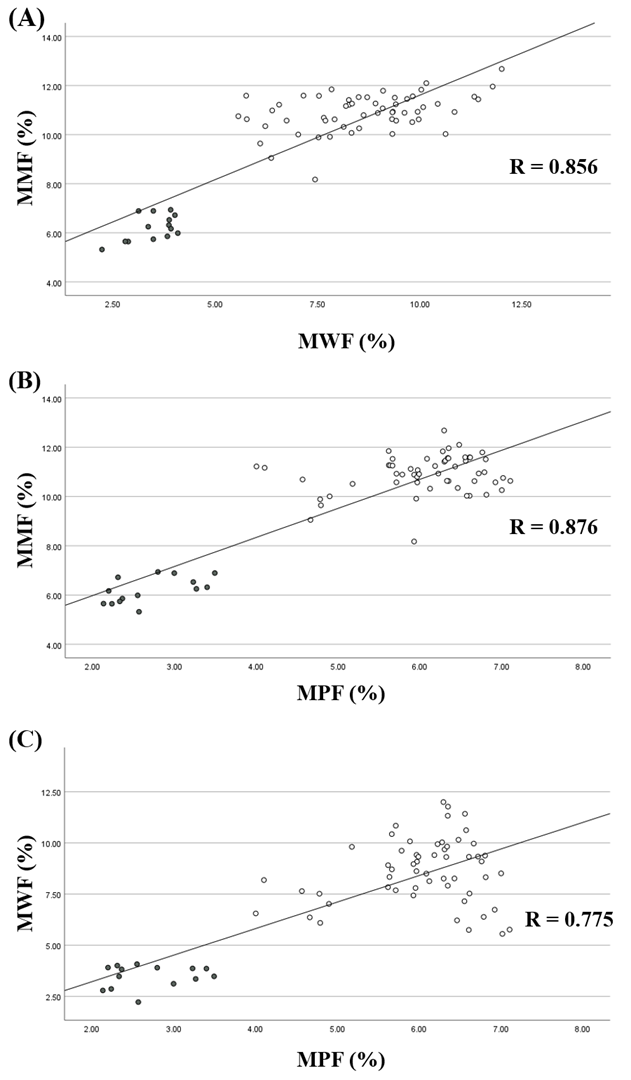
Figure 3 Linear correlation curves for MMF vs MWF (A), MMF vs MPF (B), and MWF vs MPF (C). The circles represent measurements in WM regions while the grey dots represent measurements in GM regions. Strong positive correlations are seen in all the comparisons: MMF vs MWF (R= 0.856), MMF vs MPF (R= 0.876), and MWF vs MPF (R= 0.775).