2040
Advanced Diffusion Detects Possible Myelin Changes in Alzheimer’s and Huntington’s Mouse Models and Treatment
1Department of Radiology, Stanford University Medical Center, Stanford, CA, United States, 2Department of Neurology and Neurological Sciences, Stanford University School of Medicine, Stanford, CA, United States, 3Department of Radiology, Weill Cornell Medicine, Ithaca, NY, United States
Synopsis
Keywords: White Matter, Diffusion/other diffusion imaging techniques, Myelin, Neurodegeneration
Motivation: Myelin degeneration is implicated in many neurological diseases. Diffusion and susceptibility MRI provide metrics to assess myelin degeneration.
Goal(s): Treatment can affect myelination in neurodegeneration and diffusion metrics can be used to follow these changes.
Approach: After detailed registration to the Allen Atlas, we examined key white matter areas (corpus callosum, fornix).
Results: We observed diffusivity increases and kurtosis/axonal water fraction decreases in AD mice. We also saw an inverse trend in HD mice. Interestingly, this was reversed by treatment and confirmed histologically.
Impact: We find diffusion changes suggesting myelin loss in Alzheimer’s mice, and inverse changes in Huntington’s mice that are reversed by disease-modifying treatment and confirmed histologically. Advanced diffusion metrics can be useful biomarkers to monitor myelin changes and treatment in neurodegeneration.
Introduction
Myelin integrity is central to healthy brain function, and its deterioration is implicated in neurodegenerative diseases. Diffusion-based metrics including radial diffusivity (RD), radial kurtosis (RK), axonal water fraction (AWF)1,2, and susceptibility-based metrics including quantitative susceptibility mapping (QSM) and R2* can be myelin sensitive and have been used to detect myelin changes3,4,5. In this study, we use advanced diffusion and susceptibility metrics to detect degenerative myelin changes in AD and HD mouse models. We also examined if modulating the p75 neurotrophin receptor (NTR) with a ligand in HD mice could reverse the possible myelin-related changes as observed by MRI metrics, indicating it can prevent myelin changes in HD mice.Methods
SamplesAD Study – Brains from 8-month-old male hAPP (Lond/Swe mutations) mice and wild-type (WT) littermates (n=4 mice/group) were scanned in 2 sessions, 2 AD/2 WT brains each.
HD Study – Brains from 12-week-old R6/2 mice treated with vehicle (water) or the p75 receptor (p75NTR) ligand, LM11A-31 (50mg/kg), for 7 weeks along with vehicle-treated age-matched wild type (WT) controls (n=4 mice/group) were scanned in 3 sessions. Each session contained all treatment groups.
MRI
Scans were performed in a Bruker 7T scanner, in 5 sessions (4 brains/session) as mentioned above.
Diffusion MRI (dMRI): 4 shells, 100 total directions at b=[1,2,5,10]
Multi-gradient echo (MGE): 10 echoes, TE=4ms, 4ms echo spacing, TR=64ms, 100μm iso, 3 repetitions.
Intramodality processing (Fig. 1): Diffusion shells were aligned with FSL-FLIRT, MP-PCA-denoised6 and degibbsed. Diffusion metrics (mean, radial and axial diffusivities -MD/RD/AD, kurtoses -MK/RK/AK, and axonal water fraction -AWF) were generated using DESIGNER7. The 3 MGE repetitions were similarly aligned, denoised using the echoes (10x), repetitions (3x) and real-imaginary (2x) redundancy, and susceptibility-based parameters (R2*, QSM) were generated using MEDI8.
Alignment to Allen Atlas: (Fig. 2): After masking, each brain’s mean MGE image was registered to the Allen Atlas first linearly (FSL FLIRT) and then non-linearly (ANTs). The combined transform was applied to R2* and QSM. For diffusion, the 4-brain-containing b0 images were linearly registered to the 4-brain MGEs. Then MGE-to-atlas transformations were applied to each brain, which was additionally non-linearly registered to the atlas. The full combined transforms were applied to diffusion-based metrics (diffusivities, kurtoses, AWF) bringing them directly to atlas space.
ROI generation: Allen Atlas ROIs were used with 1-pixel erosion to avoid partial volume artifacts. The white matter regions selected for analysis were the corpus callosum and the fornix, due to their importance and size after erosion.
Quantification: Median ROI values were used. For the AD study, the effect of scanning batch was included in a 2-way ANOVA analysis was performed due to long time between scans. For the HD study, two-sample t-tests were performed between the 3 groups.
A second set of similar HD R6/2 brains (WT, HD-vehicle, HD-treated, n = 7-13 mice/group) were immunostained for myelin basic protein (MBP). The percent area of MBP immunostaining in the striatum was determined by ImageJ thresholding.
Results
Diffusion parameters yielded significant differences in AD vs controls in both the corpus callosum and the fornix, Fig. 3. The AD mice showed increased RD and reduced AWF and RK compared to controls in both ROIs, suggesting a loss of myelinated axons. Susceptibility-based metrics show no clear trends, possibly due to confounding effects of iron.HD-vehicle mice showed increasing trend vs WT in AWF and RK and decreases in RD in both ROIs, Fig. 4. Interestingly, LM11A-31 treated HD mice showed a significant reversal in all metrics but RK.
Compared to WTs, the area of MBP immunostaining for HD-vehicle mice was increased in the striatum, the area most vulnerable to HD degeneration in vehicle-treated R6/2 mice. This increase in R6/2 mice was prevented by LM11A-31 (Fig. 5).
Discussion
In this study RD, RK, and AWFAcknowledgements
The present work was supported by the National Institutes of Health (NIH), award numbers R01AG061120, R21AG07267501, R21NS12008702, R01NS095985, and by the Jean Perkins and Sherrill Family FoundationsReferences
1. Fieremans, E., Jensen, J. H., & Helpern, J. A. (2011). White matter characterization with diffusional kurtosis imaging. NeuroImage, 58(1), 177–188 https://doi.org/10.1016/j.neuroimage.2011.06.006
2. Fieremans, E., Benitez, A., Jensen, J. H., Falangola, M. F., Tabesh, A., Deardorff, R. L., Spampinato, M. V., Babb, J. S., Novikov, D. S., Ferris, S. H., & Helpern, J. A. (2013). Novel white matter tract integrity metrics sensitive to Alzheimer disease progression. AJNR. American journal of neuroradiology, 34(11), 2105–2112. https://doi.org/10.3174/ajnr.A3553
3. van der Weijden, C. W. J., Biondetti, E., Gutmann, I. W., Dijkstra, H., McKerchar, R., de Paula Faria, D., de Vries, E. F. J., Meilof, J. F., Dierckx, R. A. J. O., Prevost, V. H., & Rauscher, A. (2023). Quantitative myelin imaging with MRI and PET: an overview of techniques and their validation status. Brain: a journal of neurology, 146(4), 1243–1266. https://doi.org/10.1093/brain/awac436
4. Ravanfar, P., Loi, S. M., Syeda, W. T., Van Rheenen, T. E., Bush, A. I., Desmond, P., Cropley, V. L., Lane, D. J. R., Opazo, C. M., Moffat, B. A., Velakoulis, D., & Pantelis, C. (2021). Systematic Review: Quantitative Susceptibility Mapping (QSM) of Brain Iron Profile in Neurodegenerative Diseases. Frontiers in neuroscience, 15, 618435. https://doi.org/10.3389/fnins.2021.618435
5. Bartzokis, G., Lu, P.H., Tishler, T.A. et al. Myelin Breakdown and Iron Changes in Huntington’s Disease: Pathogenesis and Treatment Implications. Neurochem Res 32, 1655–1664 (2007). https://doi.org/10.1007/s11064-007-9352-7
6. Veraart, J., Novikov, D. S., Christiaens, D., Ades-Aron, B., Sijbers, J., & Fieremans, E. (2016). Denoising of diffusion MRI using random matrix theory. NeuroImage, 142, 394–406. https://doi.org/10.1016/j.neuroimage.2016.08.016
7. Benjamin Ades-Aron, Jelle Veraart, Peter Kochunov, Stephen McGuire, Paul Sherman, Elias Kellner, Dmitry S. Novikov, Els Fieremans. (2018). Evaluation of the accuracy and precision of the diffusion parameter EStImation with Gibbs and NoisE removal pipeline. NeuroImage. 183, 532-543. https://doi.org/10.1016/j.neuroimage.2018.07.066.
8. Liu, T., Xu, W., Spincemaille, P., Avestimehr, A. S., & Wang, Y. (2012). Accuracy of the morphology enabled dipole inversion (MEDI) algorithm for quantitative susceptibility mapping in MRI. IEEE transactions on medical imaging, 31(3), 816–824. https://doi.org/10.1109/TMI.2011.2182523
9. Crapser JD, Ochaba J, Soni N, Reidling JC, Thompson LM, Green KN. Microglial depletion prevents extracellular matrix changes and striatal volume reduction in a model of Huntington's disease. Brain. 2020;143(1):266-88. doi:10.1093/brain/awz363.
10. McCollum MH, Leon RT, Rush DB, Guthrie KM, Wei J. Striatal oligodendrogliogenesis and neuroblast recruitment are increased in the R6/2 mouse model of Huntington's disease. Brain Res. 2013;1518:91-103. doi:10.1016/j.brainres.2013.04.030.
11. Pellegatta M, Canevazzi P, Forese MG, Podini P, Valenzano S, Del Carro U, et al. ADAM17 Regulates p75(NTR)-Mediated Fibrinolysis and Nerve Remyelination. J Neurosci. 2022;42(12):2433-47. doi:10.1523/JNEUROSCI.1341-21.2022.
12. Ma Q, Yang J, Li T, Milner TA, Hempstead BL. Selective reduction of striatal mature BDNF without induction of proBDNF in the zQ175 mouse model of Huntington's disease. Neurobiol Dis. 2015;82:466-77. doi:10.1016/j.nbd.2015.08.008.
Figures
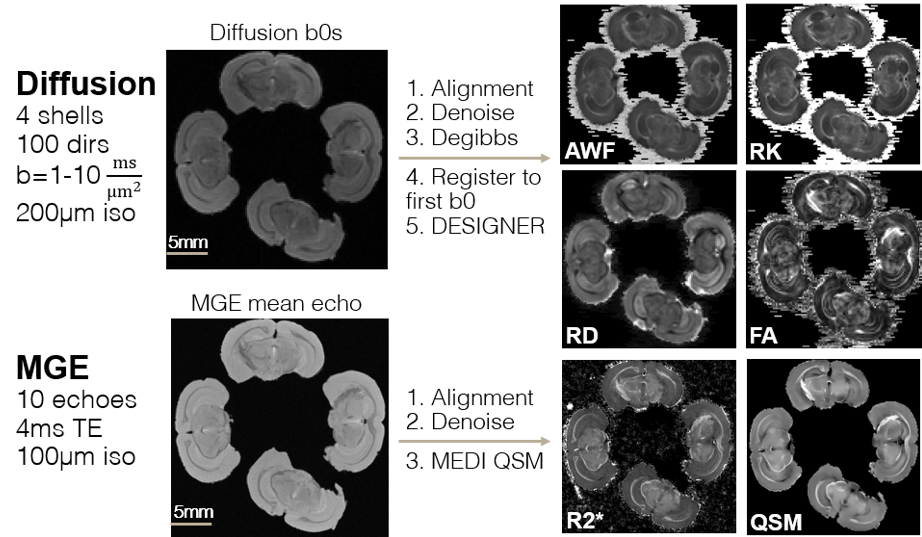
Figure 1: Preprocessing of diffusion and MGE scans and generation of diffusion- and susceptibility-based myelin-sensitive parameter maps. Axonal water fraction (AWF), radial kurtosis (RK), radial diffusivity (RD), and fractional anisotropy (FA) maps derived from DESIGNER pipeline4. R2* and quantitative susceptibility mapping (QSM) derived from MEDI pipeline5.
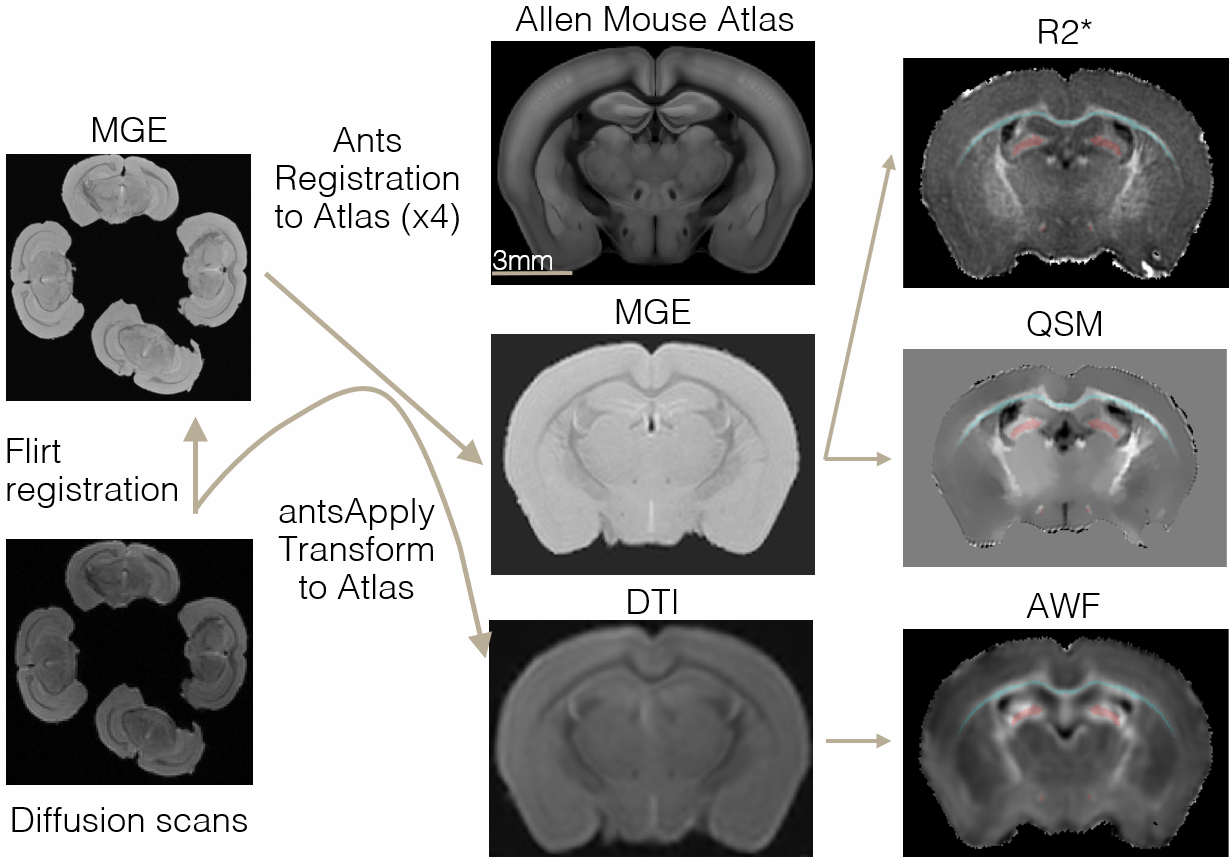
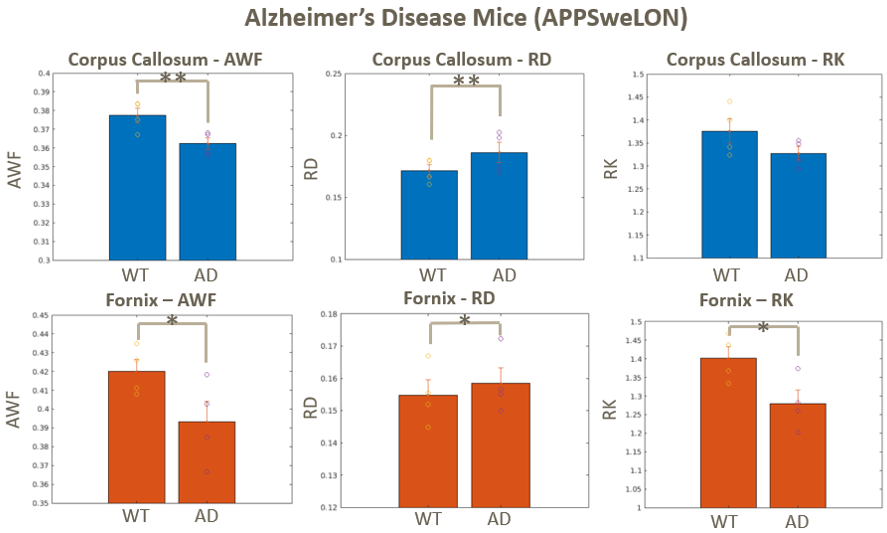
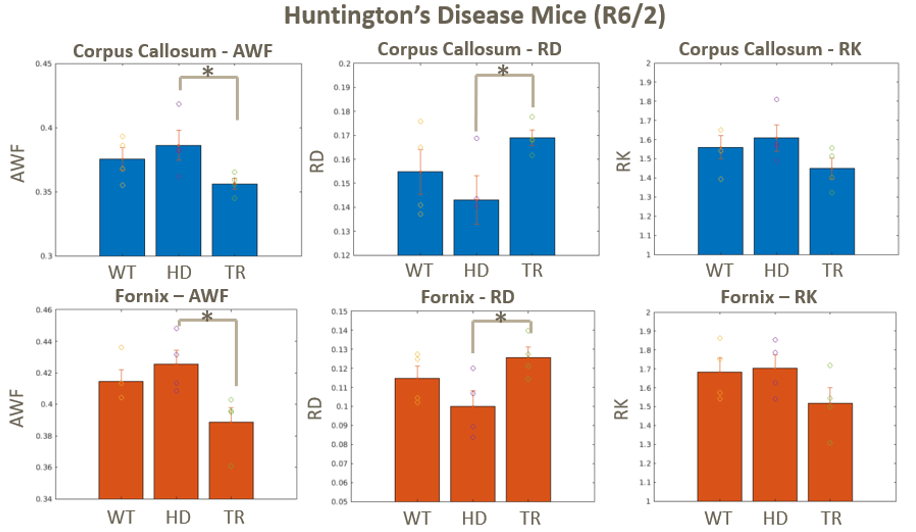
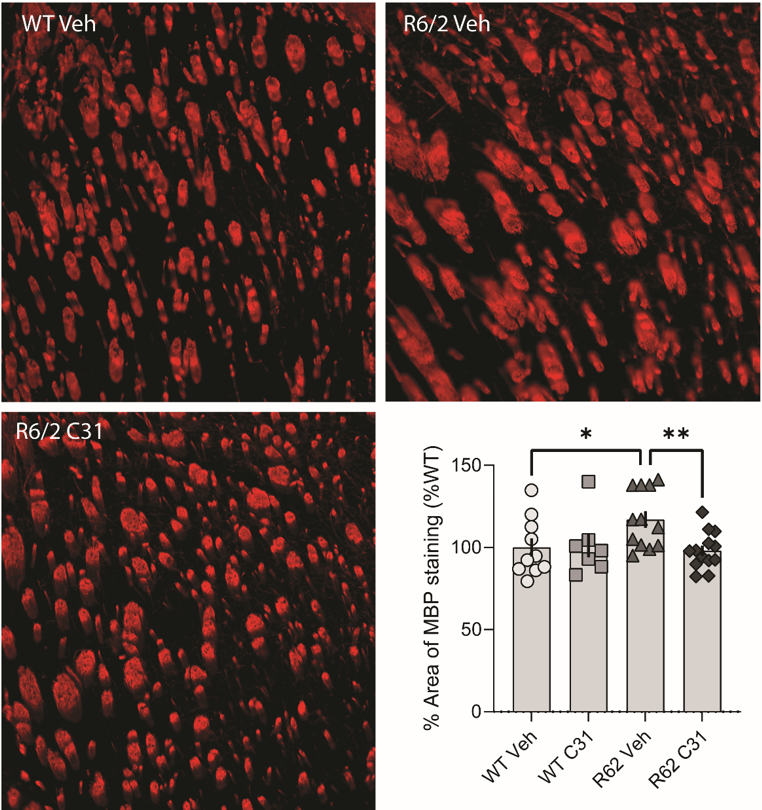
Figure 5: Representative photomicrographs of MBP immunostaining in the striatum of WT vehicle (Veh), R6/2 Veh and R6/2 LM11A-31 (C31) mice. Bar graph showing the quantification of the percent area occupied by MBP immunostaining in the striatum (*p ≤ 0.05 vs. WT Veh; **p < 0.001 vs. R6/2-Veh; n = 7-13 mice/group; ANOVA and Fisher’s LSD). Results are expressed as mean ± s.e.m. and normalized to the WT Veh group.