2039
Imaging the relationship of axon diameter and myelination in macaque and human brain1Martinos Center for Biomedical Imaging, Massachusetts General Hospital and Harvard Medical School, Boston, MA, United States, 2Department of Pharmacology and Physiology, University of Rochester, Rochester, NY, United States, 3McLean Hospital, Belmont, MA, United States
Synopsis
Keywords: White Matter, Microstructure
Motivation: Axon diameter and myelination are essential for conduction of action potentials and therefore related to brain function. However, the relationships between them in white matter (WM) across different species are not well understood.
Goal(s): To investigate the relationship between axon diameter and myelination in human and macaque brain WM.
Approach: We estimate axon diameter and myelin water fraction (MWF), and derive fiber g-ratio, using macaque and human brain data acquired on a preclinical scanner.
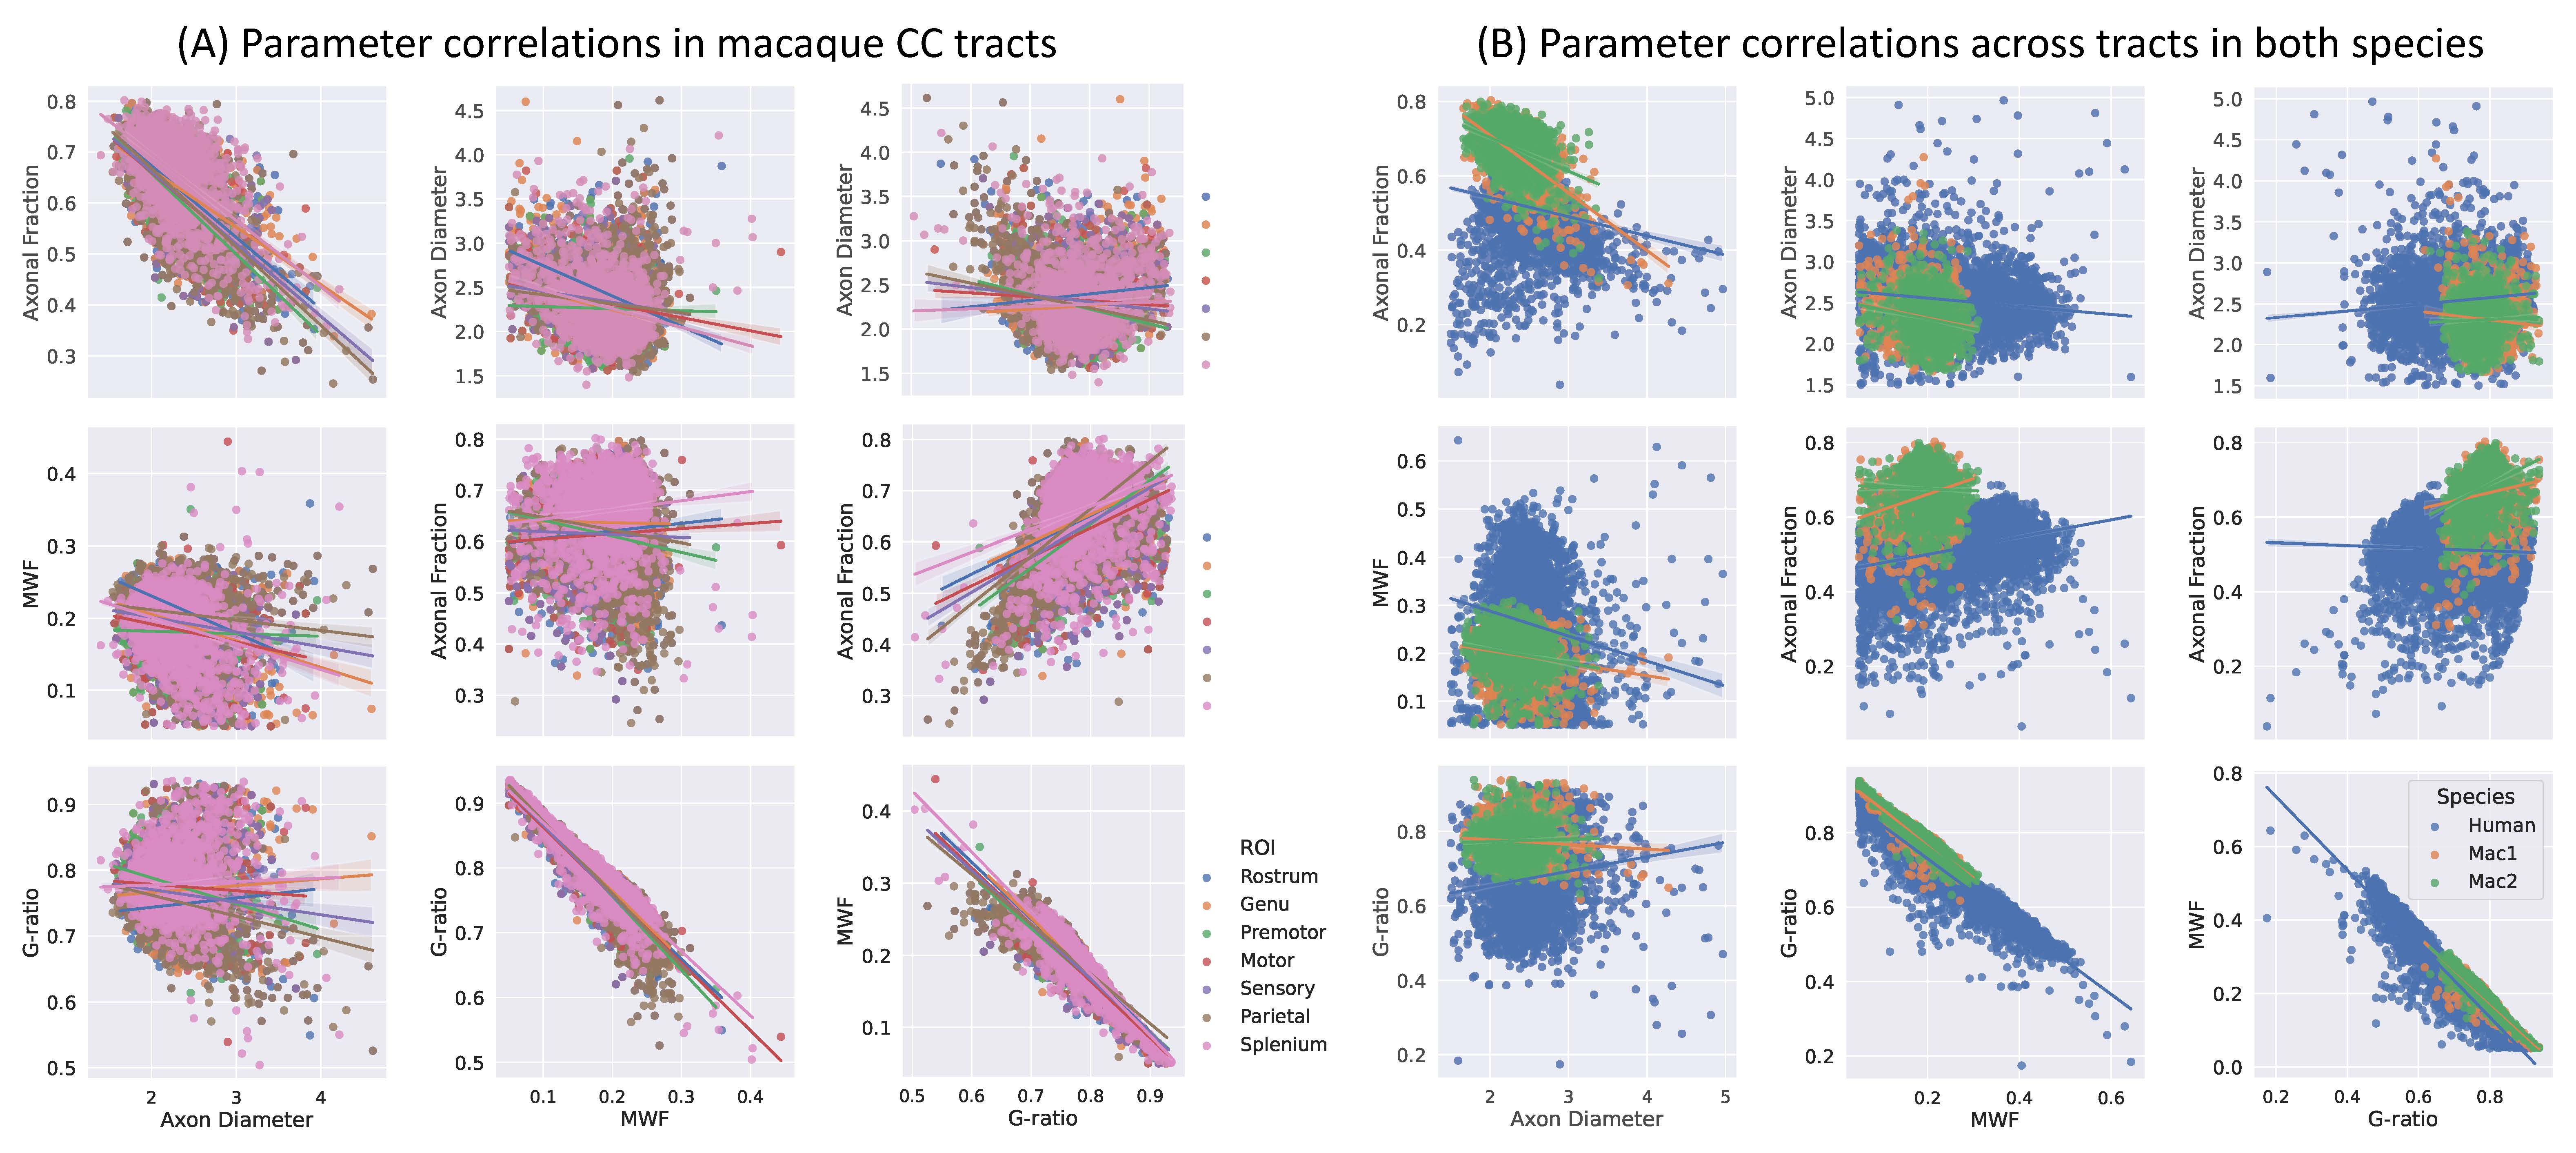
Results: Microstructure parameters exhibit consistent patterns across WM tracts and species. Regions with smaller axons tend to have higher packing density and MWF; fiber g-ratio is relatively stable.
Impact: The weak correlations between dMRI measures and MWF suggest they can provide complementary information about fiber morphology. The regional variations of these microstructure measures will be baseline for investigating changes in abnormal tissue conditions such as demyelination and axonal loss.
Introduction
Axon diameter and myelin thickness are closely related to the conduction velocity of action potentials in the nervous system1. Imaging them non-invasively is thus valuable for studying brain microstructure and function. Recent studies using ultra-high gradient strength diffusion MRI have demonstrated improved estimation of axon diameter across WM tracts2–7, while myelin-sensitive imaging has been established with several methods8. However, the relationships between axon diameter and myelination across the brain have not been investigated. Presence of myelin is an important assumption in most axon diameter models, therefore establishing their relationships in normal myelinated tissue is important for interpreting changes in conditions such as demyelination and axonal loss. In this study, we estimate axon diameter, myelin water fraction (MWF)9 and fiber g-ratio10 and investigate their correlations across the brain in ex vivo macaque and human brain samples.Methods
Data acquisition. We scanned two fixed macaque brains and one human brain tissue slab on a small-bore 4.7 T Bruker BioSpin MRI system. For axon diameter estimation, we collected DWIs using a two-shot 3D EPI sequence at 0.5 mm isotropic resolution and TE/TR = 52-55/500ms. The diffusion gradients width and separation were fixed at δ/Δ=11/15ms for 8 b-values at 1, 2.5, 5, 7.5, 11.1, 18.1, 25 and 43 ms/𝜇m2, reaching the Gmax= 660 mT/m of the system; 12 (b<=7.5 ms/𝜇m2) or 32 gradient directions were uniformly sampled over the hemisphere with one b=0 image for each b-shell. For MWF estimation, we collected multi-slice multi-echo images using the CPMG sequence with slice selective RF pulses and 0.5 mm isotropic resolution. 20 echo times from 8-160 ms with an equal echo spacing of 8 ms and TR of 3000 ms were used for the macaque samples; 40 echo times from 5-200ms with an equal spacing of 5ms and TR of 2000 ms were used for the human tissue.Axon diameter imaging. We use a four-compartment tissue model with the spherical mean technique11, which models intra-axonal space as cylinders of equal radii4,7,12, extra-axonal space as a diffusion tensor, free water as an isotropic tensor, and immobile water in ex vivo tissue as a dot compartment2,13. We fix only the free-water diffusivity to the value of ex vivo tissue at room temperature (2 𝜇m2/ms), and we assume that the intrinsic diffusivity is equal to intra-axonal and extra-cellular parallel diffusivity. The tissue parameters we estimate from the data are $$$θ= (𝑓_{𝑖𝑎},𝑑_𝑎,𝐷_∥^{𝑖𝑎}, 𝐷_⊥^{𝑒𝑐}, 𝑓_{𝑐𝑠𝑓}, 𝑓_{𝑑𝑜𝑡})$$$.
We use a two-stage Markov Chain Monte Carlo (MCMC) method with Gaussian noise model to sample the posterior probability of modelling parameters. Compared to fixing the diffusivity $$$𝐷_∥^{𝑖𝑎}$$$ to the same values, typically 0.6 𝜇m2/ms for ex vivo tissue7, we find that fitting all parameters improves the quality of fitting, as quantified by the Bayes factor. This however introduces a higher uncertainty of estimated $$$𝑓_{𝑖𝑎}$$$ and $$$𝑑_𝑎$$$, as quantified by the standard deviations of MCMC samples. We follow a two-stage approach: 1. Sampling probabilities of all 6 parameters and 2. Fixing $$$𝐷_∥^{𝑖𝑎}$$$ and $$$𝐷_⊥^{𝑒𝑐}$$$ to posterior means and sampling only the distributions of other parameters for each voxel. The second MCMC gives roughly the same likelihood of measurements and lower uncertainty of $$$𝑓_{𝑖𝑎}$$$ and $$$𝑑_𝑎$$$ than the first run.
MWF and g-ratio. We estimate the T2 spectrum from the multi-echo T2-weighted images using non-negative least squares14 with calibration for B1 field inhomogeneity15. From the T2 spectrum, we calculate MWF as the signal fraction for 6ms<T2<15 ms for the macaque samples and 6ms<T2<30 ms for the human sample. We calculate the aggregate g-ratio10 by calibrating MWF to myelin volume fraction16 and combining it with estimated $$$𝑓_{𝑖𝑎}$$$ from dMRI data.
Results
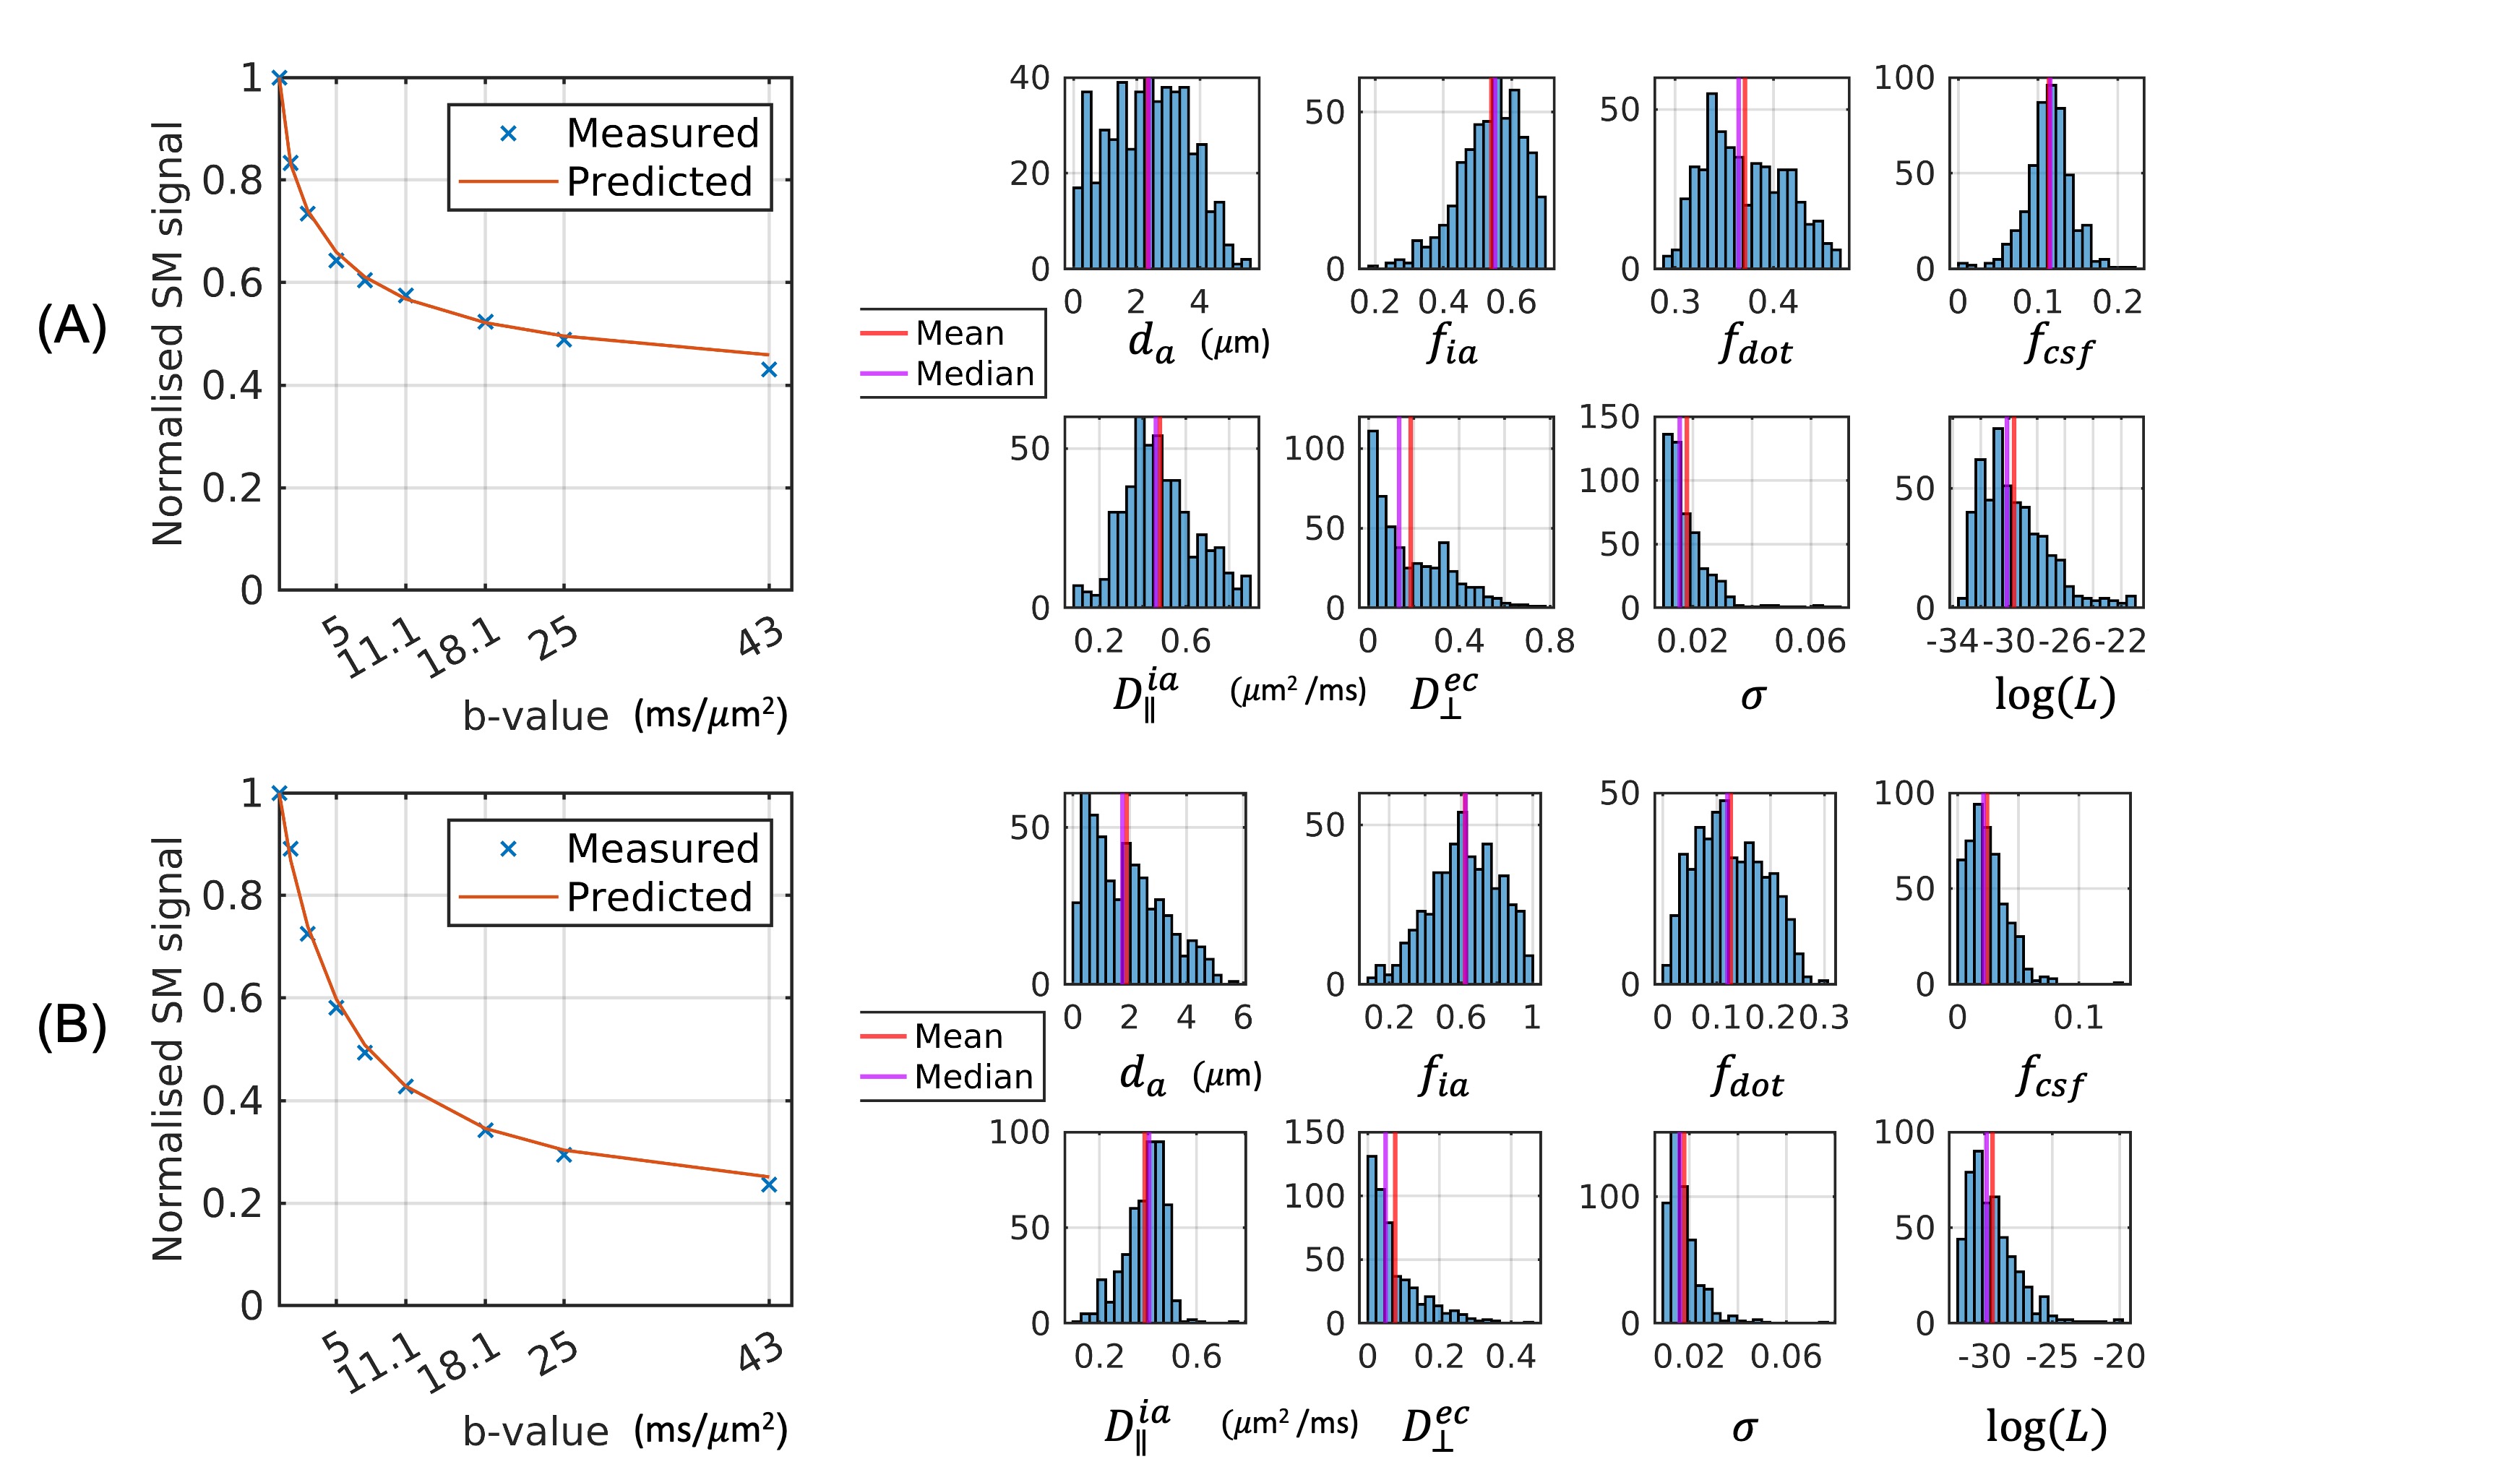
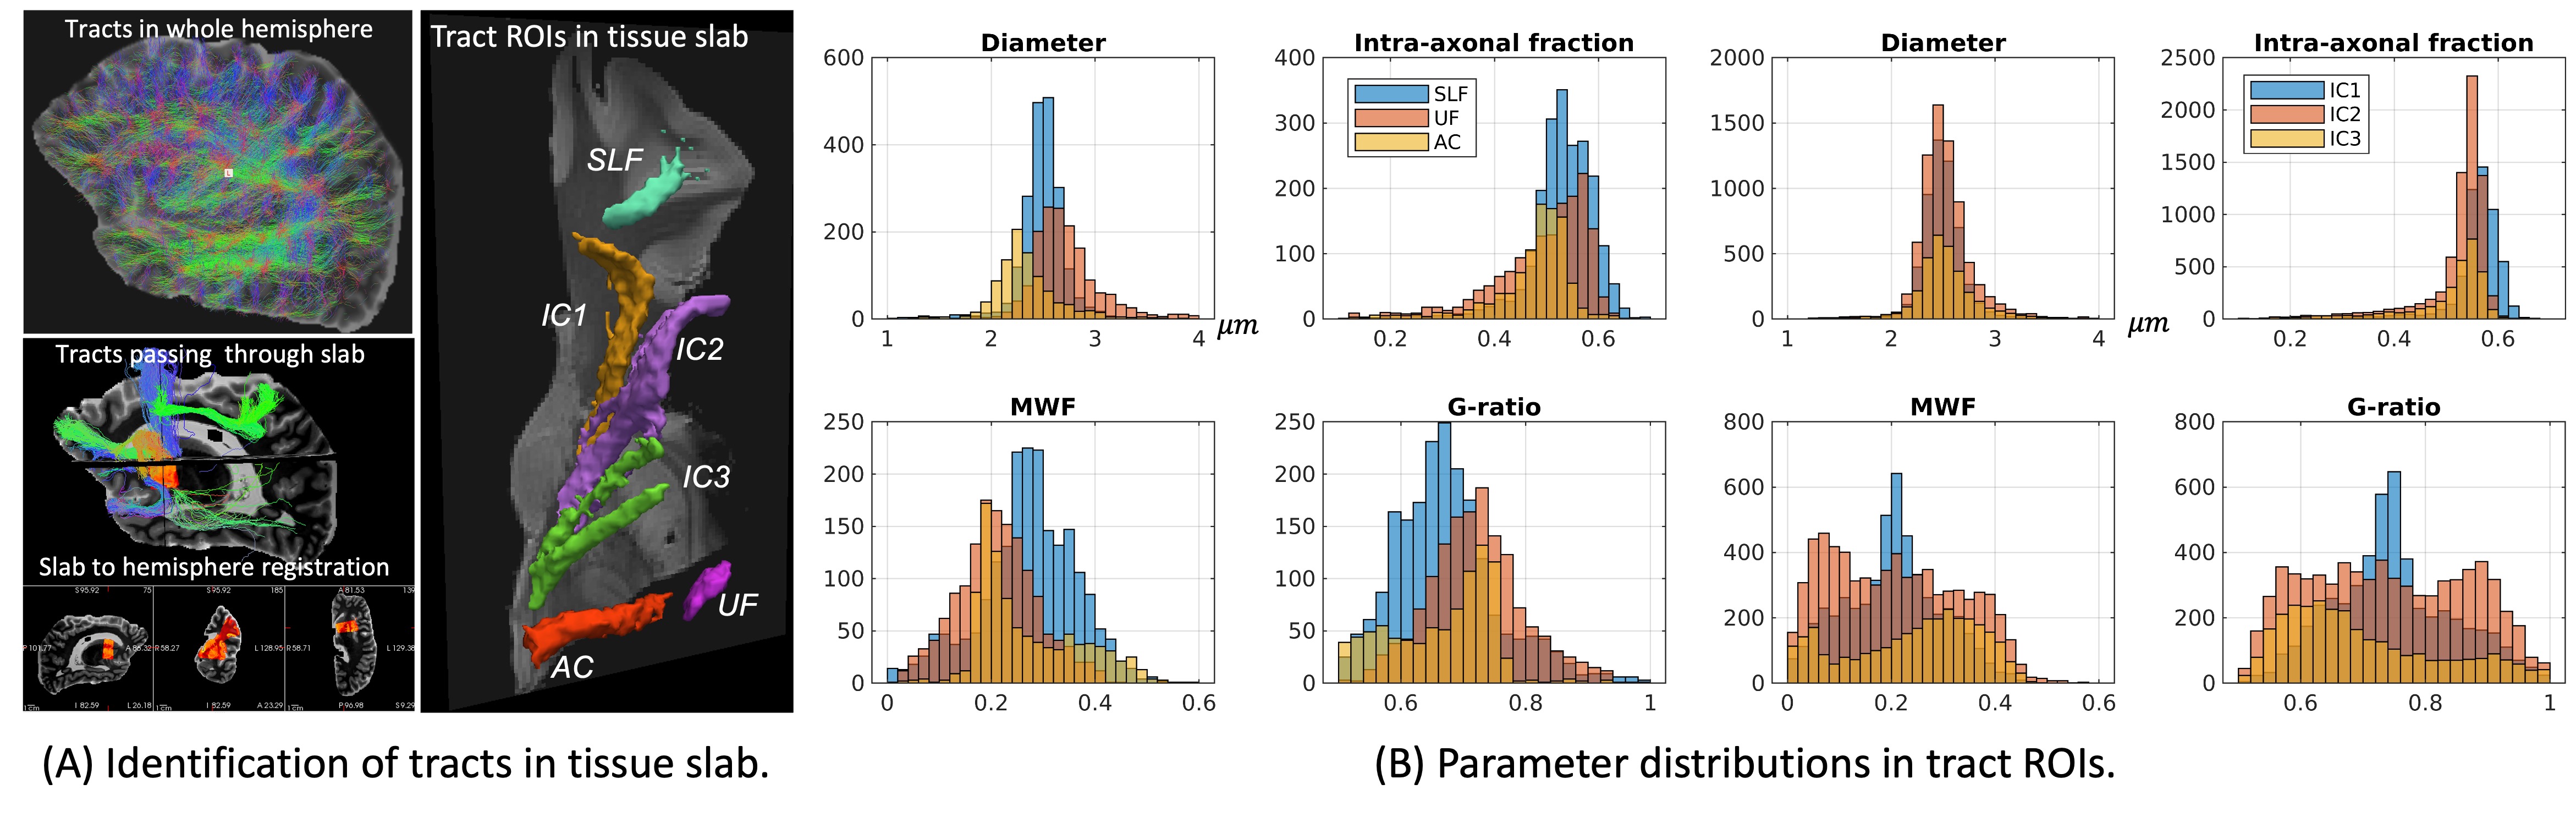
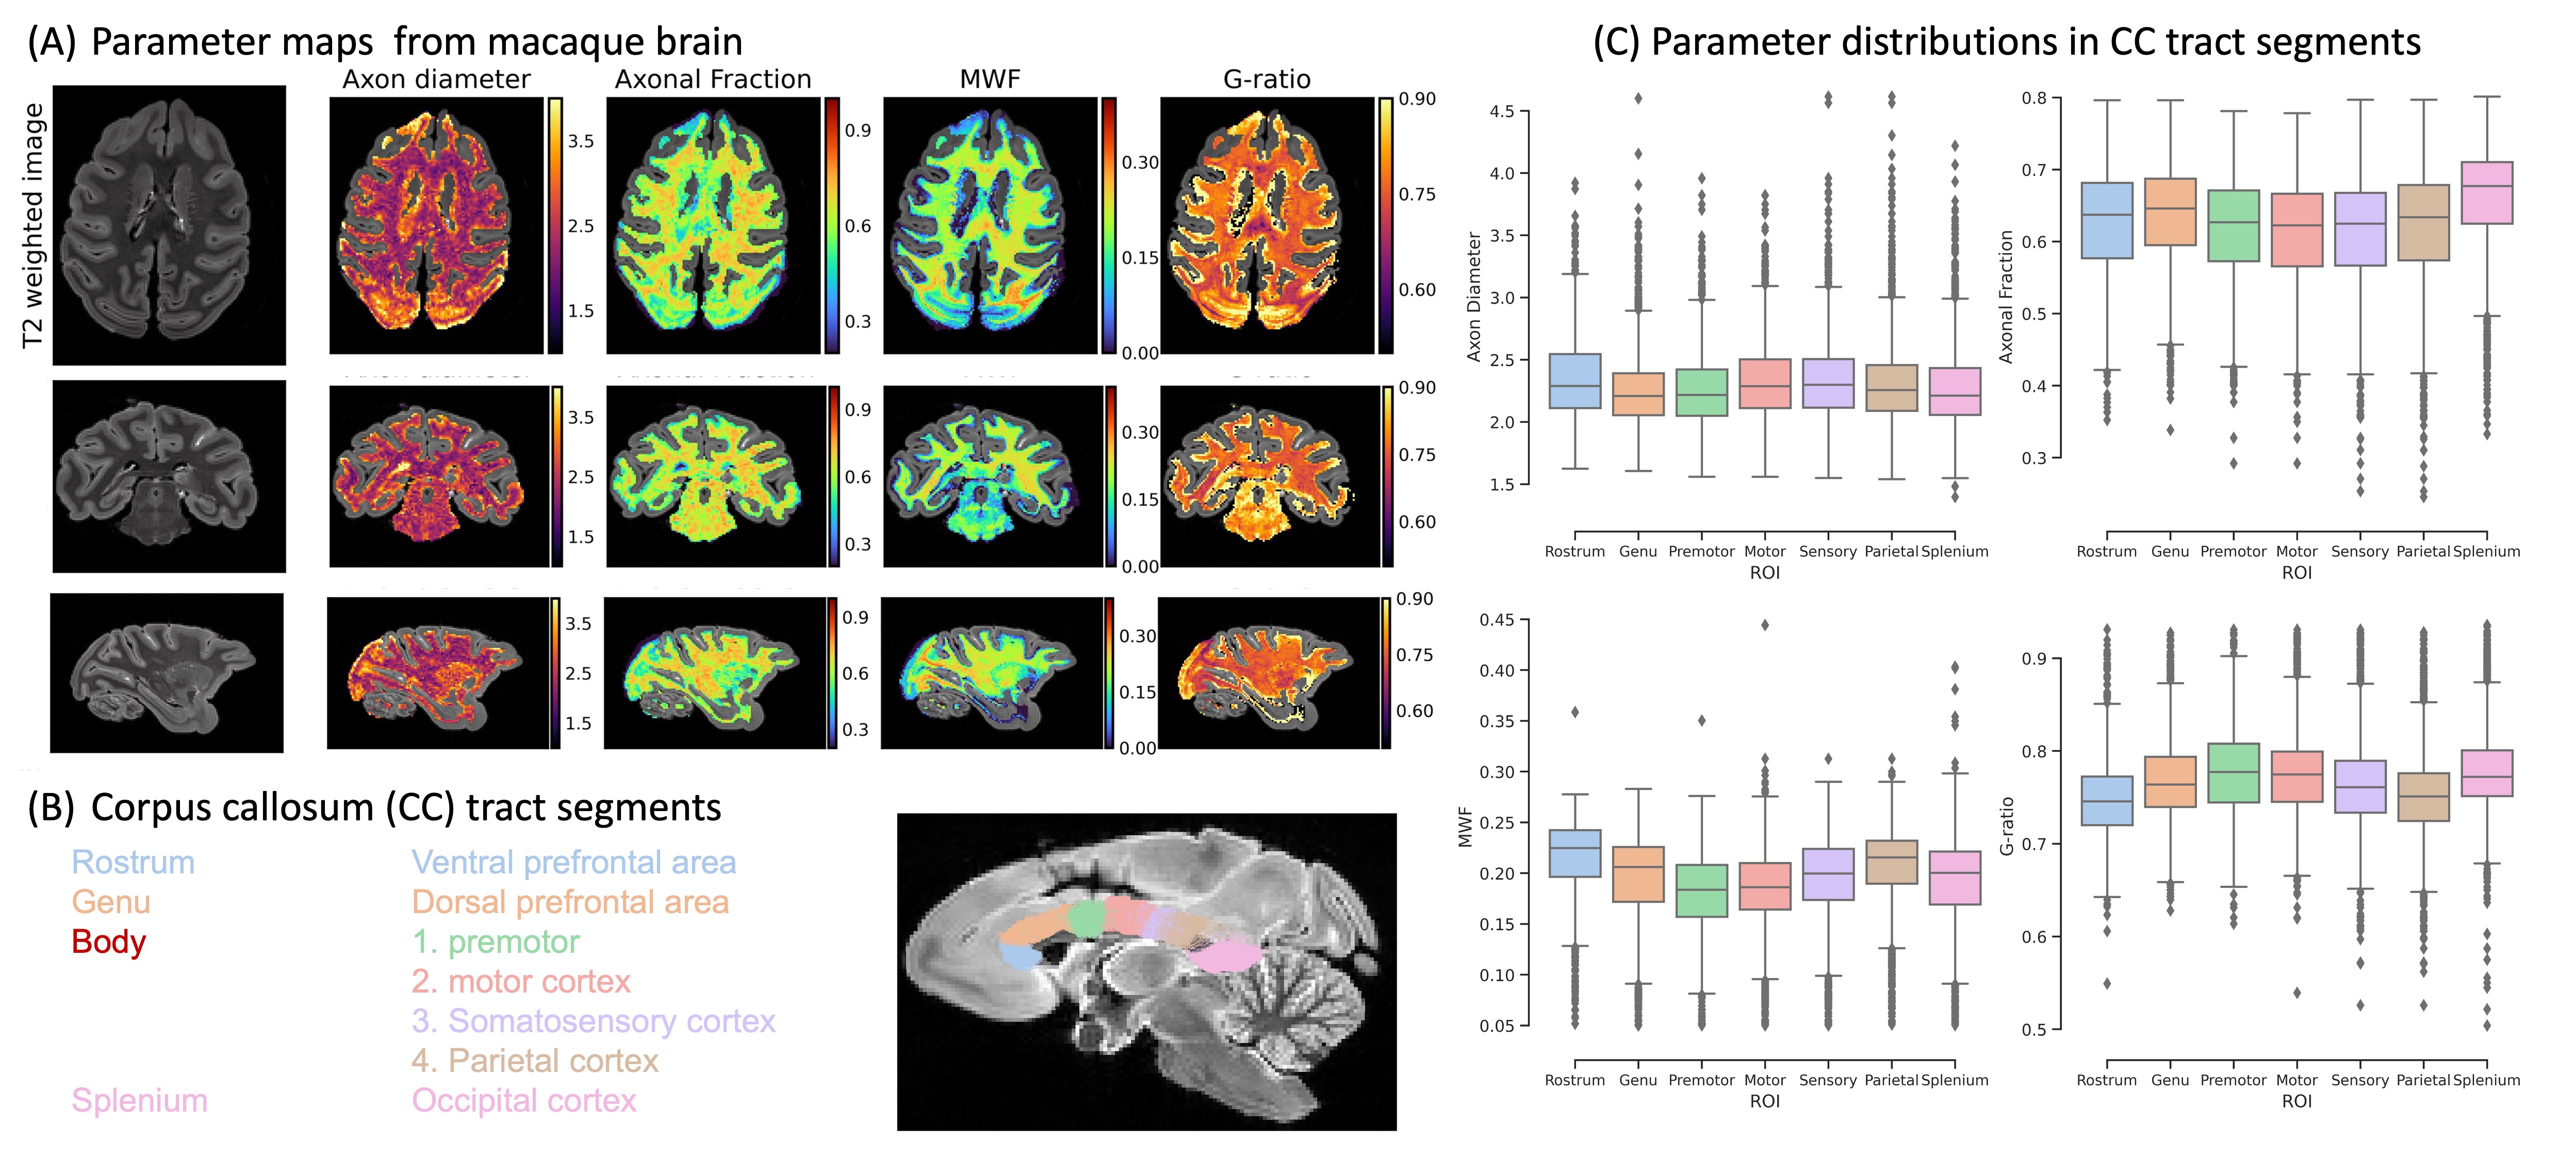
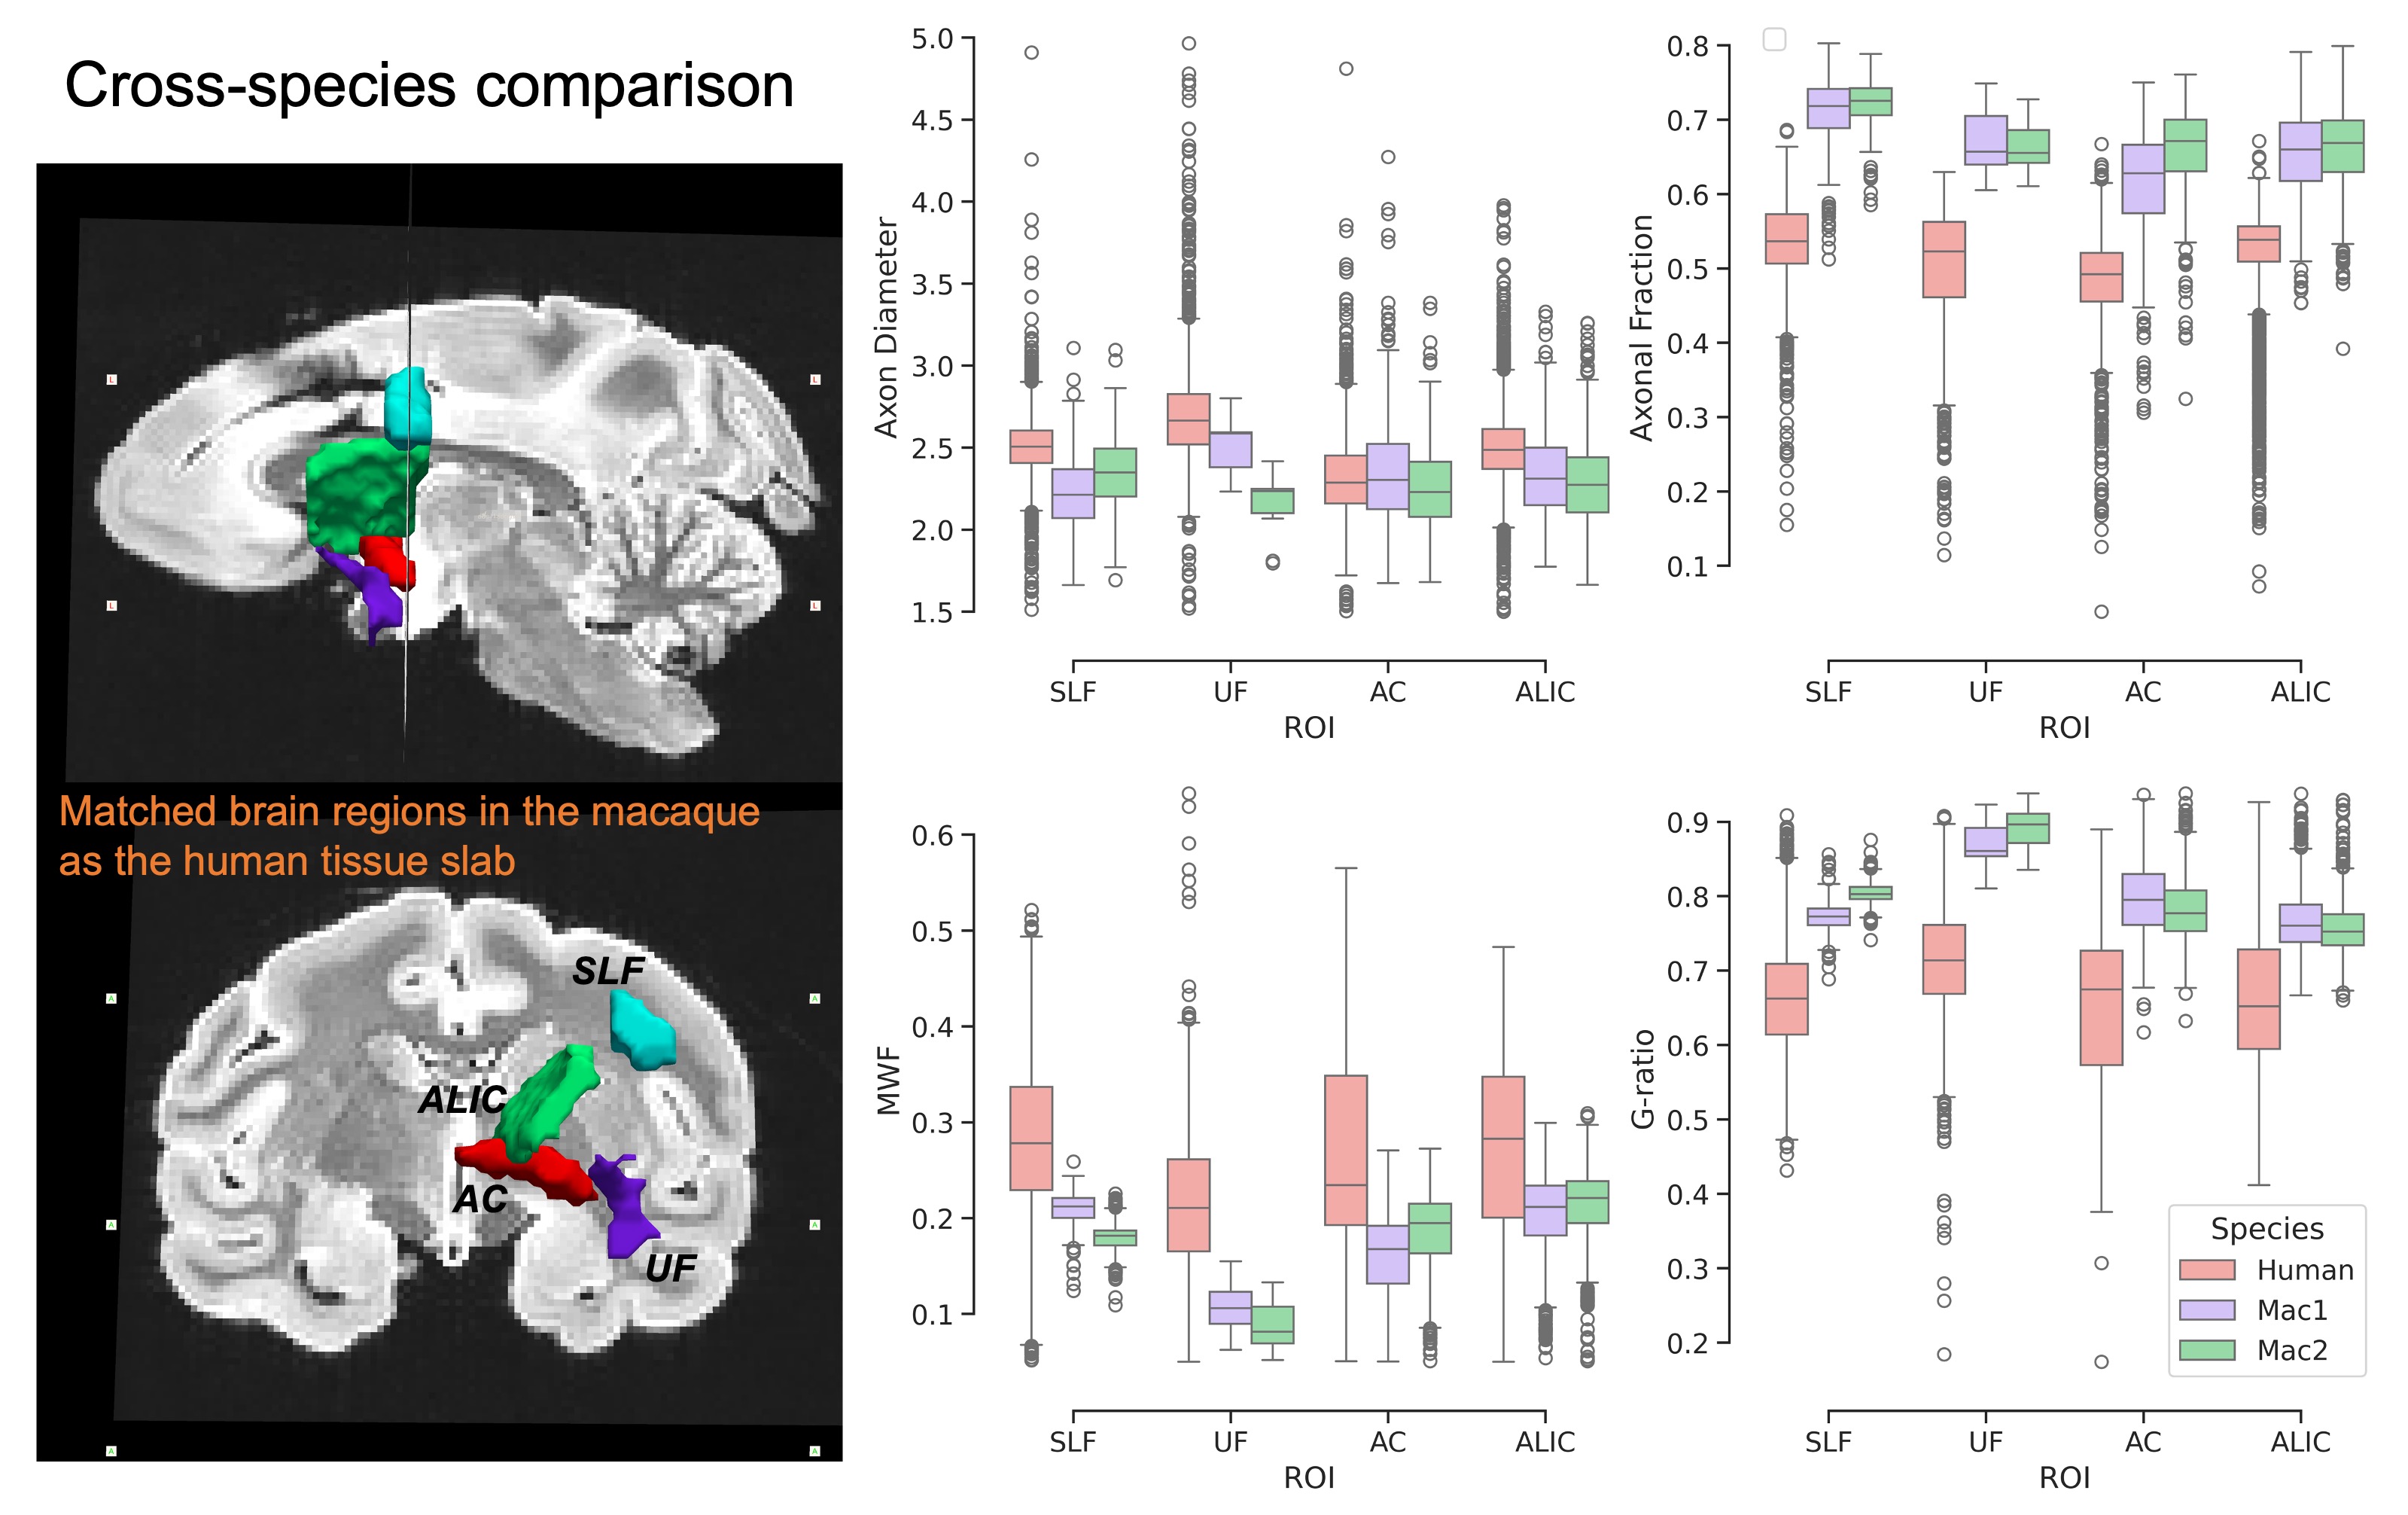
We demonstrate the high quality of fit of the four-compartment model (Figure 1). The variability of axon diameter, intra-axonal signal fraction, MWF and g-ratio are shown for the human tissue slab (Figure 2) and macaque brain sample (Figure 3). Variation of parameter estimates among WM regions is consistent between the human and macaque samples (Figure 4).Axon diameter is negatively correlated with intra-axonal signal fraction and MWF across tracts and species, such that smaller axons give rise to higher axonal density and myelin concentration. The intra-axonal signal fraction is correlated positively with MWF across tracts, while such correlations are inconsistent across voxels within a tract. The aggregate g-ratio is relatively stable and independent of axon diameter (Figure 5).
Discussions & Conclusion
Diffusion MRI can provide distinct estimates of axon diameter and axonal fraction, supported by consistent regional variability between species. The weak correlations between dMRI metrics and MWF suggest they can provide complementary information about fiber geometry.Acknowledgements
This work is supported by the National Institute of Neurological Disorders and Stroke (R01-NS119911), the National Institute of Mental Health (R01-MH045573, P50-MH106435), and the National Institute of Biomedical Imaging and Bioengineering (R01-EB021265, U01-EB026996).References
1. Waxman SG. Determinants of conduction velocity in myelinated nerve fibers. Muscle Nerve. 1980;3(2):141-150. doi:10.1002/MUS.880030207
2. Alexander DC, Hubbard PL, Hall MG, et al. Orientationally invariant indices of axon diameter and density from diffusion MRI. Neuroimage. 2010;52(4):1374-1389. doi:10.1016/j.neuroimage.2010.05.043
3. Zhang H, Hubbard PL, Parker GJM, Alexander DC. Axon diameter mapping in the presence of orientation dispersion with diffusion MRI. Neuroimage. 2011;56(3):1301-1315. doi:10.1016/j.neuroimage.2011.01.084
4. Fan Q, Nummenmaa A, Witzel T, et al. Axon diameter index estimation independent of fiber orientation distribution using high-gradient diffusion MRI. Neuroimage. 2020;222. doi:10.1016/j.neuroimage.2020.117197
5. Huang SY, Tian Q, Fan Q, et al. High-gradient diffusion MRI reveals distinct estimates of axon diameter index within different white matter tracts in the in vivo human brain. Brain Struct Funct. 2020;225(4):1277-1291. doi:10.1007/s00429-019-01961-2
6. Veraart J, Nunes D, Rudrapatna U, et al. Noninvasive quantification of axon radii using diffusion MRI. Elife. 2020;9. doi:10.7554/eLife.49855
7. Andersson M, Pizzolato M, Kjer HM, Skodborg KF, Lundell H, Dyrby TB. Does powder averaging remove dispersion bias in diffusion MRI diameter estimates within real 3D axonal architectures? Neuroimage. 2022;248. doi:10.1016/j.neuroimage.2021.118718
8. Paquola C, Hong SJ. The Potential of Myelin-Sensitive Imaging: Redefining Spatiotemporal Patterns of Myeloarchitecture. Biol Psychiatry. 2023;93(5):442-454. doi:10.1016/J.BIOPSYCH.2022.08.031
9. Mackay A, Whittall K, Adler J, Li D, Paty D, Graeb D. In vivo visualization of myelin water in brain by magnetic resonance. Magn Reson Med. 1994;31(6):673-677. doi:10.1002/MRM.1910310614
10. Stikov N, Campbell JSW, Stroh T, et al. In vivo histology of the myelin g-ratio with magnetic resonance imaging. Neuroimage. 2015;118(1):397-405. doi:10.1016/j.neuroimage.2015.05.023
11. Kroenke CD, Ackerman JJH, Yablonskiy DA. On the nature of the NAA diffusion attenuated MR signal in the central nervous system. Magn Reson Med. 2004;52(5):1052-1059. doi:10.1002/MRM.20260 12. Van Gelderen P, Des Pres D, Van Zijl PCM, Moonen CTW. Evaluation of Restricted Diffusion in Cylinders. Phosphocreatine in Rabbit Leg Muscle. J Magn Reson B. 1994;103(3):255-260. doi:10.1006/JMRB.1994.1038
13. Panagiotaki E, Schneider T, Siow B, Hall MG, Lythgoe MF, Alexander DC. Compartment models of the diffusion MR signal in brain white matter: A taxonomy and comparison. Neuroimage. 2012;59(3):2241-2254. doi:10.1016/j.neuroimage.2011.09.081
14. Doucette J, Kames C, Rauscher A. DECAES - DEcomposition and Component Analysis of Exponential Signals. Z Med Phys. 2020;30(4):271-278. doi:10.1016/J.ZEMEDI.2020.04.001
15. Prasloski T, Mädler B, Xiang QS, MacKay A, Jones C. Applications of stimulated echo correction to multicomponent T2 analysis. Magn Reson Med. 2012;67(6):1803-1814. doi:10.1002/MRM.23157
16. West KL, Kelm ND, Carson RP, Gochberg DF, Ess KC, Does MD. Myelin volume fraction imaging with MRI. Neuroimage. 2018;182:511-521. doi:10.1016/J.NEUROIMAGE.2016.12.067
17. Nilsson M, Lasič S, Drobnjak I, Topgaard D, Westin CF. Resolution limit of cylinder diameter estimation by diffusion MRI: The impact of gradient waveform and orientation dispersion. NMR Biomed. 2017;30(7). doi:10.1002/NBM.3711
18. Veraart J, Raven EP, Edwards LJ, Weiskopf N, Jones DK. The variability of MR axon radii estimates in the human white matter. Hum Brain Mapp. 2021;42(7):2201-2213. doi:10.1002/HBM.25359
19. Nedjati-Gilani GL, Schneider T, Hall MG, et al. Machine learning based compartment models with permeability for white matter microstructure imaging. Neuroimage. 2017;150:119-135. doi:10.1016/J.NEUROIMAGE.2017.02.013
Figures