2038
Development of numerical phantom converting from electron microscopic analysis to multi-component water fraction for MRI simulator.1Tokushima University, Tokushima, Japan
Synopsis
Keywords: White Matter, Simulations
Motivation: To improve the accuracy of myelin water fraction (MWF) calculations.
Goal(s): To develop multi-component phantom for MRI simulators and to validate the accuracy depending on pulse sequences and imaging parameter settings.
Approach: First, five different electron micrographs of the normal central nervous system (CNS) were divided into two regions (my and ax/ie), and the percentage of each component was calculated. Second, each proton density (PD) was set as a percentage of the divided area.
Results: We developed multi-component water phantom and could demonstrate the SPGR signal variations to B0 inhomogeneity on an MRI simulator using our multi-component water fraction phantom.
Impact: Our multi-component phantom derived from electron microscopic analysis may be useful to evaluate the differences in MWF values between each signal model, e.g., qMT and mcDESPOT.
INTRODUCTION
Myelin water fraction (MWF) is believed to be useful for demyelinating diseases such as multiple sclerosis and has recently attracted attention as a technique for quantifying myelin sheaths. MWF is calculated by constructing a T2 signal decay model of the central nervous system (CNS) consisting of three structural water pools (myelin sheath, axon, and intra/extracellular fluid) and determining the amplitude of each structural water using curve fitting [1]. In addition, some signal models have been reported, e.g., quantitative magnetization transfer (qMT) [2], multicomponent driven equilibrium single pulse observation of T1 and T2 (mcDESPOT) [3]. If developing a numerical phantom specifically for tissue structure analysis in which relaxation times are set for each nervous structure, it will be possible to verify the accuracy associated with pulse sequence selection and imaging parameter settings. The purpose of this study is to develop an MWF phantom derived from a microstructural photograph for an MRI simulator.METHODS
Figure 1 shows a schematic illustration of MWF numerical phantom. The structure of the phantom consists of two structural water pools: myelin sheath (my) and axon (ax) & intra/extracellular fluid (ie). Different five-electron microscopic photos of a normal CNS were divided into two areas (my and ax/ie), and the fractions of each component was calculated. A pixel of the numerical phantom filled five-microphotograph data of 10 µm size using a uniformly random distribution generator and was scaled until pixel size 1 mm. Each proton density (PD), i.e., amplitude was derived from the fraction of the divided regions. Relaxation times of my, ax/ie were set at T1 = 463, and 970 ms, T2 = 22 and 176 ms. The data was determined as normal white matter tissue and defined as true values. Next, the data acquisition was performed using an MRI simulator (Bloch Solver, MRI simulations) [4] on a personal computer equipped with a 3.7-GHz CPU (Intel Core i9-10970k; Intel, Santa Clara, Calif), 64-GB RAM, and a 10-GB GPU (GeForce RTX 3080; Nvidia, Santa Clara, Calif). The pulse sequence was used with the spoiled gradient-echo (SPGR) method to acquire images of a self-made numerical phantom. The imaging parameters were TR = 200 ms, TE = 6-192 ms (∆TE = 6 ms, 32 echoes), flip angle = 30 degrees, and matrix size = 256 × 256. The phantom signal values were obtained from a multi-echo dataset, and the amplitude was calculated using the T2 decay signal model. Then, we added different B0 inhomogeneities and investigated the amplitude fluctuations. MWF was calculated for all the acquired data and compared with the true value.RESULTS
Table 1 shows the determined T1, T2, and PD values of each component for the numerical phantom. Water fraction values of each component were my, 32%; ax/ie, 68%. Figure 2 shows the amplitude of each water pool and MWF maps derived from the SPGR signal on the MRI simulator. The MWF value calculated from the obtained eight-echo SPGR signal dataset was 33%. Figure 3 shows the amplitude of each water pool and MWF maps with additional 1000 Hz B0 inhomogeneities. Table2 shows the relationship between offset frequency of B0 inhomogeneity and MWF value. With B0 heterogeneity, the MWF value decreased to a maximum of 3%. Then, the amplitude values of each component decreased by 61% and 43%, respectively.DISCUSSION
We could demonstrate the SPGR signal variations to B0 inhomogeneity on an MRI simulator using our multi-component water fraction phantom. Our phantom may be useful to evaluate the differences in MWF values between each signal model, e.g., qMT and mcDESPOT.CONCLUSION
Multi-component phantom derived from electron microscopic analysis enables us to assess the MWF calculation accuracy involved in the pulse sequence.Acknowledgements
This study was partly supported by JSPS KAKENHI [grant number 23K07135].References
- MacKay A, Whittall K, Adler J, Li D, Paty D, Graeb D. In vivo visualization of myelin water in brain by magnetic resonance. Magn Reson Med 1994;31(6):673-677.
- Sled JG, Pike GB. Quantitative imaging of magnetization transfer exchange and relaxation properties in vivo using MRI. Magn Reson Med 2001;46(5):923-931.
- Deoni SC, Rutt BK, Arun T, Pierpaoli C, Jones DK. Gleaning multicomponent T1 and T2 information from steady-state imaging data. Magn Reson Med 2008;60(6):1372-1387.
- Kose R, Kose K. BlochSolver: A GPU-optimized fast 3D MRI simulator for experimentally compatible pulse sequences. J Magn Reson. 2017;281:51-65.
Figures
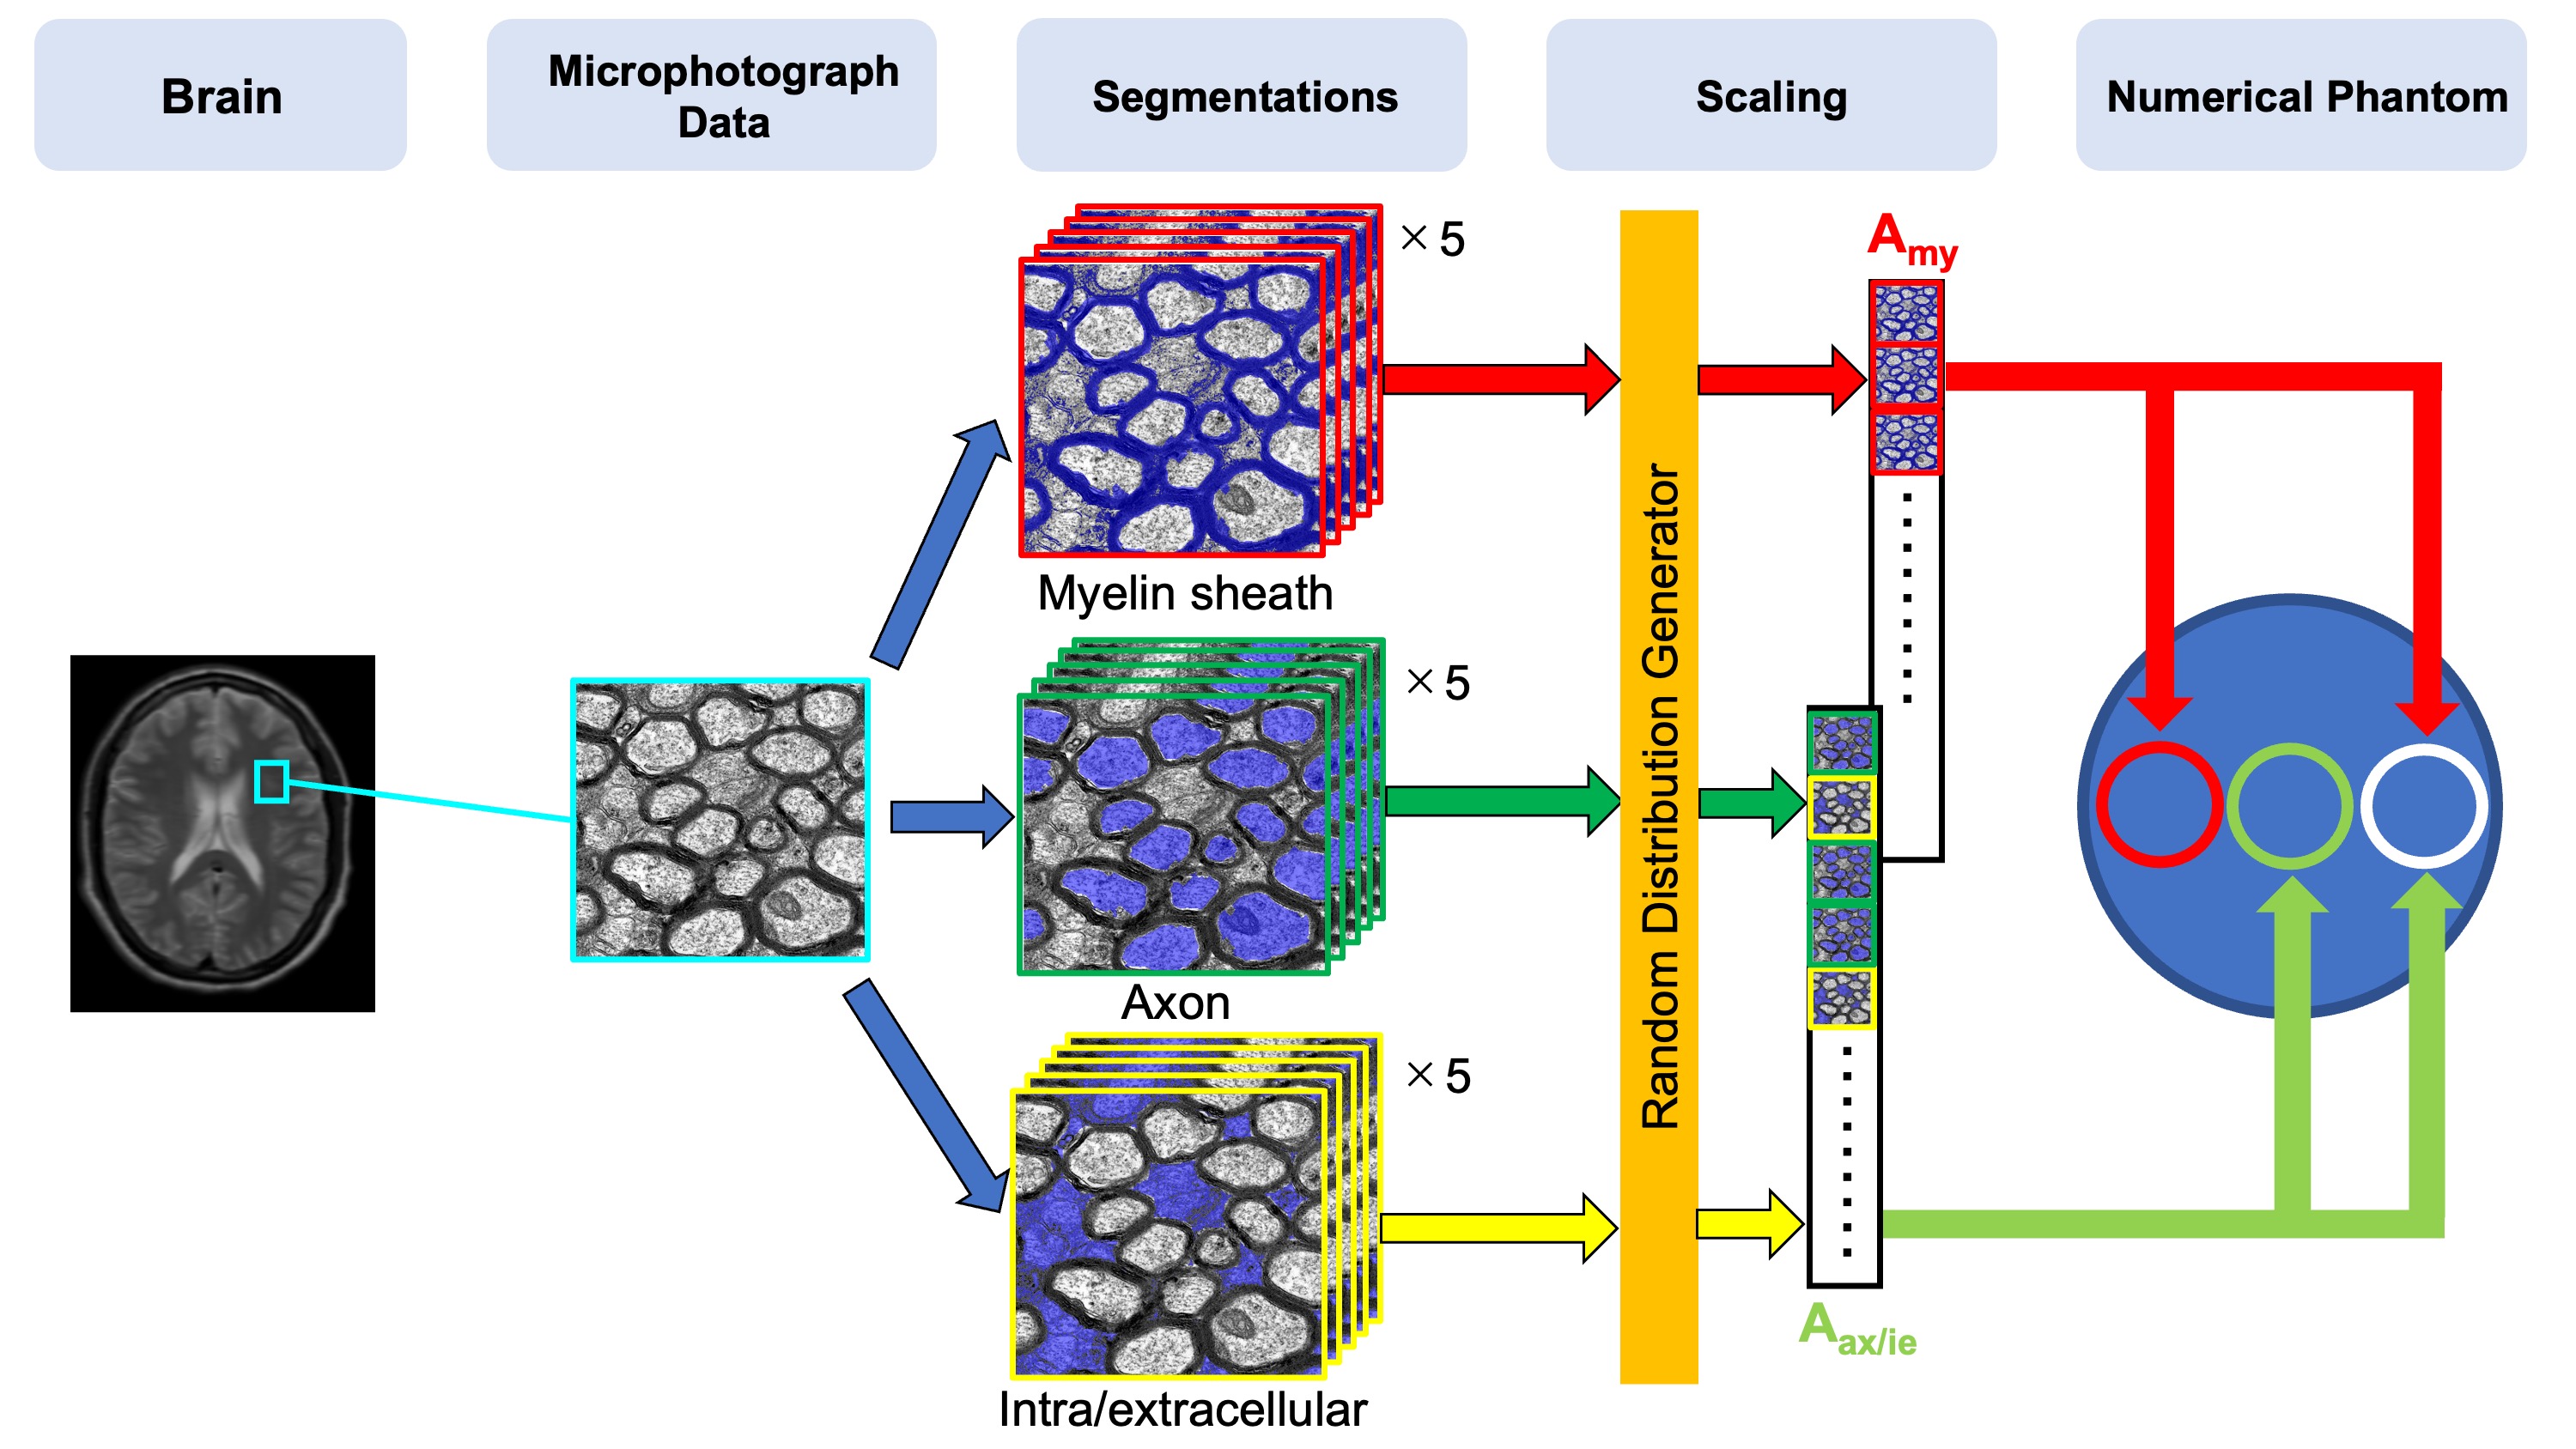
Figure 1 A schematic of illustration of generating process of multi-component water phantom derived from electron microscopic analysis.
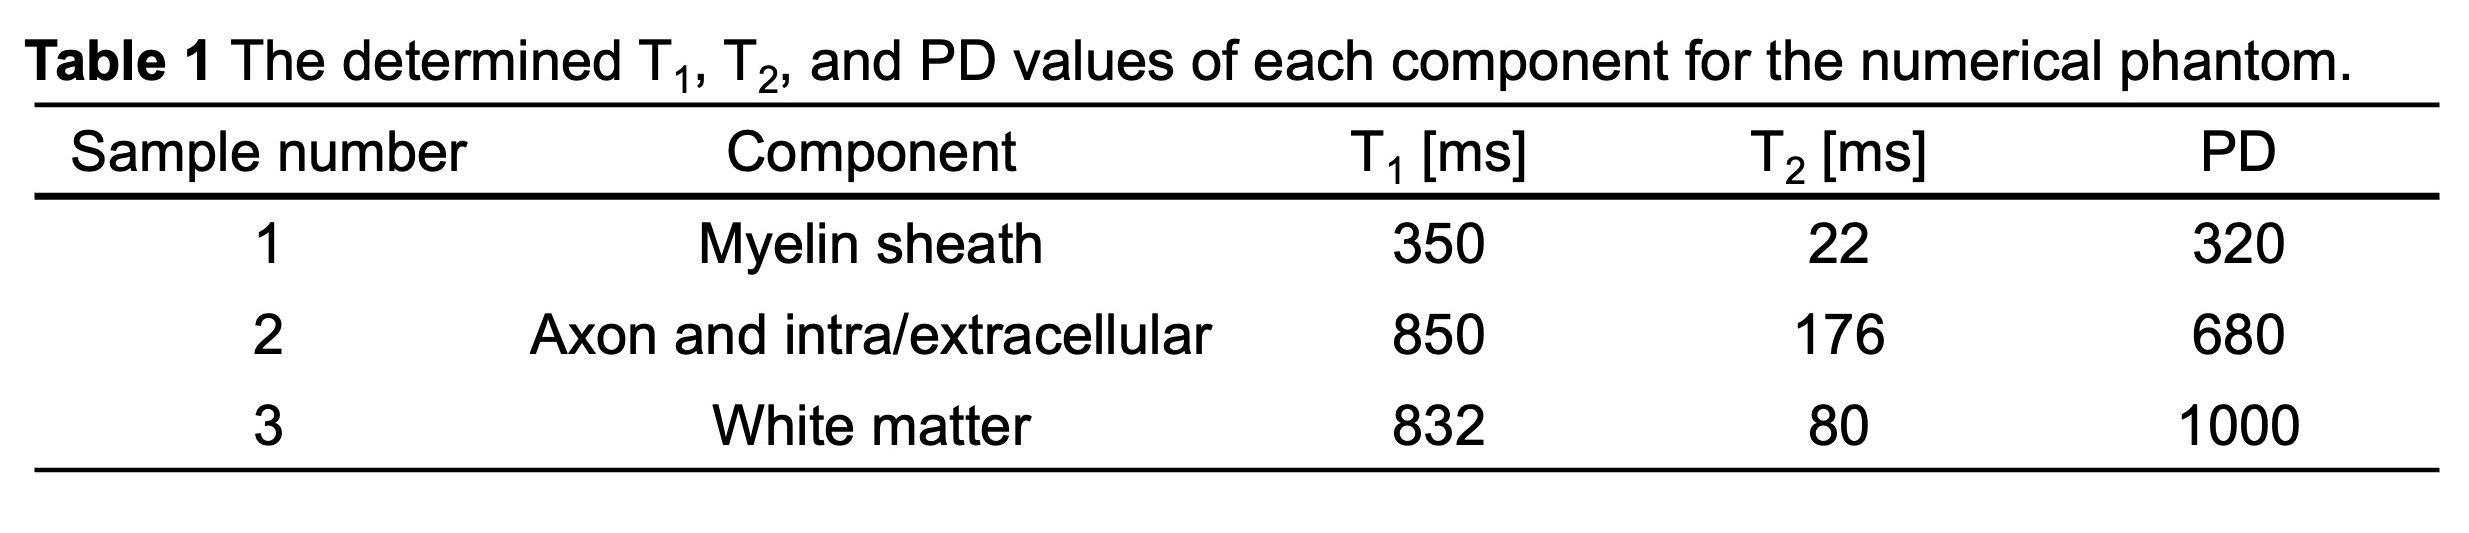
Table 1 The determined T1, T2, and PD values of each component for the numerical phantom.
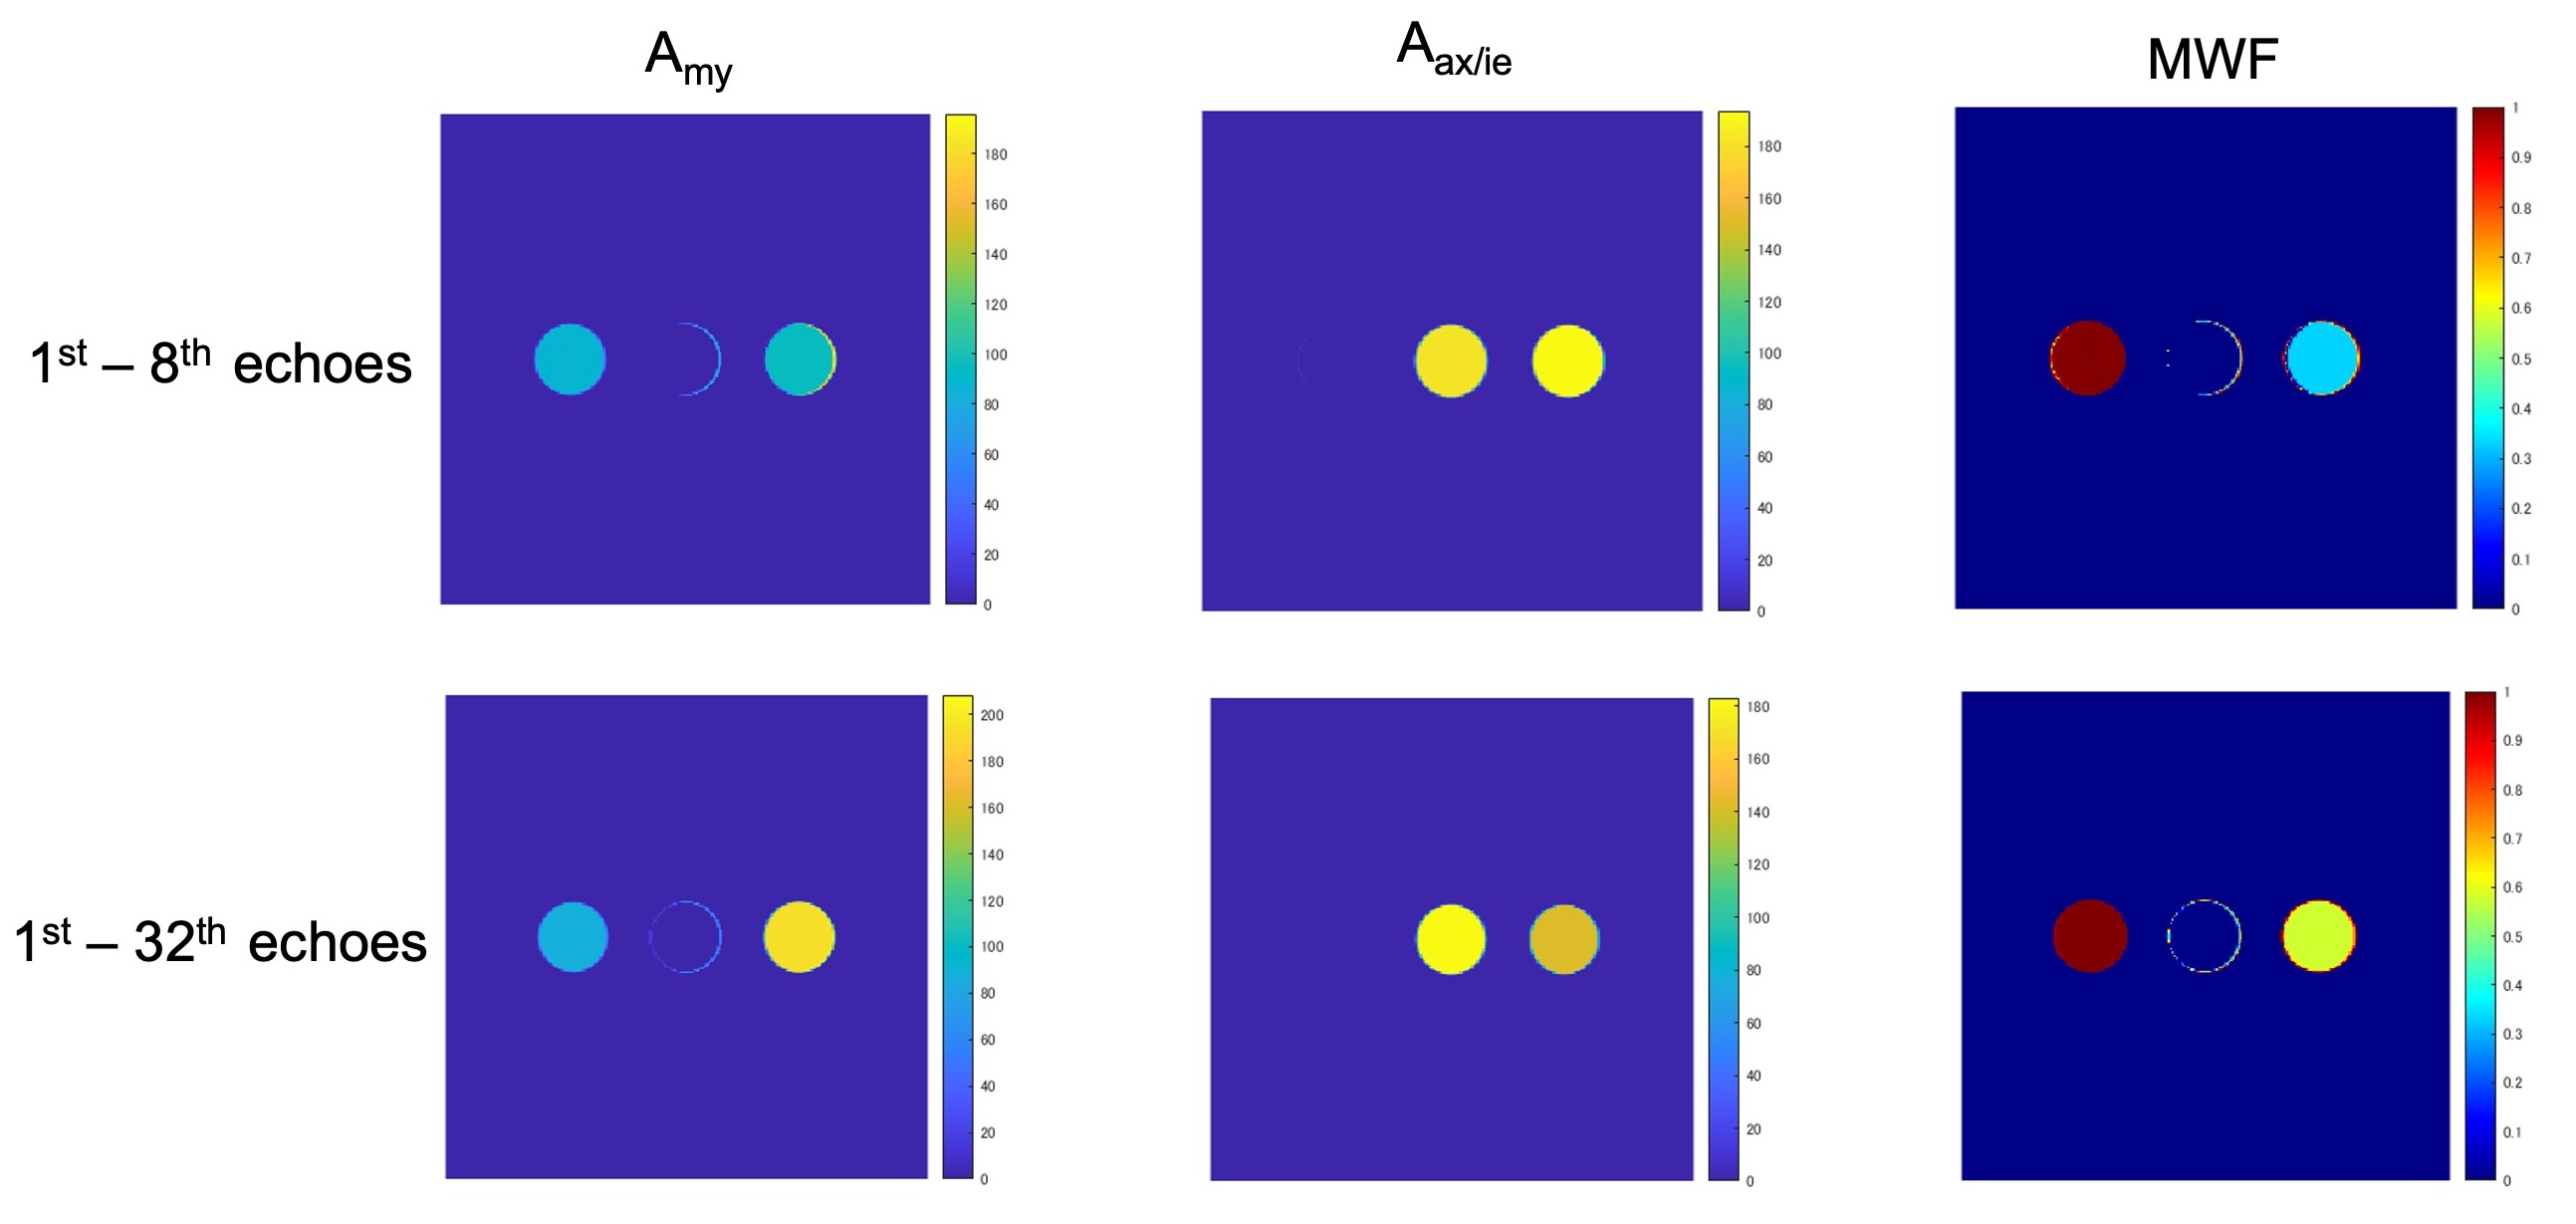
Figure 2 The amplitude of each water pool and MWF maps derived from the SPGR signal on the MRI simulator.
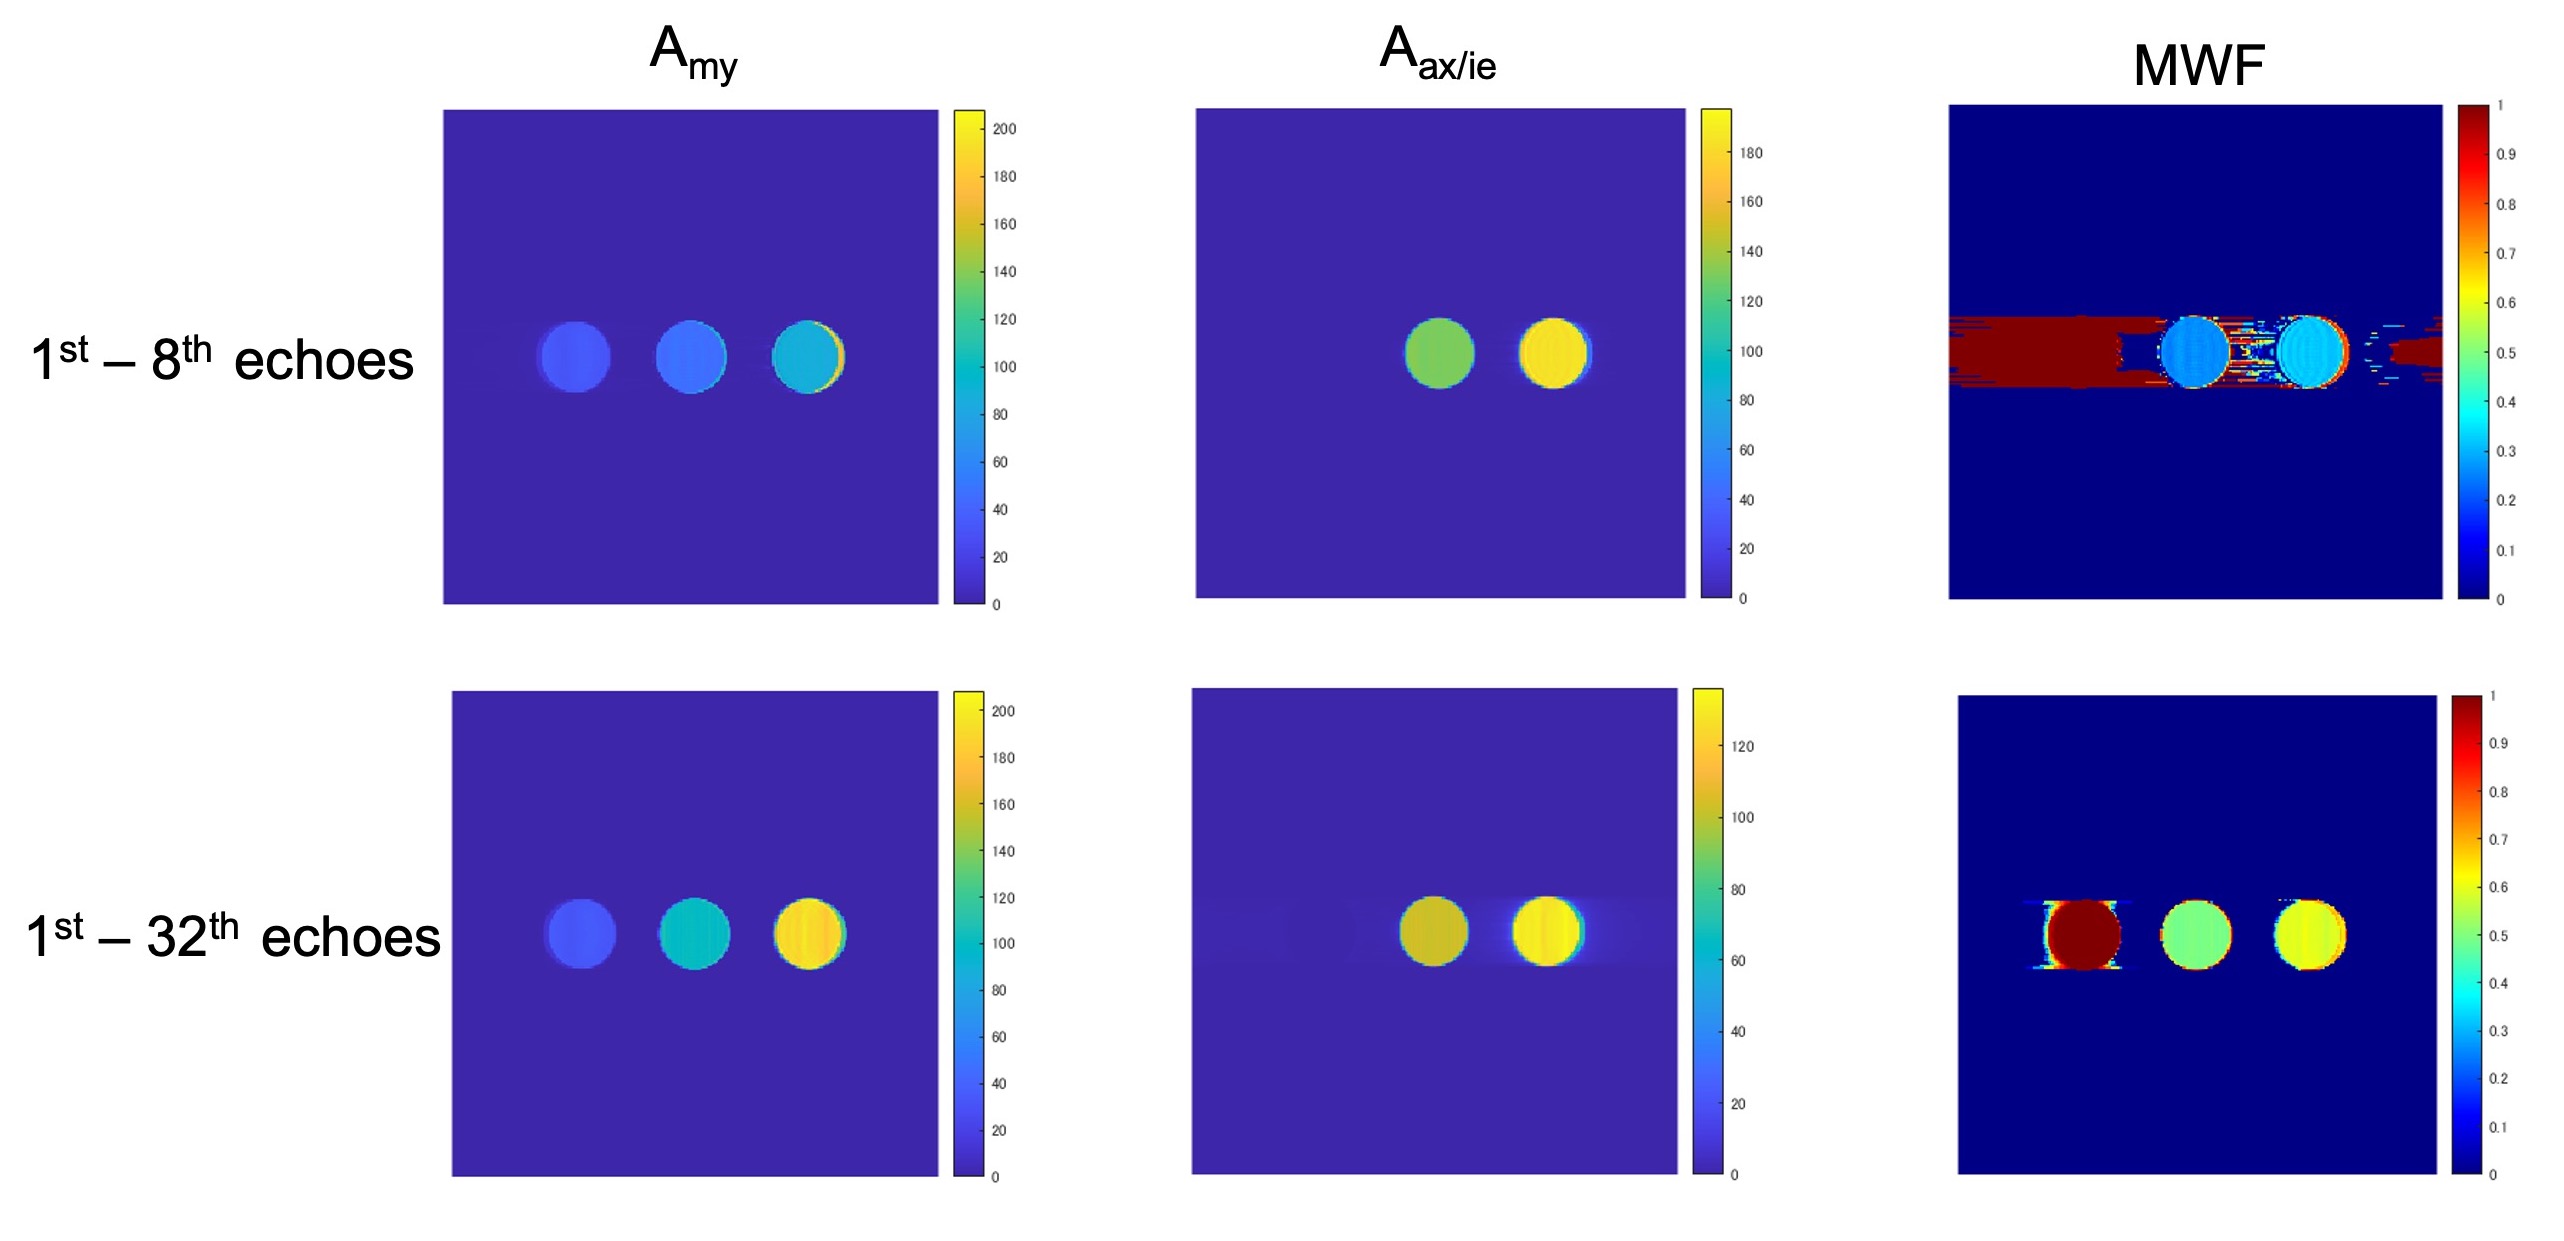
Figure 3 The amplitude of each water pool and each MWF maps with additional 1000 Hz B0 inhomogeneities.
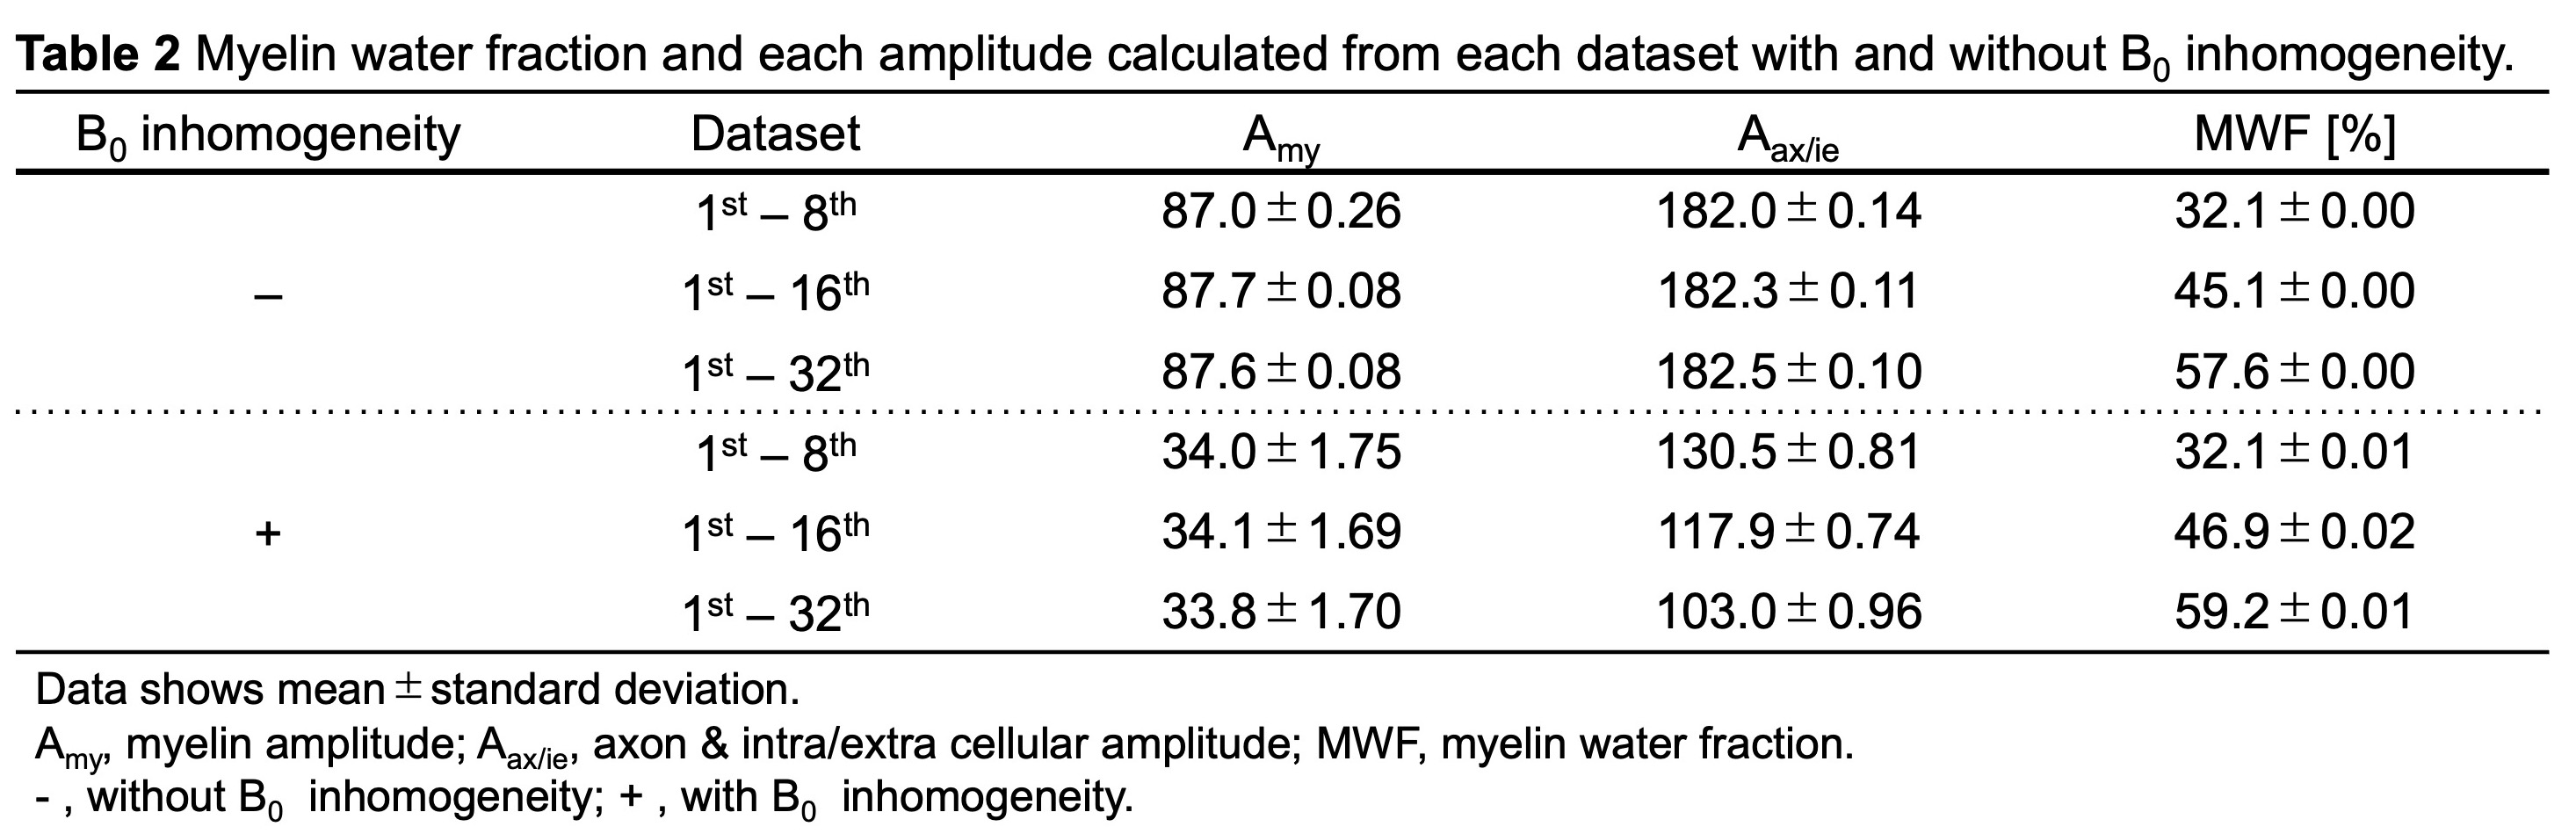
Table 2 The determined T1, T2, and PD values of each component for the numerical phantom.