2037
Application of B1+ corrected data-driven myelin water imaging for the diagnosis of multiple sclerosis pathology in normal appearing tissue1Department of Biomedical Engineering, Tel Aviv University, Tel Aviv, Israel, 2Department of Diagnostic Imaging, Sheba Medical Center, Ramat Gan, Israel, 3Sackler School of Medicine, Tel Aviv University, Tel Aviv, Israel, 4Sagol School of Neuroscience, Tel Aviv University, Tel Aviv, Israel, 5Center for Advanced Imaging Innovation and Research, New York University Langone Medical Center, New York, NY, United States
Synopsis
Keywords: White Matter, Quantitative Imaging, myelin water imaging, multicomponent analysis, multiple sclerosis, quantitative MRI, qMRI, white matter
Motivation: Multicomponent T2 (mcT2) analysis is the go-to tool for mapping myelin in vivo. Resolving T2 spectra, however, is highly challenging due to substantial ambiguity in the multidimensional space of microstructural configurations.
Goal(s): Accurate and reproducible myelin water imaging.
Approach: A spatially-global data-driven mcT2 analysis was employed, relying on the identification of tissue-specific mcT2 configurations prior to performing voxel-wise analysis. A new scheme was developed for correcting transmit field (B1+) inhomogeneities.
Results: Successful application of the data-driven technique is demonstrated on numerical phantom, healthy volunteers, and for identifying pathology in normal-appearing tissue of subjects with multiple sclerosis.
Impact: The data-driven approach constitutes a new paradigm for multi-component T2 fitting, yielding unprecedented accuracy and high robustness. Application on MS patients’ data highlights the potential of data-driven MWF values as a biomarker for pathology in normal appearing tissue.
Introduction
Multicomponent T2 (mcT2) analysis is the leading technique for mapping myelin content in the white matter (WM). The technique is based on calculating the relative fraction of water residing between the myelin sheaths, having relatively short T2 relaxation times (0-40 ms1,2) versus the intra/extra cellular water pools (≥ 40 ms). The derived myelin water fraction (MWF) provides a valuable biomarker for investigating neurodegenerative diseases3–5. Notwithstanding the high applicability of mcT2 fitting, the task of deconvolving T2 decay curves into a distribution of T2 values (i.e., T2 spectrum)6 poses substantial challenges due to its ill-posed nature and high sensitivity to noise7,8. A new, data-driven, approach for mcT2 analysis was recently developed, which relies on statistical analysis of the entire WM as a preprocessing step where a limited set of global mcT2 features are identified and then used as basis-elements for deconvolving the signals within each voxel9. Here, we extended the data-driven algorithm to correct for transmit field (B1+) inhomogeneities and validated its improved accuracy on a numerical phantom at different SNRs, and on healthy subjects and patients with MS.Methods
A full description of the data-driven mcT2 fitting algorithm can be found in Omer et al.9 .$$$B_{1}^{+}$$$ correction: A profile was calculated by solving the following minimization problem:
$$\newcommand{\di}{\unicode{x1d555}}$$ $$B_{1,n+1}^+(j)=\underset{B_{1}^+}{\operatorname{argmin}}\left[\left \|\di(B_{1}^{+})-s_{j} \right \|_{2}+\frac{\mu}{\left |\mathcal{N}_{k} \right |}\sum_{r\in \mathcal{N}_{k}} \left |B_{1}^+-B_{1,n}^+(r) \right |\right] \hspace{5cm} (1) $$
Here, $$$\di(B_{1}^{+})$$$ is a dictionary of simulated mcT2 signals, $$$ s_{j}$$$ is the experimental voxel signal, $$$B_{1}^{+}=80...120\%$$$ represents the transmit field profile (where 100% signifies a fully homogeneous field), $$$\mu$$$ represents a regularization weight, $$$\mathcal{N}_{k}$$$ denotes all voxels within the 2D kernel surrounding voxel $$$ s_{j}$$$, and $$$\left |\mathcal{N}_{k}\right |$$$ is the number of voxels in $$$\mathcal{N}_{k}$$$. The problem is solved for all WM voxels iteratively until convergence.
The output $$$B_{1,opt}^{+}$$$ map is used to correct the signal $$$ s_{j}$$$ in each voxel by multiplying its signal by the ratio between an mcT2 motif corresponding to a homogenous field $$$(B_{1}^{+}=100\%)$$$ and the mcT2 motif corresponding to the calculate value $$$B_{1,opt}^{+}$$$ yielding:
$$s_{j,corrected}(t)=s_{j}(t)\cdot\frac{\di(B_{1}^{+}=100\%,t)}{\di(B_{1,opt}^{+},t)}\hspace{10cm} (2) $$
Numerical phantom: 2D MESE simulations were performed on a Shepp-Logan phantom, using NEchoes=11, TE/TR=12/4600 ms, bandwidth=200 Hz/Px, and SNRs=50-500.
In-vivo scans: Twenty-six healthy subjects (39.2±5.5 y/o, 15 males) were scanned on a 3T Prisma MRI scanner (Siemens Healthineers), under IRB approval 3933-17-SMC. Scans used a 2D MESE protocol with TE/TR=12/5000 ms, FOV=192x156 mm2, matrix size=192x156, slice thickness=3 mm, bandwidth=200 Hz/pixel, NEchoes=12, Nslices=32, and Tacq=7:35 min. Twenty-nine relapsing-remitting MS patients (44.2±11.8 y/o, 9 males), were scanned under IRB approval (6923-20-SMC), using a similar protocol.
mcT2 fitting: Data-driven analysis was performed according to Omer et al.9 using an mcT2 dictionary constructed from 200 single-T2 elements logarithmically spaced between 10-800 ms, fraction resolution of 0.05, and Tikhonov and L1 regularizations of $$$ \lambda_{Tikh}=0.001$$$ and $$$\lambda_{L1}=0.01$$$.
Statistical analysis: MWF values were calculated for six 2D normal appearing WM (NAWM) regions and used to classify MS patients vs. healthy controls, followed by calculating Receiver operating characteristics (ROC) curve and its area under the curve (AUC) for each region.
Results
Numerical phantom results are shown in Figure 1. Mean absolute errors of 0.2-1.8% were produced for SNRs of 500-50 respectively. Calculated $$$B_{1}^{+}$$$ bias field showed high correlation to ground truth values with mean absolute errors of 0.1-5.5% for SNRs 500-50 respectively.T2-weighted images, T2 maps, MWF maps, and segmented regions are shown in Figure 2 for three representative healthy volunteers. Only a minor correlation exists between the MWF and T2 values, i.e., higher MWF values do not necessarily correspond to lower T2 values, as can be clearly seen in the GCC and SCC.
FLAIR images, T2 maps, and MWF maps are shown in Figure 3 for three representative MS patients. These results highlight the advantage of qMRI, which is able to reveal subtle changes within NAWM suggestive of inflammation and demyelination processes that are not visible in the qualitative FLAIR images.
In Figure 4, Box plots of the extracted MWF values are illustrated for every ROI, along with ROC classification curves. The data-driven analysis produced significant differences (P-value<0.0001) in mean MWF between healthy subjects and MS patients, alongside consistently high AUC across all ROIs, and a relative reduction in MWF ranging from 20% to 38%.
Discussion and conclusion
This work presents improved data-driven MWF mapping using a new B1+ correction scheme. It showcases the power of identifying a global set of tissue-specific features, which decreases mcT2 fitting ambiguity and produces more accurate MWF values. The notable change in MWF values in NAWM highlights the potential of this metric as a valuable biomarker for demyelination.Acknowledgements
No acknowledgement found.References
1. Alonso-Ortiz E, Levesque IR, Pike GB. MRI-based myelin water imaging: A technical review. Magn Reson Med. 2015;73(1):70-81. doi:10.1002/MRM.25198
2.MacKay AL, Laule C. Magnetic Resonance of Myelin Water: An in vivo Marker for Myelin. Brain Plasticity. 2016;2(1):71-91. doi:10.3233/bpl-160033
3.Laule C, Vavasour IM, Moore GRW, et al. Water content and myelin water fraction in multiple sclerosis: A T 2 relaxation study. J Neurol. 2004;251(3):284-293. doi:10.1007/s00415-004-0306-6
4. Lim SH, Lee J, Jung S, et al. Myelin-Weighted Imaging Presents Reduced Apparent Myelin Water in Patients with Alzheimer’s Disease. Diagnostics. 2022;12(2). doi:10.3390/diagnostics12020446
5.Dean DC, Sojkova J, Hurley S, et al. Alterations of myelin content in Parkinson’s disease:a cross-sectional neuroimaging study. PLoS One. 2016;11(10). doi:10.1371/journal.pone.0163774
6. Whittall KP, MacKay AL. Quantitative interpretation of NMR relaxation data. Journal of Magnetic Resonance (1969). 1989;84(1):134-152. doi:10.1016/0022-2364(89)90011-5
7. Graham SJ, Stanchev PL, Bronskill MJ. Criteria for analysis of multicomponent tissue T2 relaxation data. Magn Reson Med. 1996;35(3):370-378. doi:10.1002/mrm.1910350315
8. Does MD. Inferring brain tissue composition and microstructure via MR relaxometry. Neuroimage. 2018;182:136-148. doi:10.1016/j.neuroimage.2017.12.087
9. Omer N, Galun M, Stern N, Blumenfeld-Katzir T, Ben-Eliezer N. Data-driven algorithm for myelin water imaging: Probing subvoxel compartmentation based on identification of spatially global tissue features. Magn Reson Med. 2022;87(5):2521-2535. doi:10.1002/MRM.29125
Figures
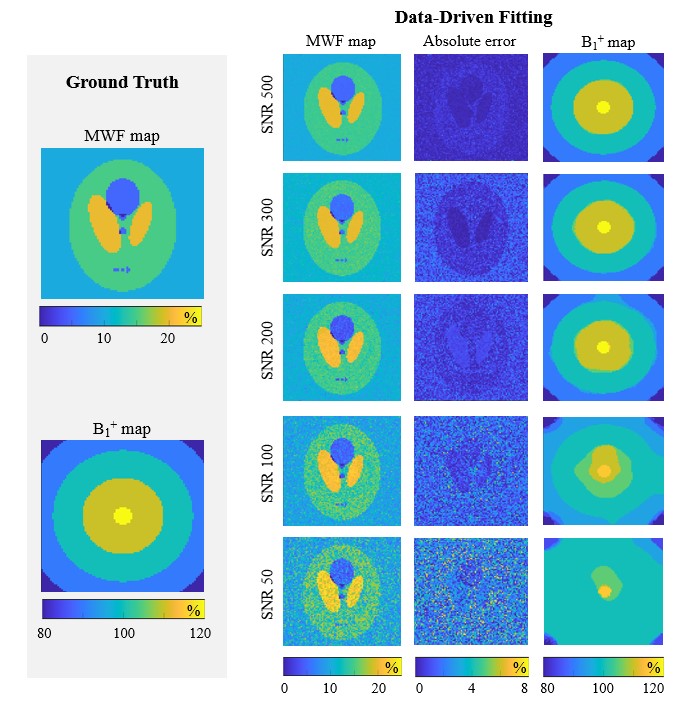
Figure 1: MWF mapping in a numerical phantom. Ground truth MWF and B1+ maps are presented in the left panel. Right panels illustrate the performance of the data-driven fitting approach at different SNRs. Second-fourth columns contain fitted MWF maps, absolute error maps, and reconstructed B1+ profiles, respectively. Mean absolute error of 0.2, 0.5, 0.7, 1.2, 1.8 % was found in MWF values and 0.1, 0.1, 0.4, 2.8, 5.5 % in B1+ values for SNRs of 500, 300, 200, 100, and 50, respectively.
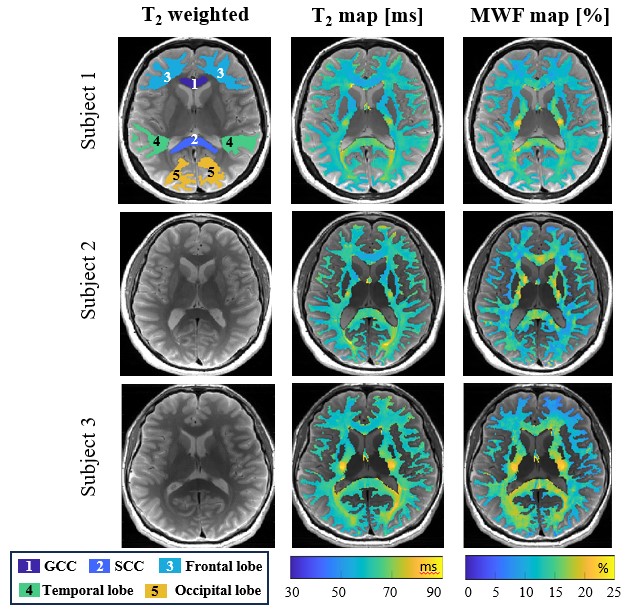
Figure 2: T2 weighted images, T2 maps, and MWF maps for three healthy subjects using the data-driven fitting. Representative masks of five manually-segmented regions of interest (ROIs) are shown in the top left panel
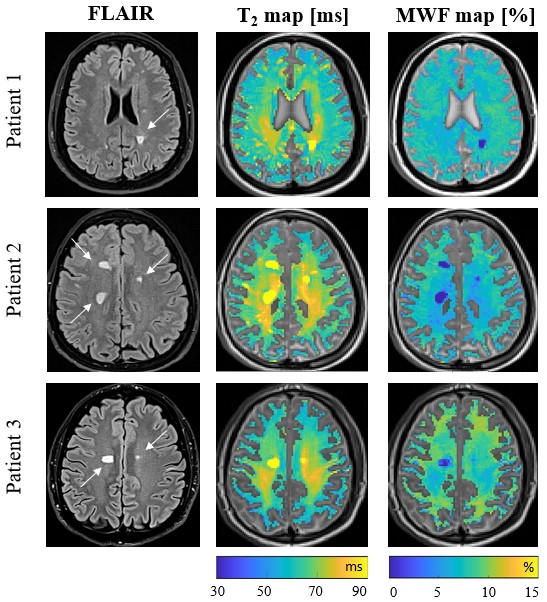
Figure 3: FLAIR images, T2 maps and MWF maps for three patients with MS, produced using the data-driven fitting algorithm. White arrows indicate inflammatory demyelinating lesions.
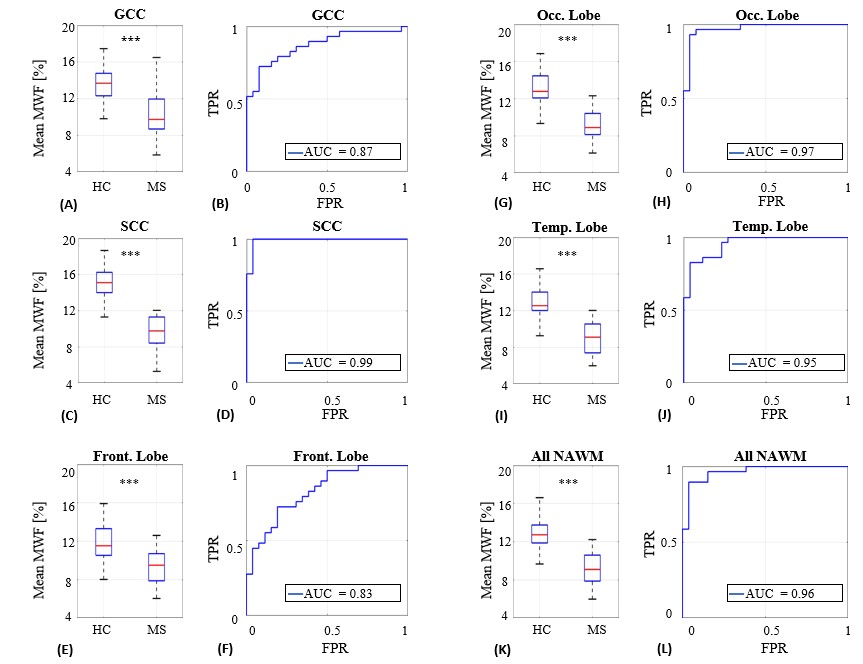
Figure 4: Box plots of MWF values for six WM ROIs for healthy controls (HC) and MS patients, generated using the data-driven algorithm. Statistically significant separation is achieved between the two groups, for all ROIs (***p-value < 0.0001) after correcting for multiple comparisons. ROC curves are shown on the 2nd and 4th columns, calculated based on mean MWF values in NAWM (i.e., excluding lesions). (A-B) Genu of corpus callosum (GCC). (C-D) Splenium of corpus callosum (SCC). (E-F) Frontal (Front.) lobe. (G-H) Occipital (Occ.) lobe. (I-J) Temporal (Temp.) lobe. (K-L) All NAWM.