2036
Characterizing Tissue Relaxation and Magnetization Transfer in Fresh, Thawed, and Fixed White Matter Tissue Samples1Electrical Engineering and Computer Science, University of Michigan, Ann Arbor, MI, United States, 2Radiology, University of Michigan, Ann Arbor, MI, United States, 3Mechanical Engineering, University of Michigan, Ann Arbor, MI, United States, 4Biomedical Engineering, University of Michigan, Ann Arbor, MI, United States, 5Neurology, University of Michigan, Ann Arbor, MI, United States
Synopsis
Keywords: White Matter, White Matter
Motivation: Studying ex vivo tissue requires preservation by formalin-fixation or freezing. Effects of these methods on tissue parameters compared to fresh tissue is unknown.
Goal(s): We investigated how freezing/thawing and fixation affect T1, T2, and MT properties in brain tissue. We created a protocol to apply MR methods (T2-MESE, biexponential T1, qMT, ihMT, NODDI) to pathology specimens in the Michigan Alzheimer’s Disease Research Center (MADRC) repository.
Approach: We scanned the same ex vivo sheep brain samples fresh, frozen/thawed, and fixed, and compared their relaxation and MT properties.
Results: Effects of fixation are most prominent in white matter and especially influence T1 and T2 relaxation.
Impact: Thawed tissue exhibits more similar relaxation and MT properties to fresh tissue than fixed tissue does. In MR studies that use ex vivo tissue samples, such as those correlating MR to histology, thawed tissue may be preferable to formalin-fixed.
Introduction
MR techniques sensitive to myelin content and relaxation properties are used in the in vivo study of white matter (WM) pathology. Although many MR methods like T2 multi-echo spin-echo (T2-MESE), quantitative magnetization transfer (qMT), T1 and NODDI are sensitive to myelin content and pathology, the correspondence between pathological and MR signal changes are unknown. To study the pathological underpinnings of MR signal changes in disease, investigators often use post-mortem formalin-fixed tissue to correlate the MR findings with histological measures1-4. Formalin fixing of tissue, however, can alter the physicochemical and relaxation properties of myelin. Freezing at -80°C also preserves post-mortem tissue, but ice crystals may affect tissue integrity. Our research study will scan ex vivo post-mortem tissue samples from the Michigan Alzheimer’s Disease Research Center (MADRC). To choose between frozen or fixed tissue available in the brain bank, we investigated effects of freezing/thawing and of formalin fixation on the T1, T2, and MT properties of ex vivo sheep brain tissue samples.Methods
Tissue was dissected and placed in histology cassettes to immobilize and enable fixation after MR acquisition. Each cassette was submerged in Fluorinert FC-770 (3M, St. Paul, MN) to minimize B0 field inhomogeneity and inserted into the 7T MRI (Varian/Agilent) for MR studies at ~15°C. T2 data were collected via a MESE scan with two averages (TR/echo spacing=4000/5 ms; matrix size 128×128). T1 IR data were collected with spin-echo EPI readout at 21 TI times (TR/TE=8000/36 ms; matrix size 64×64). Five slices were acquired with thickness 2mm, FOV 35mm, and in-plane resolution 273 × 273 microns. Single-slice MT data were collected with a gradient echo scan (TR/TE=120/3 ms; matrix size 128×128). Following fresh sample data collection, the cassettes were placed in a -80°C freezer to replicate the MADRC protocol. After three weeks the samples were thawed for 48 hours, scanned with the above protocol, placed in formalin for 36 hours for fixation, washed in normal saline solution for 12 hours, and scanned again. MESE data were analyzed with non-negative least squares (NNLS) regression using the extended phase graph formalism to estimate a T2 spectrum for each voxel5. A biexponential fit was performed on the IR data to calculate the fast/slow relaxing eigenvalues6. A nonlinear parametric fit using a standard MT model was performed to estimate qMT parameters7,8. We repeated these steps for six samples, and show representative results for one.Results
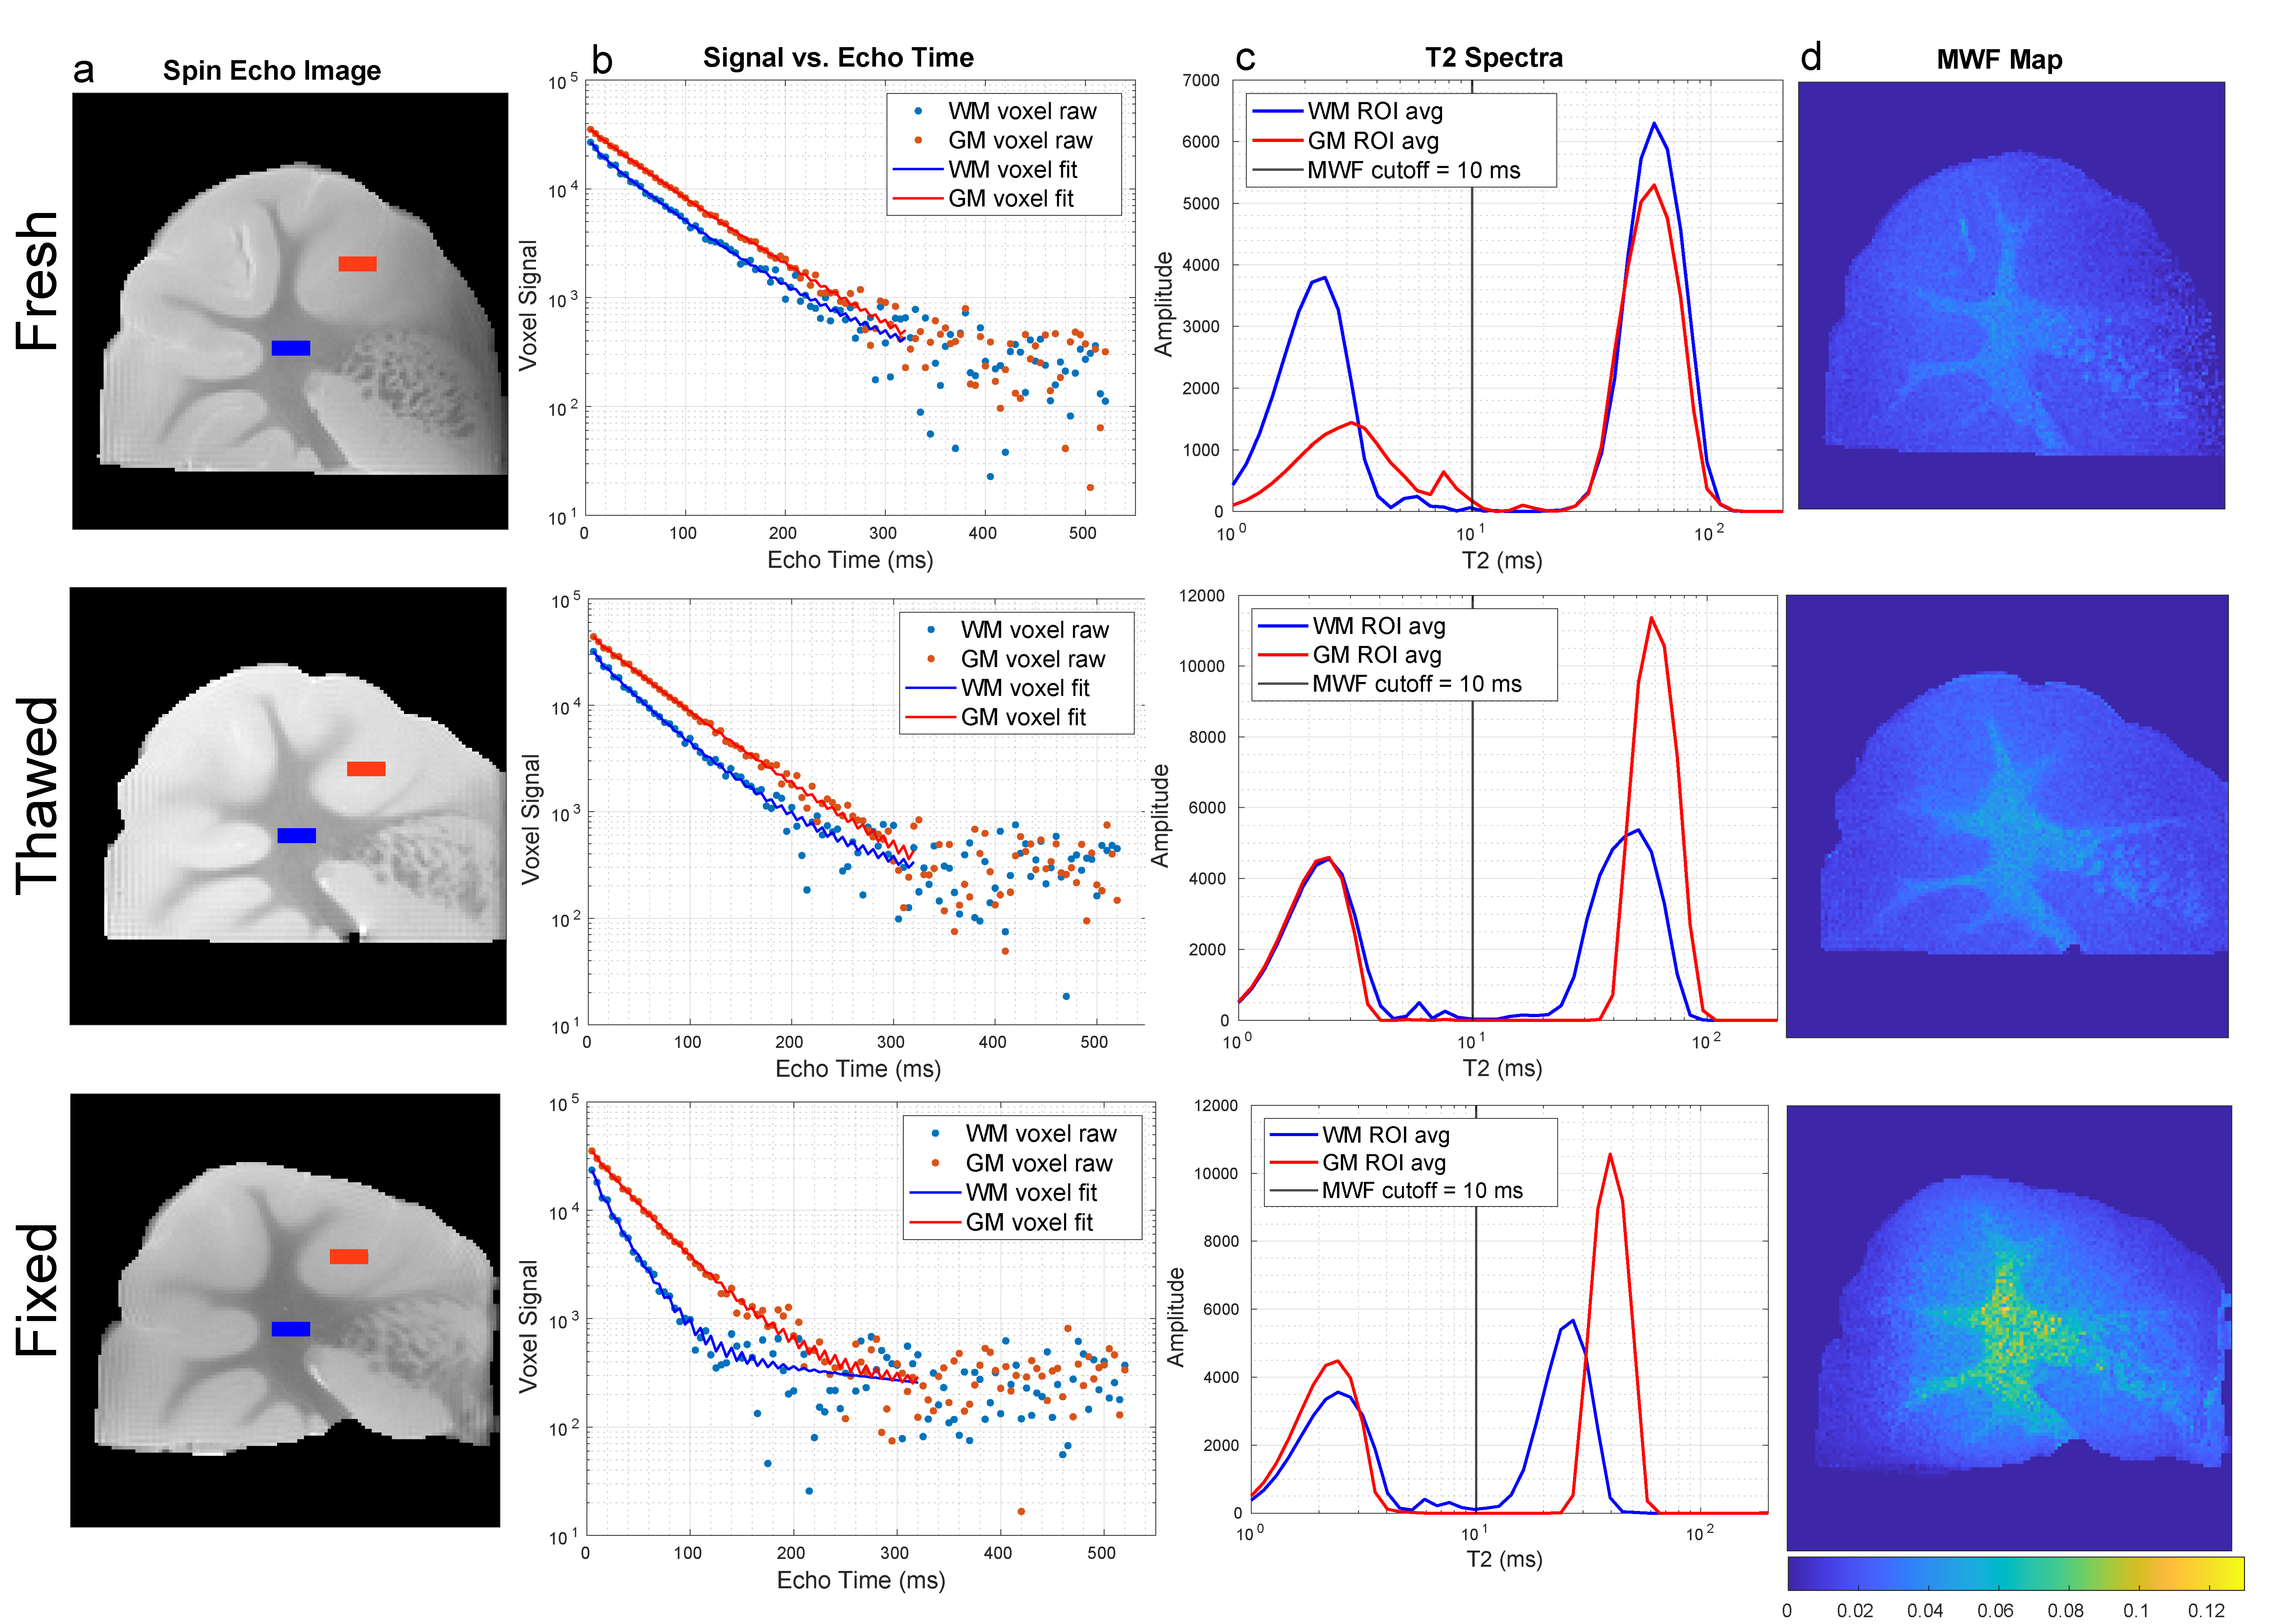
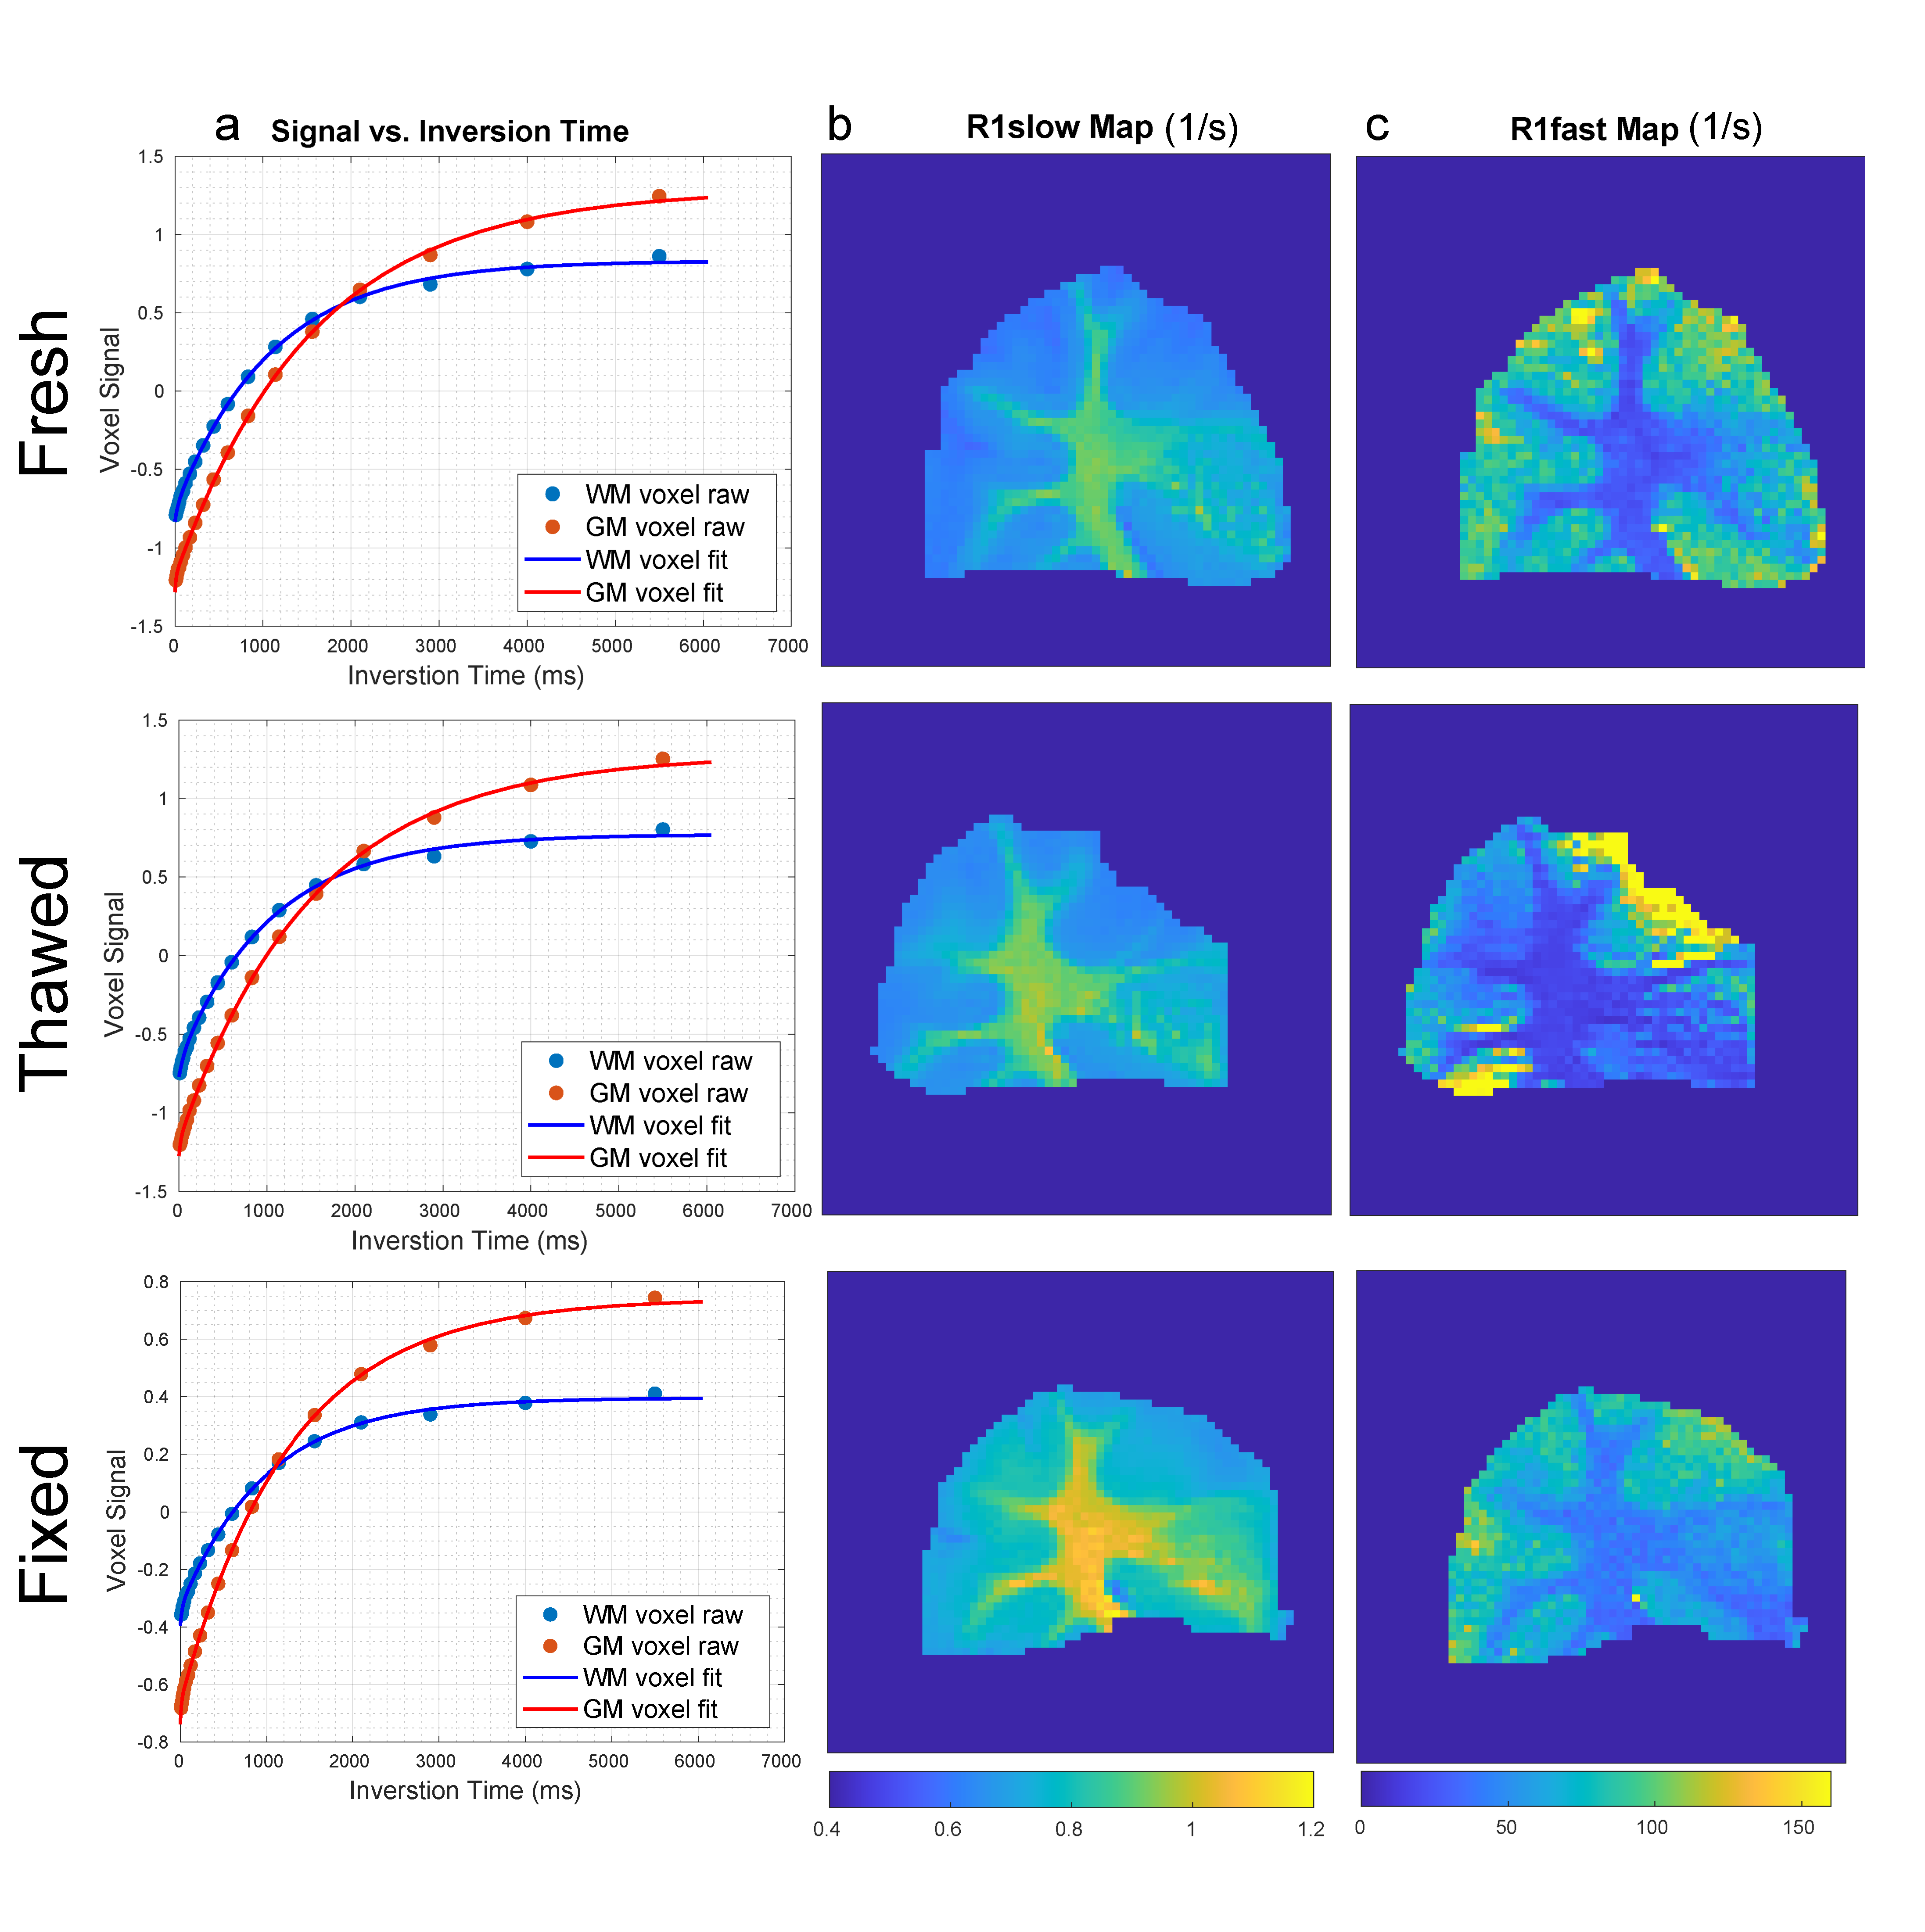
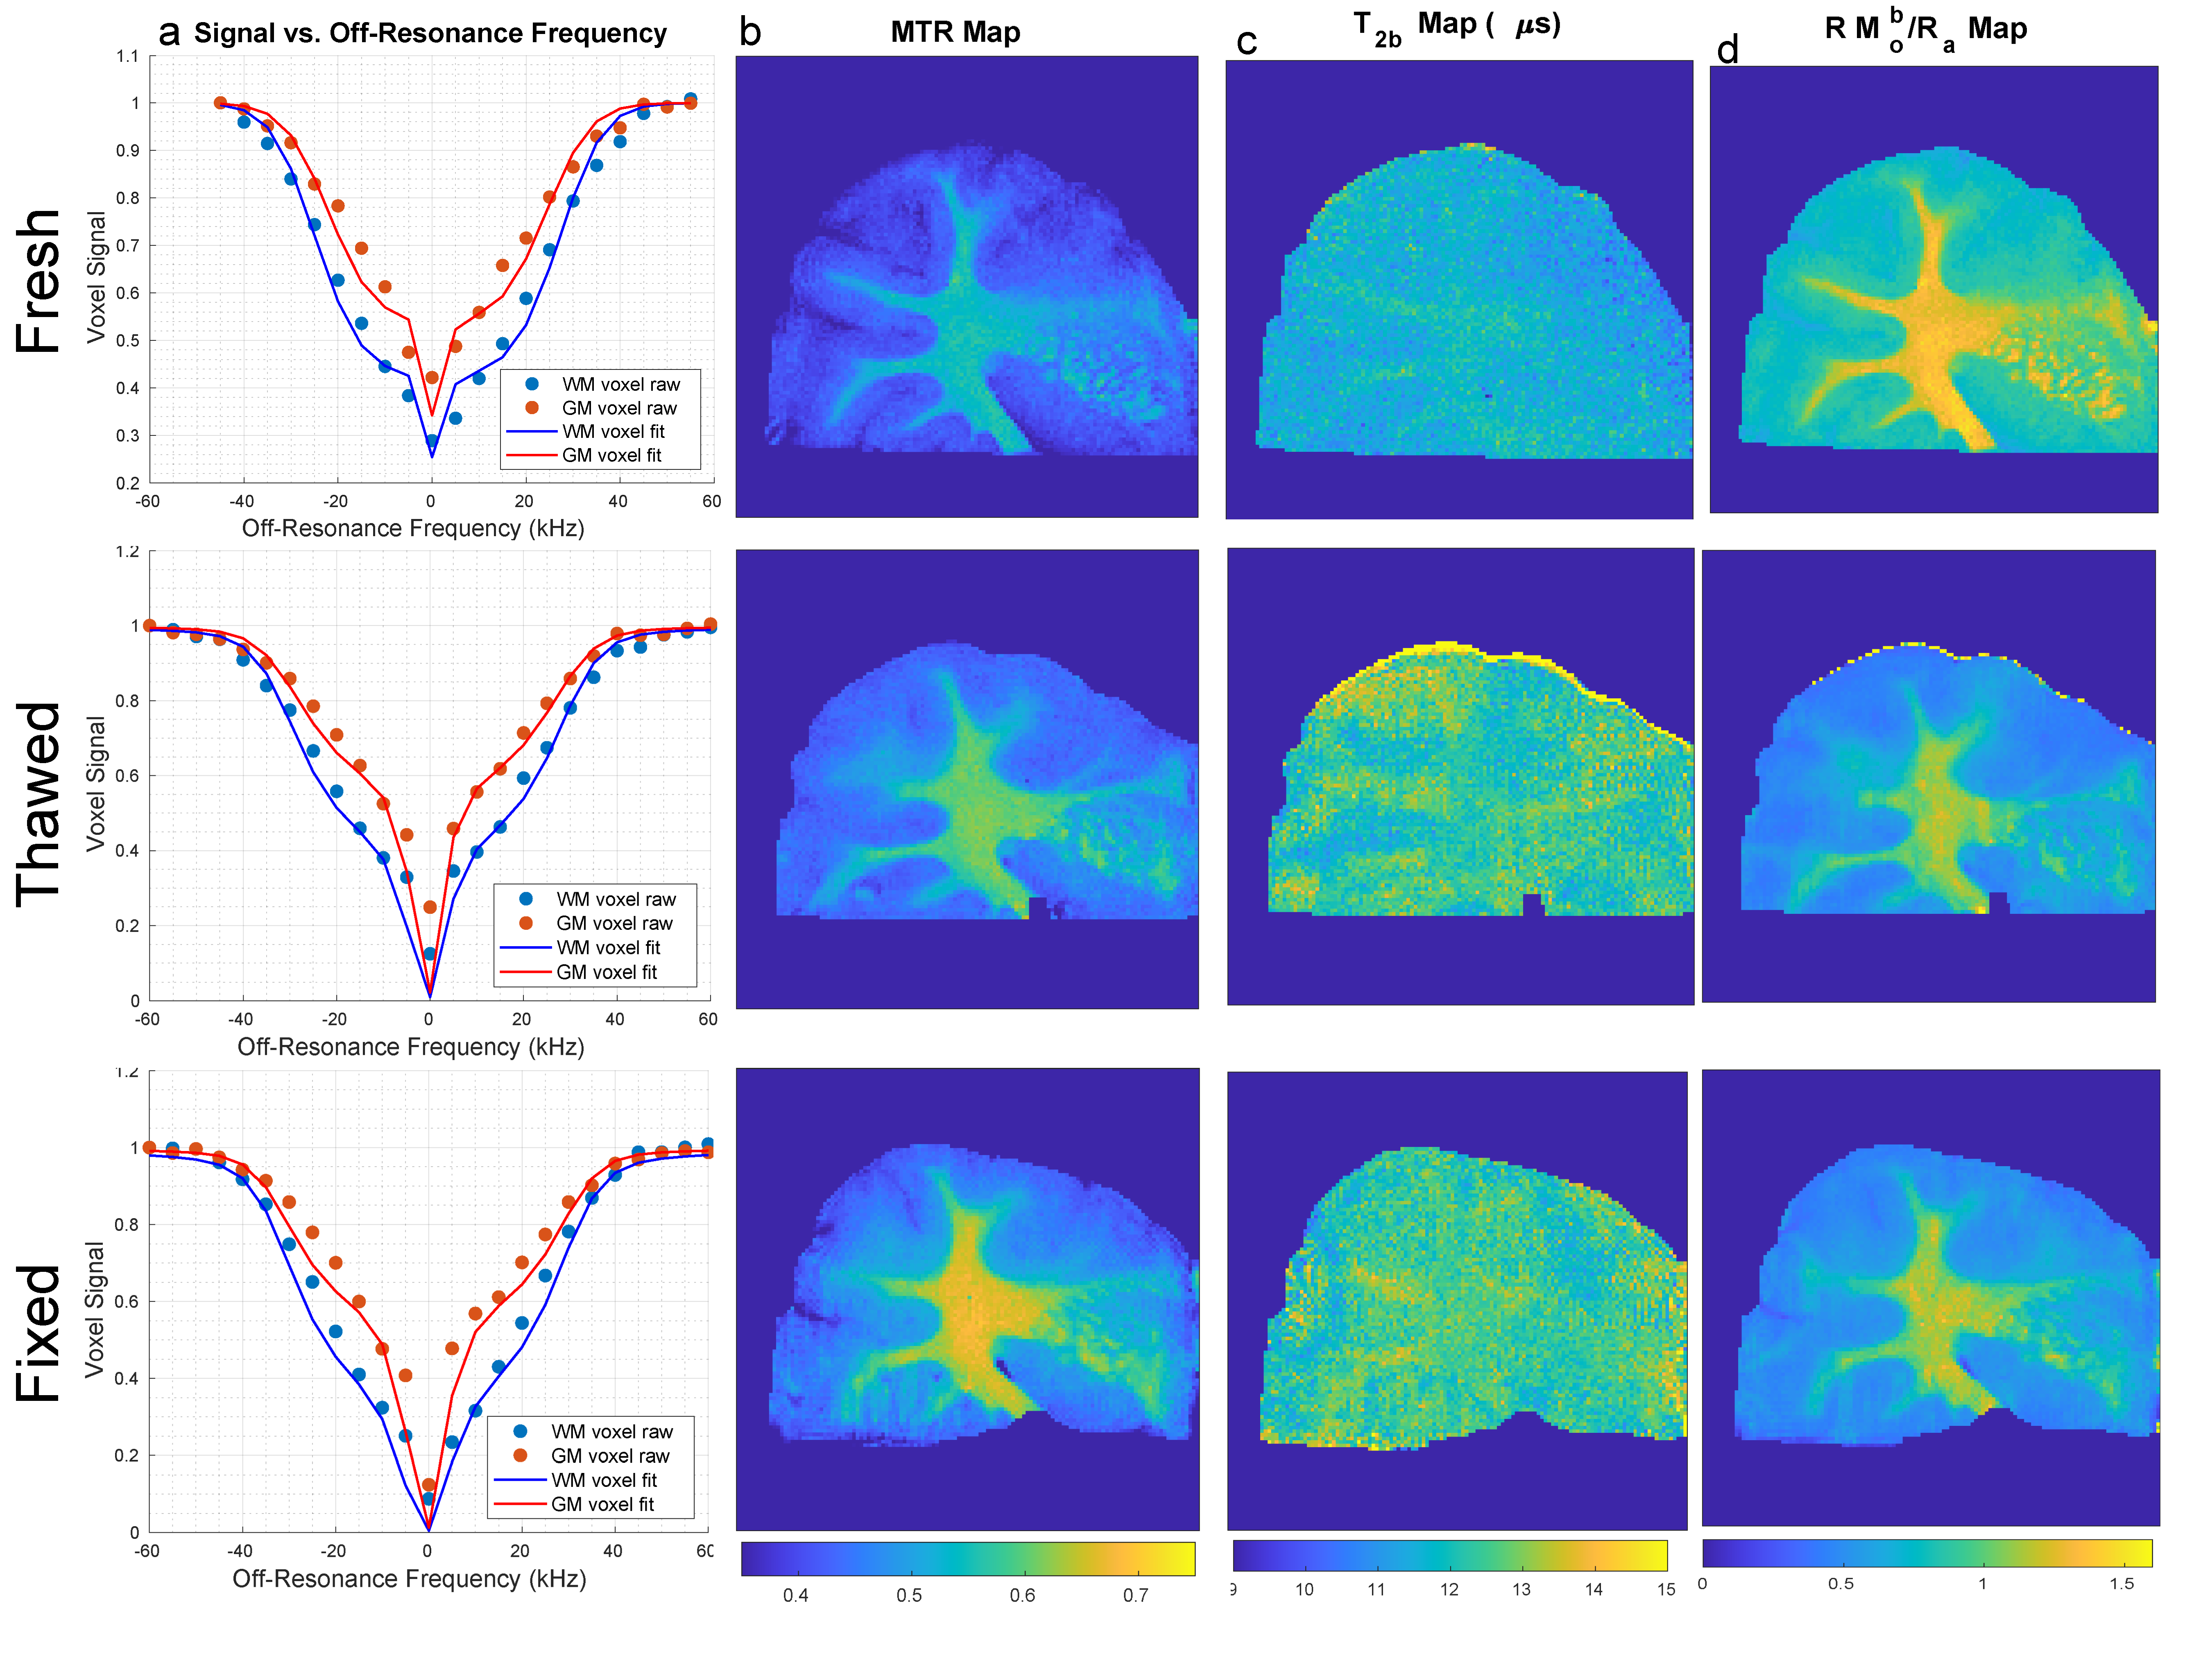
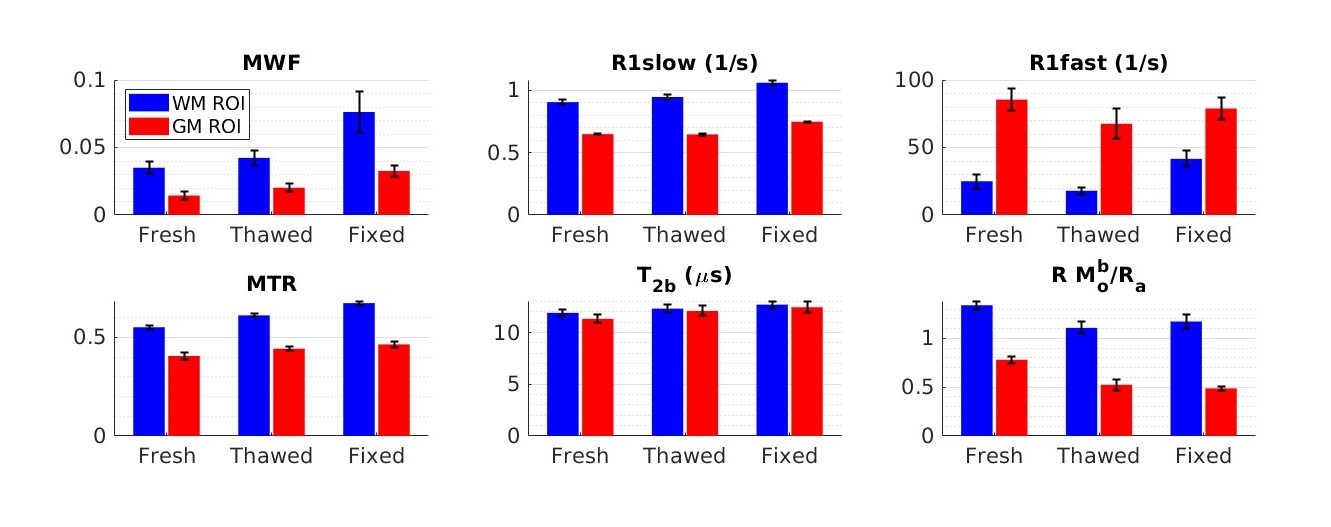
Figure 1 shows the T2 analysis; for this sample the average T2 peak for non-myelin water was lower for fixed tissue (27ms WM, 40ms GM) than fresh (58ms WM, 58ms GM) and thawed tissue (51ms WM, 58ms GM). Figure 2 shows the T1 analysis and an increase in R1fast and R1slow with fixation. Figure 3 shows the MT model analysis and illustrates a higher MTR from fixed tissue and not much WM/GM contrast in the T2b (T2 of solid component) map.Discussion
The observed shift to shorter T2 in the non-myelin water component in the formalin-fixed tissue is consistent with prior studies1-3. Additionally, we did not see differences in the T2 properties of the fresh/thawed samples, consistent with [9-10]. The MWF maps do not exhibit the same WM/GM contrast as in [1-3], but do show an increase in MWF in fixed tissue as in [4], and we hypothesize that our low temperature (15°C) and high field (7T) study may affect T2 analysis. Similar to in vivo human results in [6] we find WM R1fast to be smaller than GM R1fast. Presumably, this difference is due to increased protein content in GM vs. WM. Conversely, R1slow in WM is larger than GM, likely due to increased cholesterol and galactocerebroside content of WM. We see a higher MTR in fixed tissue, consistent with [4]. Among the limitations of our study that we plan to address in the next phase of experiments is the tissue age; the fixed tissue is older than the frozen tissue in comparison to the fresh tissue. Tissue aging is not taken into account in the current results. Despite the best effort to make comparisons in the same ROIs, fixation (and freezing/thawing) can shrink/expand the tissue and make placement of exact ROIs challenging. We did not conduct the experiments at physiological temperature, which may also affect tissue characteristics.Conclusion
We found that both fixation and freezing affect relaxation properties. Effects of fixation are most prominent in WM, so when studying ex vivo tissue, thawed tissue may be preferable to formalin-fixed. Our next step involves comparing these quantitative maps to histology to look for correlations and relationships between the two types of analyses.Acknowledgements
This work is supported by NIH grant P30AG072931-03S1.References
1. Laule, C., Leung, E., Li, D. K., Traboulsee, A. L., Paty, D. W., MacKay, A. L., & Moore, G. R. (2006). Myelin water imaging in multiple sclerosis: quantitative correlations with histopathology. Multiple Sclerosis Journal, 12(6), 747-753.
2. Laule, C., Kozlowski, P., Leung, E., Li, D. K., MacKay, A. L., & Moore, G. W. (2008). Myelin water imaging of multiple sclerosis at 7 T: correlations with histopathology. Neuroimage, 40(4), 1575-1580.
3. Laule, C., & Moore, G. W. (2018). Myelin water imaging to detect demyelination and remyelination and its validation in pathology. Brain Pathology, 28(5), 750-764.
4. Seifert, A. C., Umphlett, M., Hefti, M., Fowkes, M., & Xu, J. (2019). Formalin tissue fixation biases myelin‐sensitive MRI. Magnetic resonance in medicine, 82(4), 1504-1517.
5. Whittall, K. P., & MacKay, A. L. (1989). Quantitative interpretation of NMR relaxation data. Journal of Magnetic Resonance (1969), 84(1), 134-152.
6. Wang, Y., van Gelderen, P., de Zwart, J. A., & Duyn, J. H. (2020). B0-field dependence of MRI T1 relaxation in human brain. NeuroImage, 213, 116700.
7. Sled, J. G., & Pike, G. B. (2001). Quantitative imaging of magnetization transfer exchange and relaxation properties in vivo using MRI. Magnetic Resonance in Medicine: An Official Journal of the International Society for Magnetic Resonance in Medicine, 46(5), 923-931.
8. Henkelman, R. M., Huang, X., Xiang, Q. S., Stanisz, G. J., Swanson, S. D., & Bronskill, M. J. (1993). Quantitative interpretation of magnetization transfer. Magnetic resonance in medicine, 29(6), 759-766.
9. Baadsvik, E. L., Weiger, M., Froidevaux, R., Faigle, W., Ineichen, B. V., & Pruessmann, K. P. (2023). Mapping the myelin bilayer with short‐T2 MRI: Methods validation and reference data for healthy human brain. Magnetic Resonance in Medicine, 89(2), 665-677.
10. Evans, S. D., Nott, K. P., Kshirsagar, A. A., & Hall, L. D. (1998). The effect of freezing and thawing on the magnetic resonance imaging parameters of water in beef, lamb and pork meat. International journal of food science & technology, 33(3), 317-328.
Figures