2035
Selective imaging of myelin based on phase transition using a 3D adiabatic inversion recovery prepared ultrashort echo time (3D IR-UTE) sequence1UCSD, San Diego, CA, United States, 2Radiology Service, Veterans Affairs San Diego Healthcare System, San Diego, CA, United States, 3Dept of Bioengineering, UCSD, San Diego, CA, United States
Synopsis
Keywords: White Matter, White Matter
Motivation: There is a need for selective myelin imaging with minimal contamination from long-T2 water components.
Goal(s): To develop a new contrast mechanism for direct visualization of myelin using a three-dimensional adiabatic inversion recovery prepared ultrashort echo time (3D IR-UTE) sequence.
Approach: We employed the long-T2 signal phase transition in 3D dual-echo IR-UTE imaging to find the optimal inversion time (TI) necessary to null water signals for selective myelin imaging in a clinical 3T scanner.
Results: Myelin signal could be selectively detected by 3D IR-UTE sequence based on long-T2 phase transition and optimal TI for both ex vivo and in vivo brains.
Impact: The 3D IR-UTE sequence allows direct imaging of myelin, which is important for accurate diagnosis and assessment of multiple sclerosis (MS), Alzheimer’s disease (AD), and other neurological diseases.
Introduction
Myelin sheath is a multi-lamellar membrane that insulates axons against electrical activity1. It consists of alternating layers of protein and lipid. Prior studies suggest that the non-aqueous myelin protons have ultrashort T2*s (~0.2ms or shorter) and can be directly detected with UTE sequences2-4. The major challenge is selectivity because long-T2 water components demonstrate far higher signals than myelin4-7. Adiabatic IR pulses provide uniform inversion and nulling of the longitudinal magnetizations of water components8-11. Myelin has an ultrashort T2, far shorter than the duration of the adiabatic inversion pulse. Its longitudinal magnetization is largely saturated by the long adiabatic inversion pulse and subsequently recovers relatively quickly because of its short T1. As a result, at the optimal inversion time (TI, or null point), the white matter signal mainly comes from myelin. The long-T2 components have a negative longitudinal magnetization before the optimal TI, and a positive longitudinal magnetization after the optimal TI. Therefore, a p phase transition is expected for the second echo. This study aims to employ the long-T2 signal phase transition in 3D dual-echo IR-UTE imaging to find the optimal TI necessary to null water signals for selective myelin imaging with the first echo UTE data acquisition.Methods
Figure 1 shows the 3D IR-UTE cones sequence diagram. The contrast mechanism is summarized in Figure 1C. The schematic myelin phase and phase transition for long-T2 water at the optimal TI are displayed in Figure 1D. B0 and B1 inhomogeneities were estimated for more accurate phase mapping as described in Figure 2. The B0 and B1 field maps were derived from dual-echo (TE=0.032/2.2ms) and three-echo (TE=0.032/2.2/4.4ms) UTE sequences. Phase unwrapping was performed using a region-growing-based algorithm. Phase correction was performed to compensate for the field inhomogeneities. Linear fitting was used to correct the B0 and B1 phase maps, where the slope of fitting line determined the B0 field while the intercept estimated the B1 phase map. A roll-off filter was applied during the image reconstruction to improve signal-to-noise ratio (SNR). Five freshly harvested ex-vivo brain specimens and five asymptomatic subjects were investigated. The specimens were scanned using the following parameters: TR=500ms, field of view (FOV)=60x60mm2; matrix size=100x100; flip angle (FA)=28°; TE=0.032/2.2ms; TIs ranging from 140 to 210ms; and scan time for each TI = 5min30sec. Human subjects were scanned with a longer TR of 500ms (TIs ranging from 140 to 210ms; FA=28°; scan time for each TI = 2min30sec) and a shorter TR of 106ms (short TR adiabatic IR-UTE or STAIR-UTE with TIs ranging from 44 to 52ms; FA=18°; scan time for each TI=4min30sec), respectively. Other sequence parameters were FOV=220x220mm2; TE=0.032/2.2ms; slice thickness=5mm; matrix size=100x100. Phase maps for the first and second echoes were plotted as a function of TI.Results
Magnitude and phase images of an ex-vivo brain sample are shown in Figure 3. Figure 3B shows the phase transition near a TI of 180ms, the optimal nulling time for long-T2 water, for the region marked by a blue circle on the magnitude image (Figure 3A).Figure 4 shows the dual-echo magnitude images with B0 and B1 corrected phase maps of the brain of a 30-year-old healthy volunteer with TR 500ms and six different TIs (160–200ms). An apparent p phase transition from –1.5 to 2.0 was observed at TI of 187 ms, which is the nulling time for long-T2 white matter. The arrows point towards the regional difference in signal recovery post-inversion associated with white matter T1 variation across the whole brain.
This T1 variation is less problematic when a shorter TR is used, as shown in Figure 5. The STAIR-UTE technique with a TR of 106ms efficiently suppressed all water components, as demonstrated by the uniform phase transition for long-T2 white matter seen from the corrected phase maps and magnitude images of a 28-year-old volunteer.
Discussion
We systematically varied the TI in 3D IR-UTE imaging of the brain ex vivo and in vivo. A sharp phase transition was observed for long-T2 whiter matter. Furthermore, a shorter TR allows sharper phase transition under a narrower range of TIs, thereby minimizing water contamination due to T1 variation across the whole brain. The STAIR-UTE technique provided more efficient long-T2 signal suppression with much reduced regional variations, as seen when TR was reduced from 500ms to 106ms.Conclusion
An apparent π phase transition was observed for long-T2 white matter in the 2nd echo in dual-echo 3D IR-UTE imaging. The 3D IR-UTE sequence, especially STAIR-UTE allows direct volumetric imaging of myelin in white matter of the brain ex vivo and in vivo.Acknowledgements
The authors acknowledge grant support from the National Institutes of Health (F32AG082458-01 and RF1AG075717) and VA Clinical Science and Rehabilitation Research and Development Services (Merit Awards I01CX001388).References
1. Raine, CS. Morphology of myelin and myelination. In: Morell, P., editor. Myelin. Plenum; New York: 1984. p. 1-41
Waldman A, Rees JH, Brock CS, Robson MD, Gatehouse PD, Bydder GM. MRI of the brain with ultra-short echo-time pulse sequences. Neuroradiology. 2003;45(12):887-892.
2. Horch RA, Gore JC, Does MD. Origins of the ultrashort-T2 1H NMR signals in myelinated nerve: a direct measure of myelin content? Magn Reson Med. 2011;66(1):24-31.
3. Wilhelm MJ, Ong HH, Wehrli SL, Li C, Tsai PH, Hackney DB, et al. Direct magnetic resonance detection of myelin and prospects for quantitative imaging of myelin density. Proc Natl Acad Sci U S A. 2012;109(24):9605-9610.
4. Fan SJ, Ma Y, Zhu Y, Searleman A, Szeverenyi NM, Bydder GM, et al. Yet more evidence that myelin protons can be directly imaged with UTE sequences on a clinical 3T scanner: Bicomponent T2* analysis of native and deuterated ovine brain specimens. Magn Reson Med. 2018;80(2):538-547.
5. Du J, Ma G, Li S, Carl M, Szeverenyi NM, VandenBerg S, et al. Ultrashort echo time (UTE) magnetic resonance imaging of the short T2 components in white matter of the brain using a clinical 3T scanner. Neuroimage. 2014;87:32-41.
6. Sheth V, Shao H, Chen J, Vandenberg S, Corey-Bloom J, Bydder GM, et al. Magnetic resonance imaging of myelin using ultrashort Echo time (UTE) pulse sequences: Phantom, specimen, volunteer and multiple sclerosis patient studies. Neuroimage. 2016;136:37-44.
7. Weiger M, Froidevaux R, Baadsvik EL, Brunner DO, Rosler MB, Pruessmann KP. Advances in MRI of the myelin bilayer. Neuroimage. 2020;217:116888.
8. Ma YJ, Jang H, Wei Z, Cai Z, Xue Y, Lee RR, et al. Myelin Imaging in Human Brain Using a Short Repetition Time Adiabatic Inversion Recovery Prepared Ultrashort Echo Time (STAIR-UTE) MRI Sequence in Multiple Sclerosis. Radiology. 2020;297(2):392-404.
9. Ma YJ, Jang H, Wei Z, Wu M, Chang EY, Corey-Bloom J, et al. Brain ultrashort T2 component imaging using a short TR adiabatic inversion recovery prepared dual-echo ultrashort TE sequence with complex echo subtraction (STAIR-dUTE-ES). J Magn Reson. 2021;323:106898.
10. Ma YJ, Searleman AC, Jang H, Wong J, Chang EY, Corey-Bloom J, et al. Whole-Brain Myelin Imaging Using 3D Double-Echo Sliding Inversion Recovery Ultrashort Echo Time (DESIRE UTE) MRI. Radiology. 2020;294(2):362-374.
11. Ma YJ, Searleman AC, Jang H, Fan SJ, Wong J, Xue Y, et al. Volumetric imaging of myelin in vivo using 3D inversion recovery-prepared ultrashort echo time cones magnetic resonance imaging. NMR Biomed. 2020;33(10): e4326.
12. J.S. Athertya, Y. Ma, A. Masoud Afsahi, A.F. Lombardi, D. Moazamian, S. Jerban, S. Sedaghat, H. Jang. Accelerated quantitative 3D UTE-cones imaging using compressed sensing, Sensors, 22 (19) (2022), p. 7459
Figures
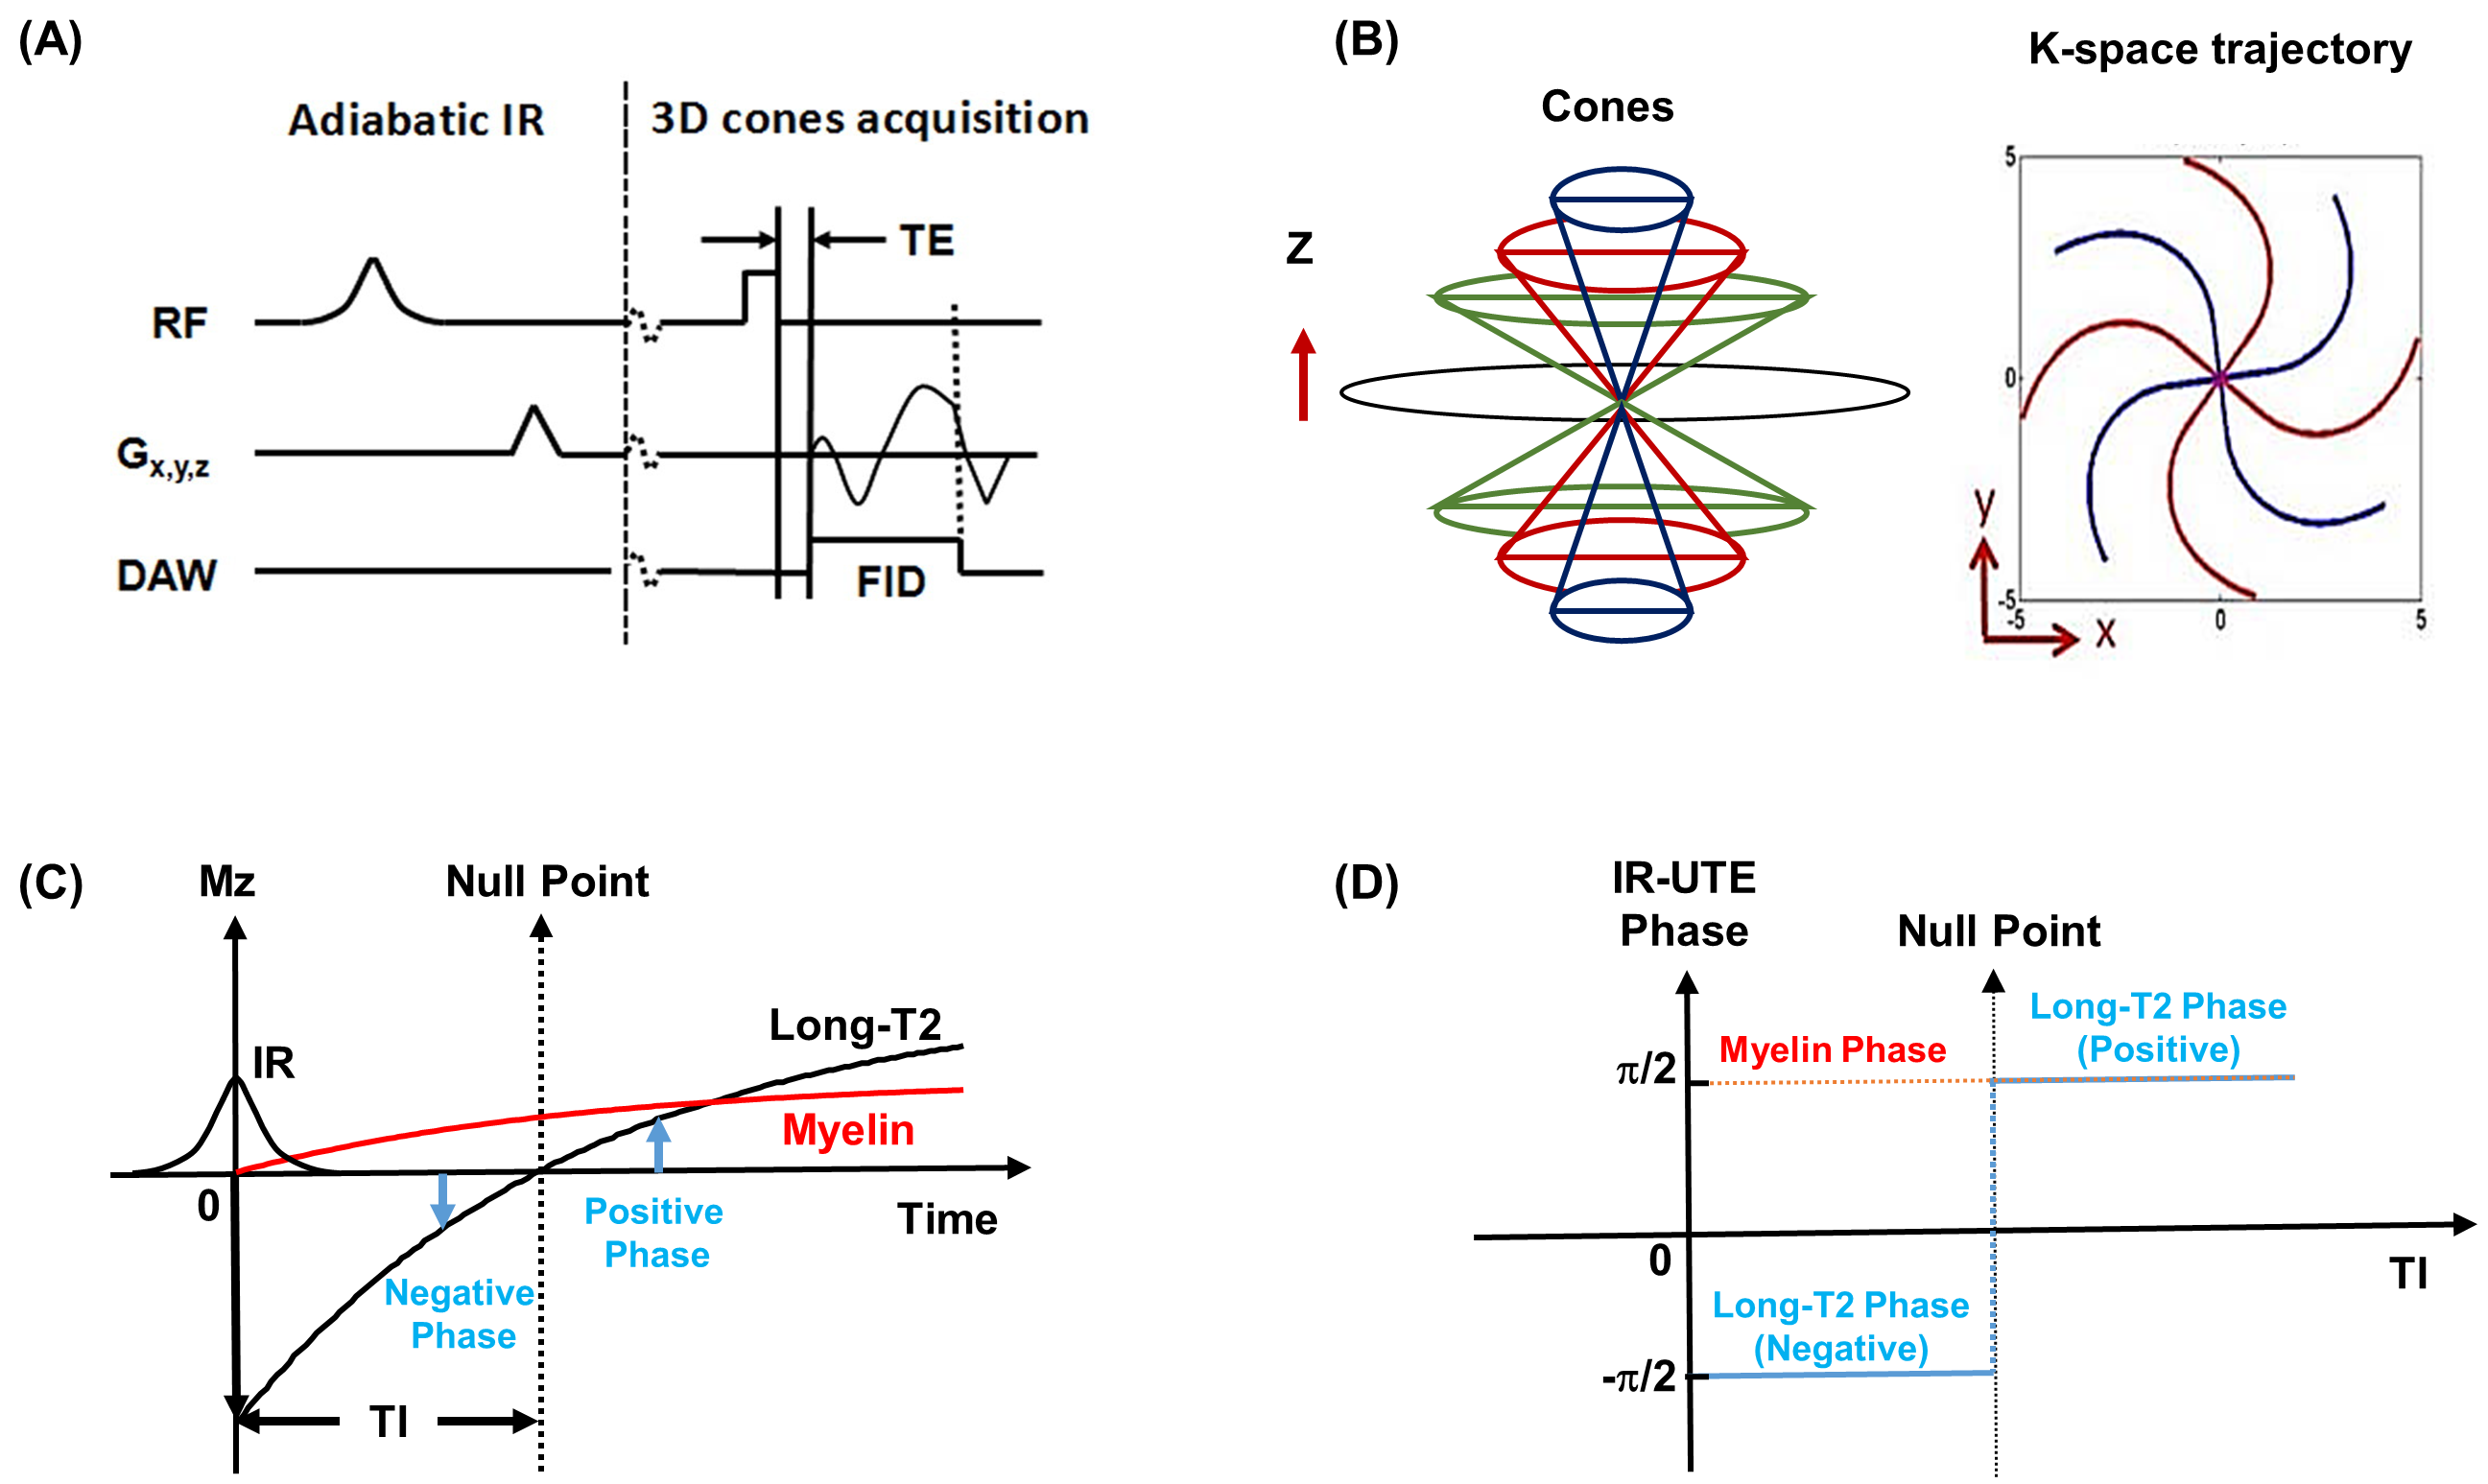
Figure 1. The 3D IR-UTE Cones sequence with a short rectangular pulse for signal excitation (A), followed by a 3D Cones trajectory (B). The contrast mechanism in dual-echo IR-UTE imaging of myelin in white matter, where UTE data acquisition starts at a TI set to null signals from the long-T2 white matter, which has a negative longitudinal magnetization (thus positive phase) before the optimal TI and a positive longitudinal magnetization (thus negative phase) after the optimal TI (C). Schematic diagram for phase transition at the optimal TI for myelin and long-T2 water components (D).
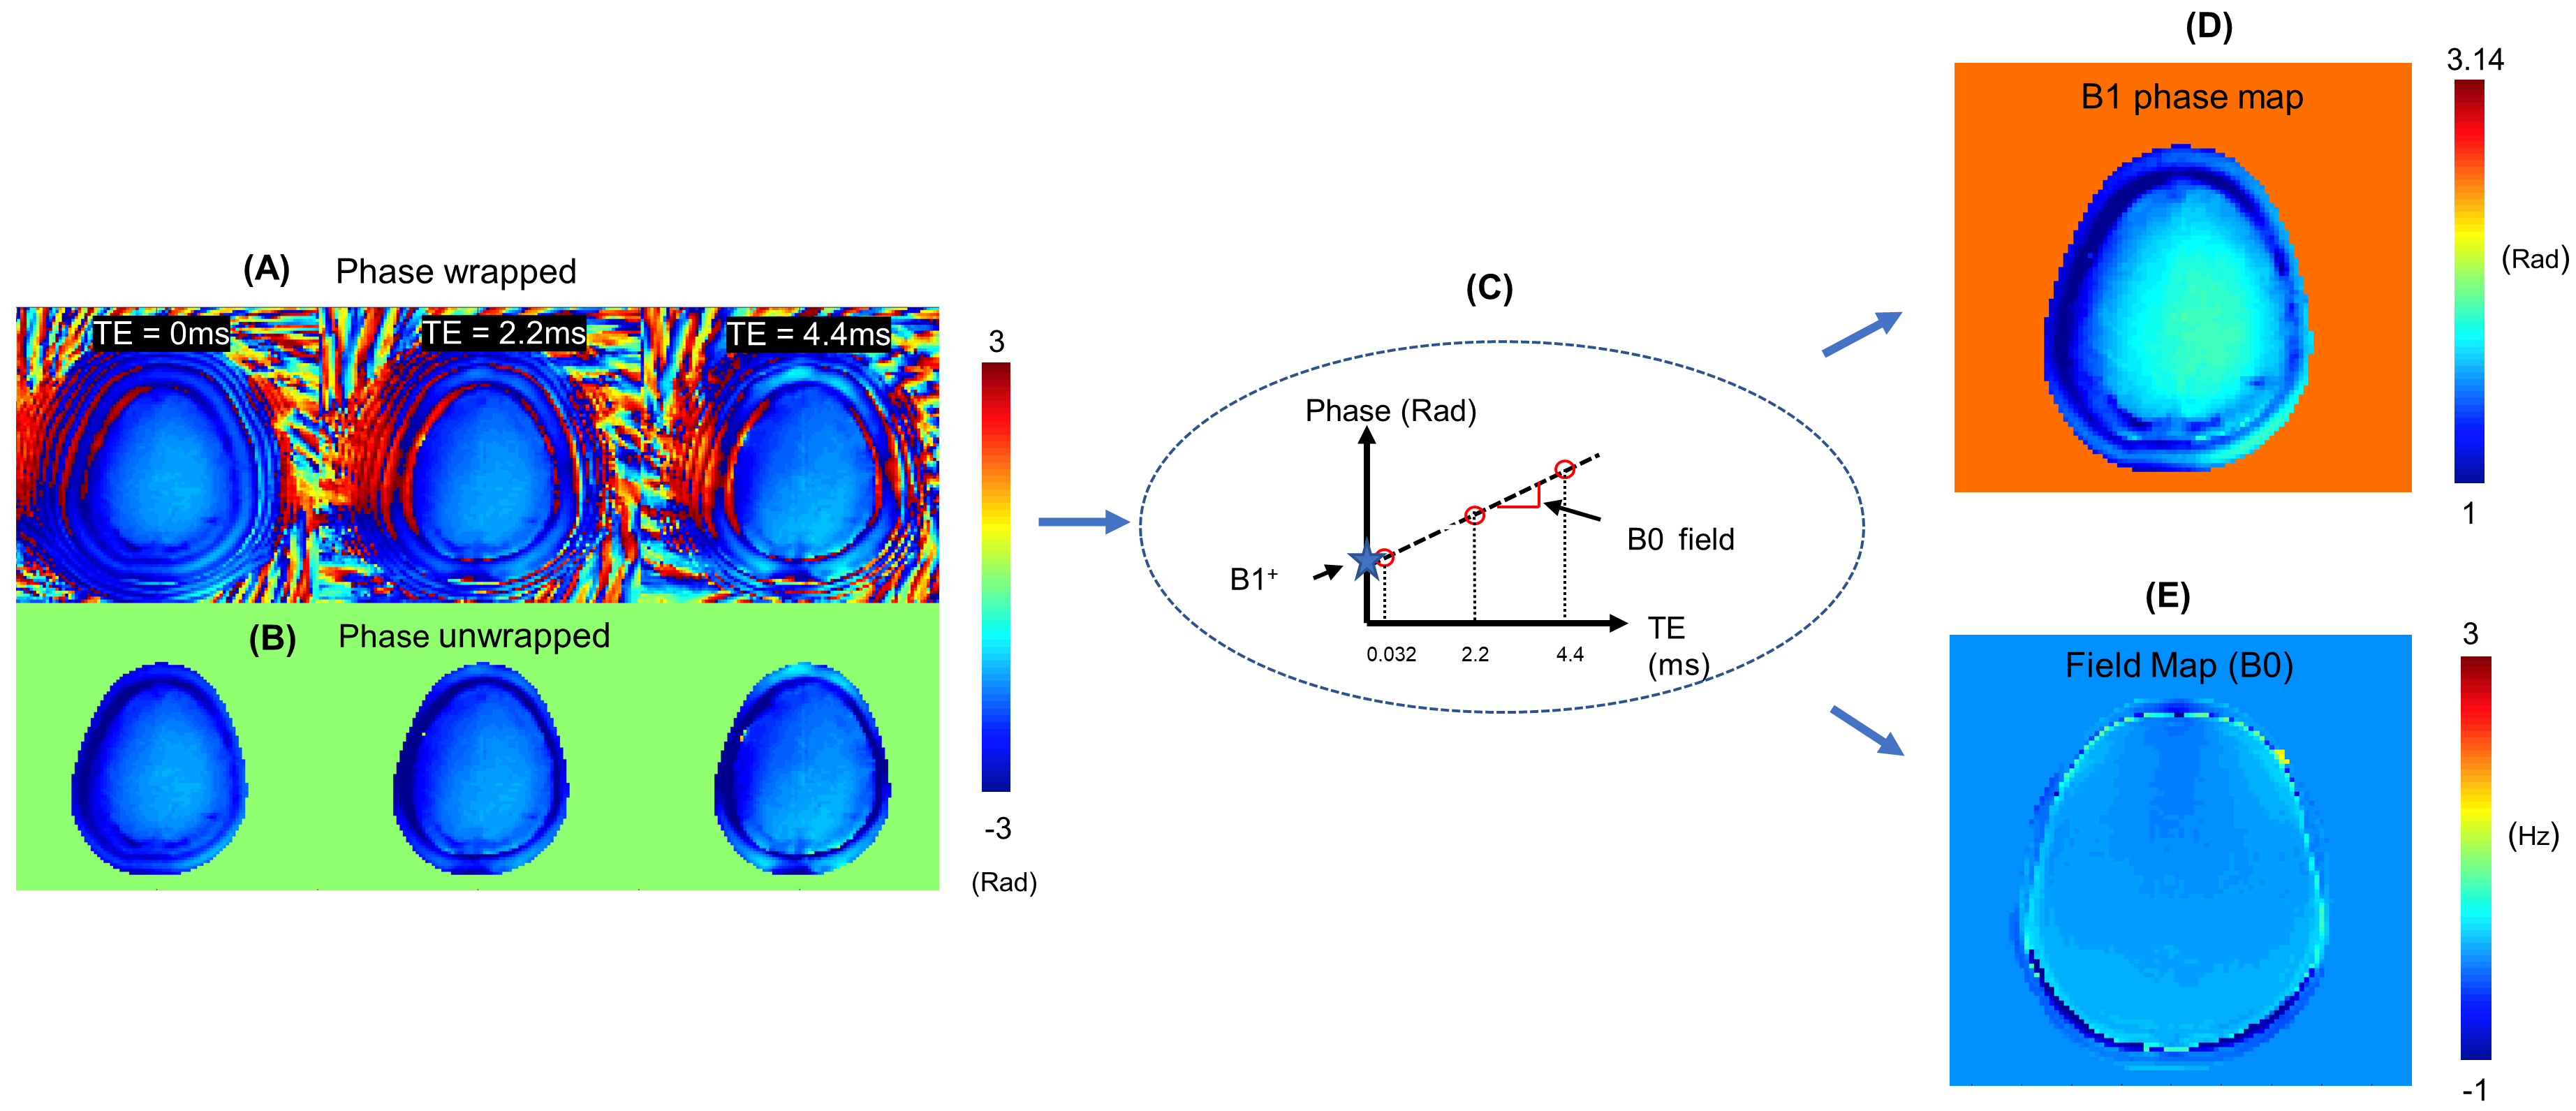
Figure 2. B0/B1 phase correction. Unwrapping of UTE phase map using field map (B0) and phase map (B1) estimated as slope and y-intercept after linear fitting of UTE phase maps acquired at three TEs of 0.032, 2.2, and 4.4ms. Phase-wrapped images (A) at different echoes are unwrapped (B) using the algorithm illustrated in (C). The resultant phase maps for B1 and B0 are shown in (D) and (E) respectively.
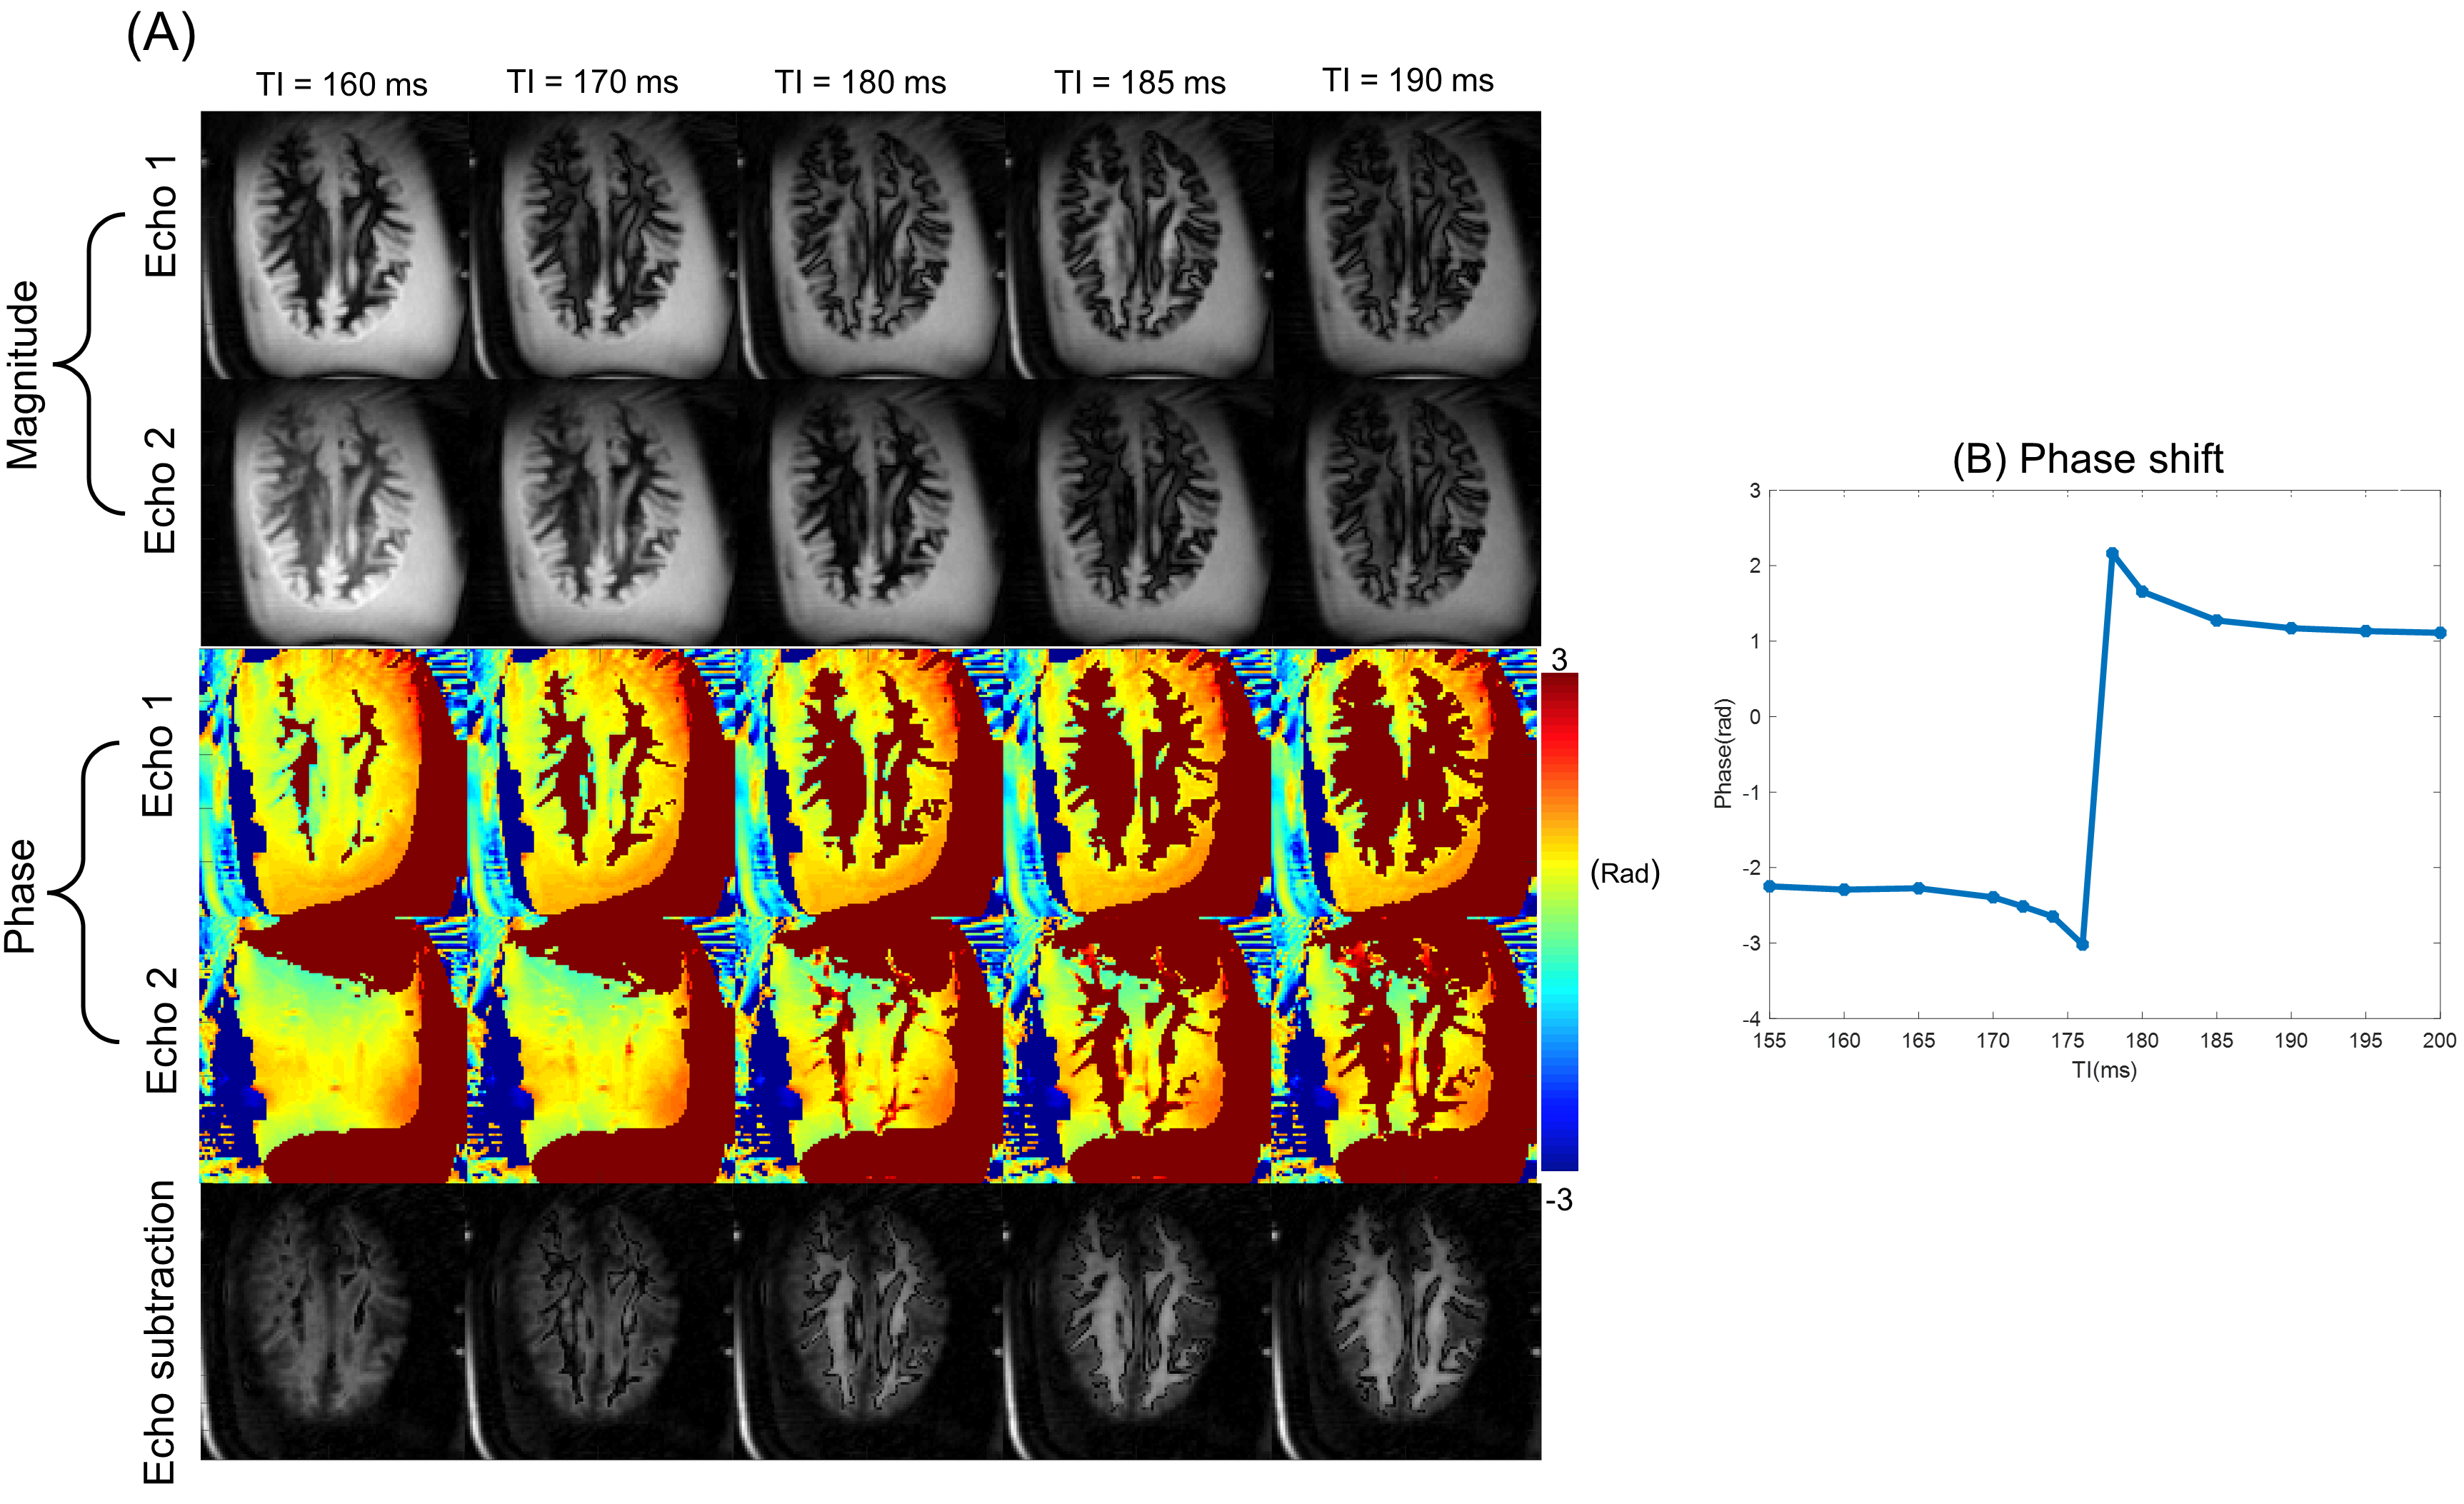
Figure 3. Panel (A) presents the magnitude and phase images of an ex-vivo brain sample acquired with the 3D IR-UTE sequence for different TIs. Figure (B) demonstrates the phase shift at the white matter region. A sharp phase transition was observed for long-T2 white matter with negative phase before the optimal TI and positive phase after the optimal TI (C). ROI is highlighted in blue in the white matter region in (A).
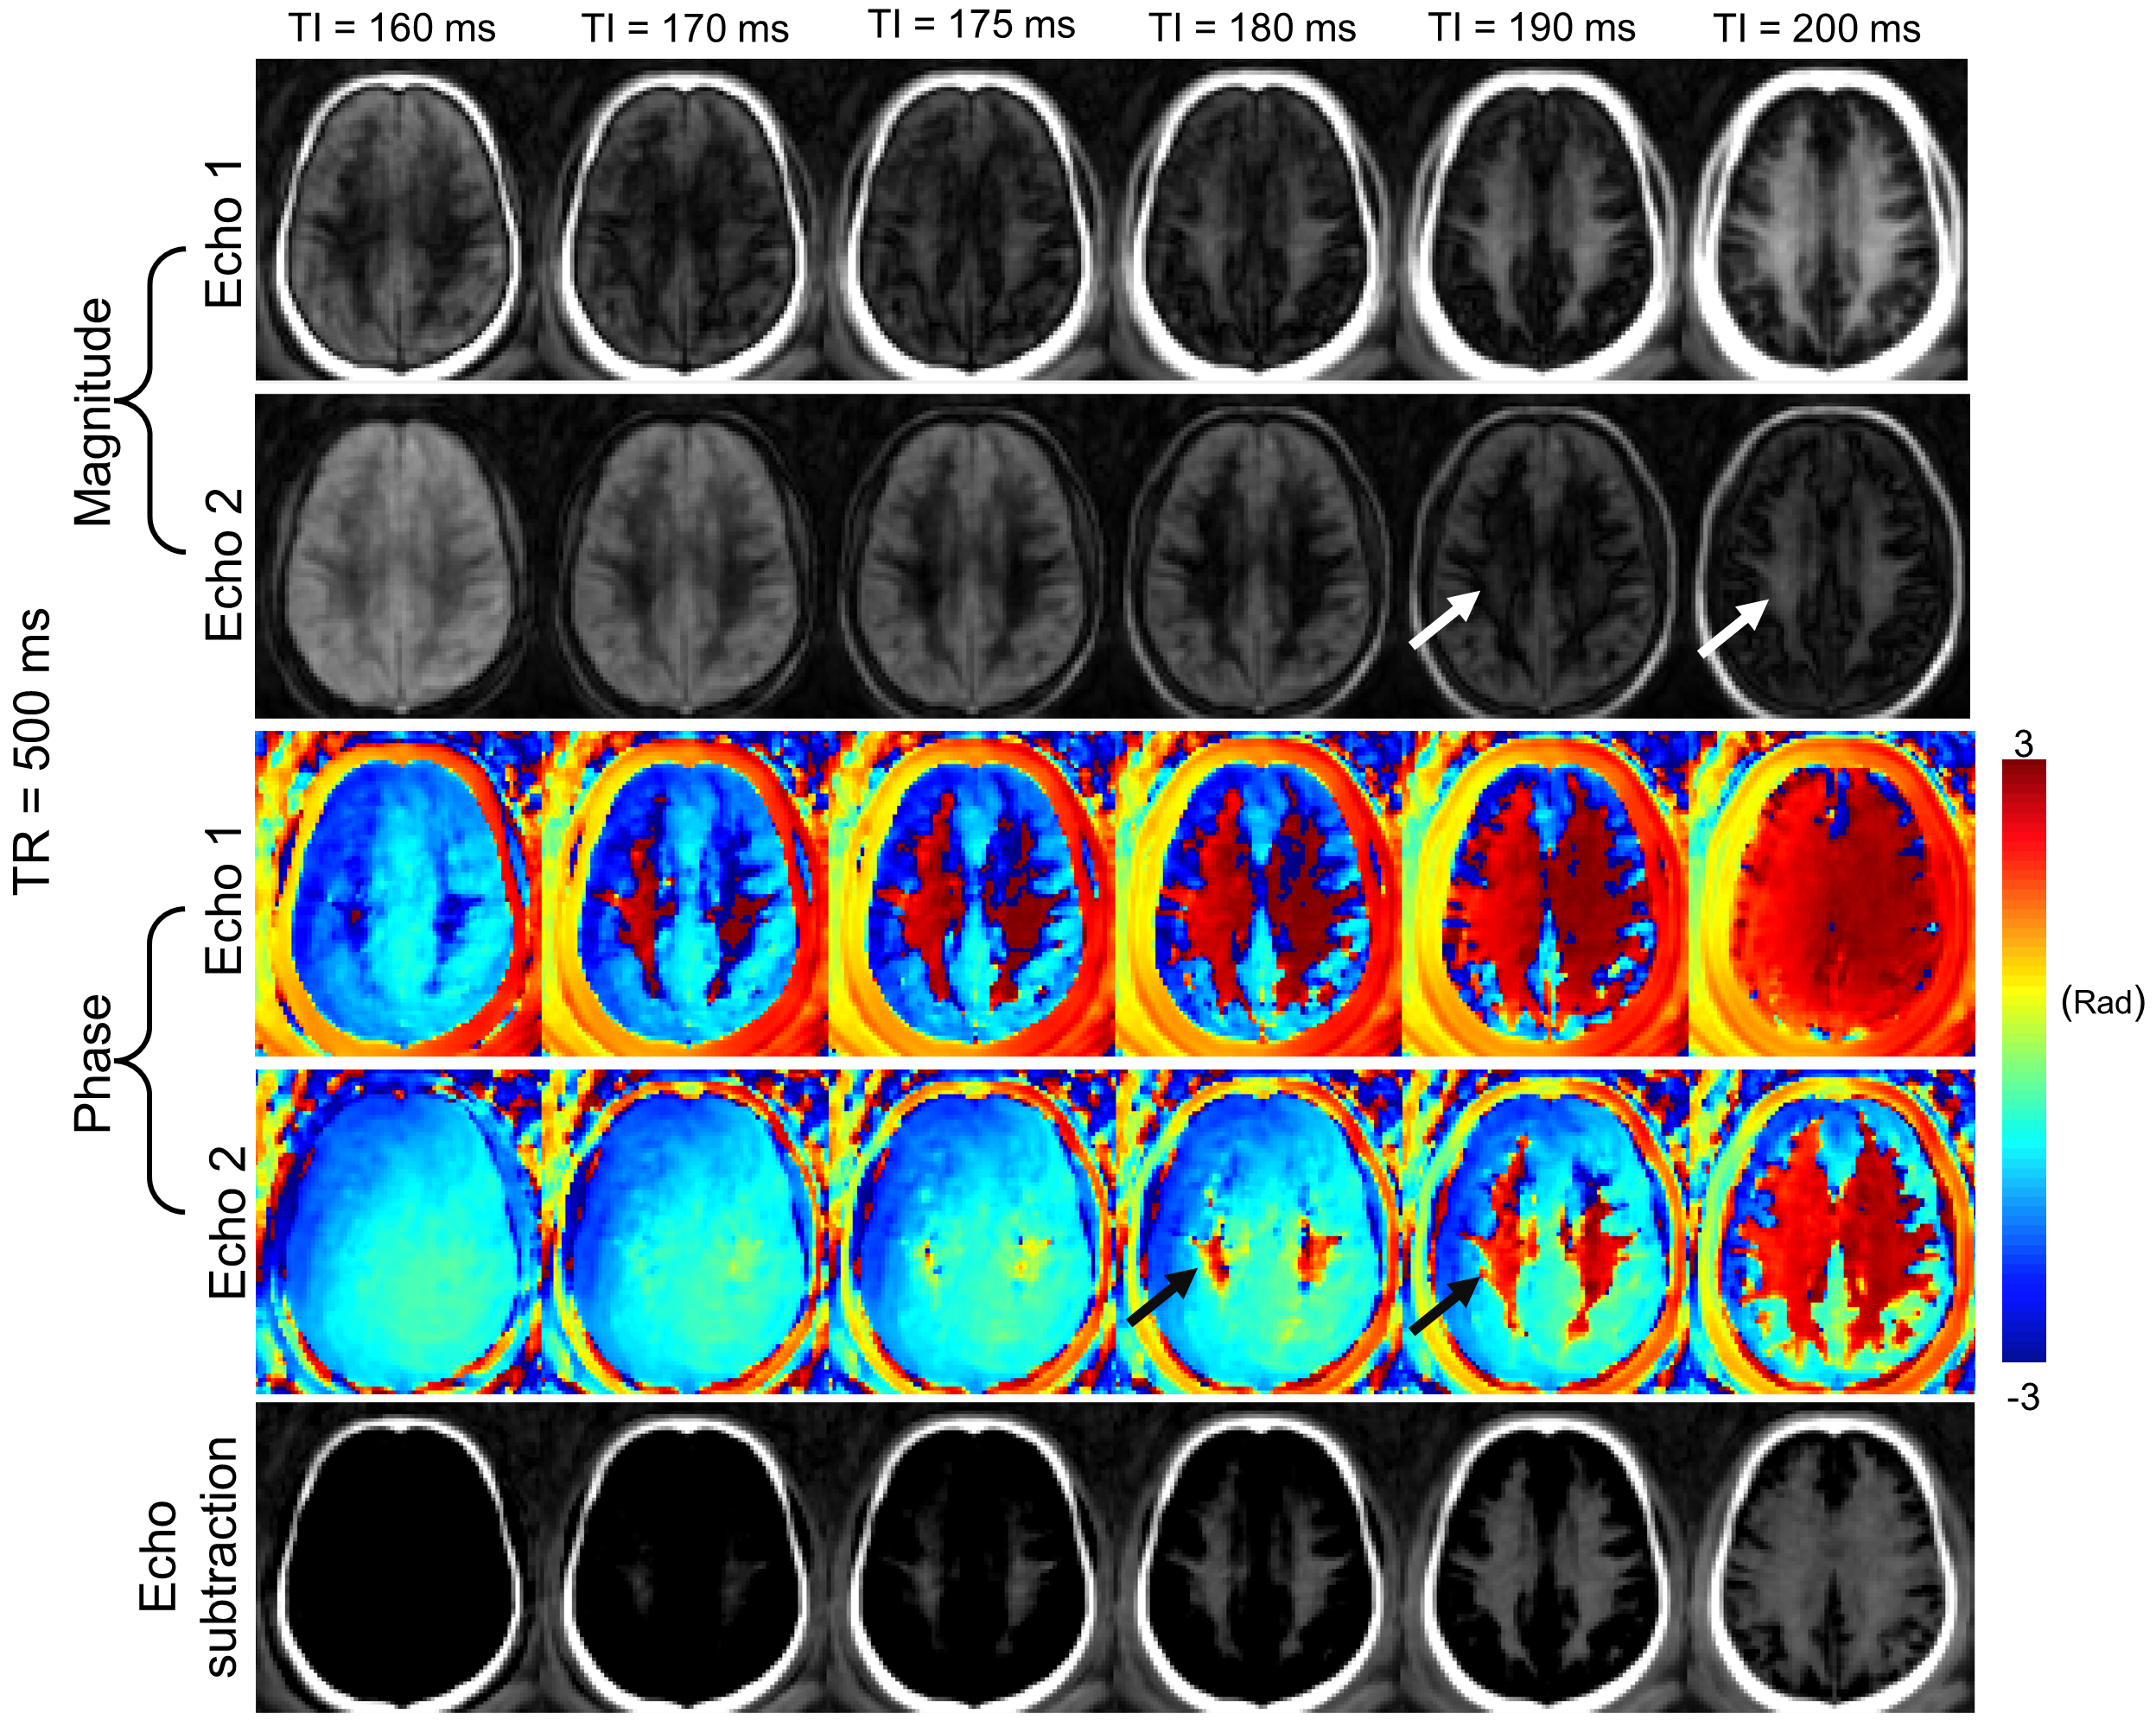
Figure 4. IR-UTE magnitude and phase images of the brain of a 30-year-old female healthy volunteer at TR = 500 ms for different TIs ranging between 160ms to 200ms along with echo subtracted images. The white and black arrows point toward the signal rebound in the magnitude and phase images.
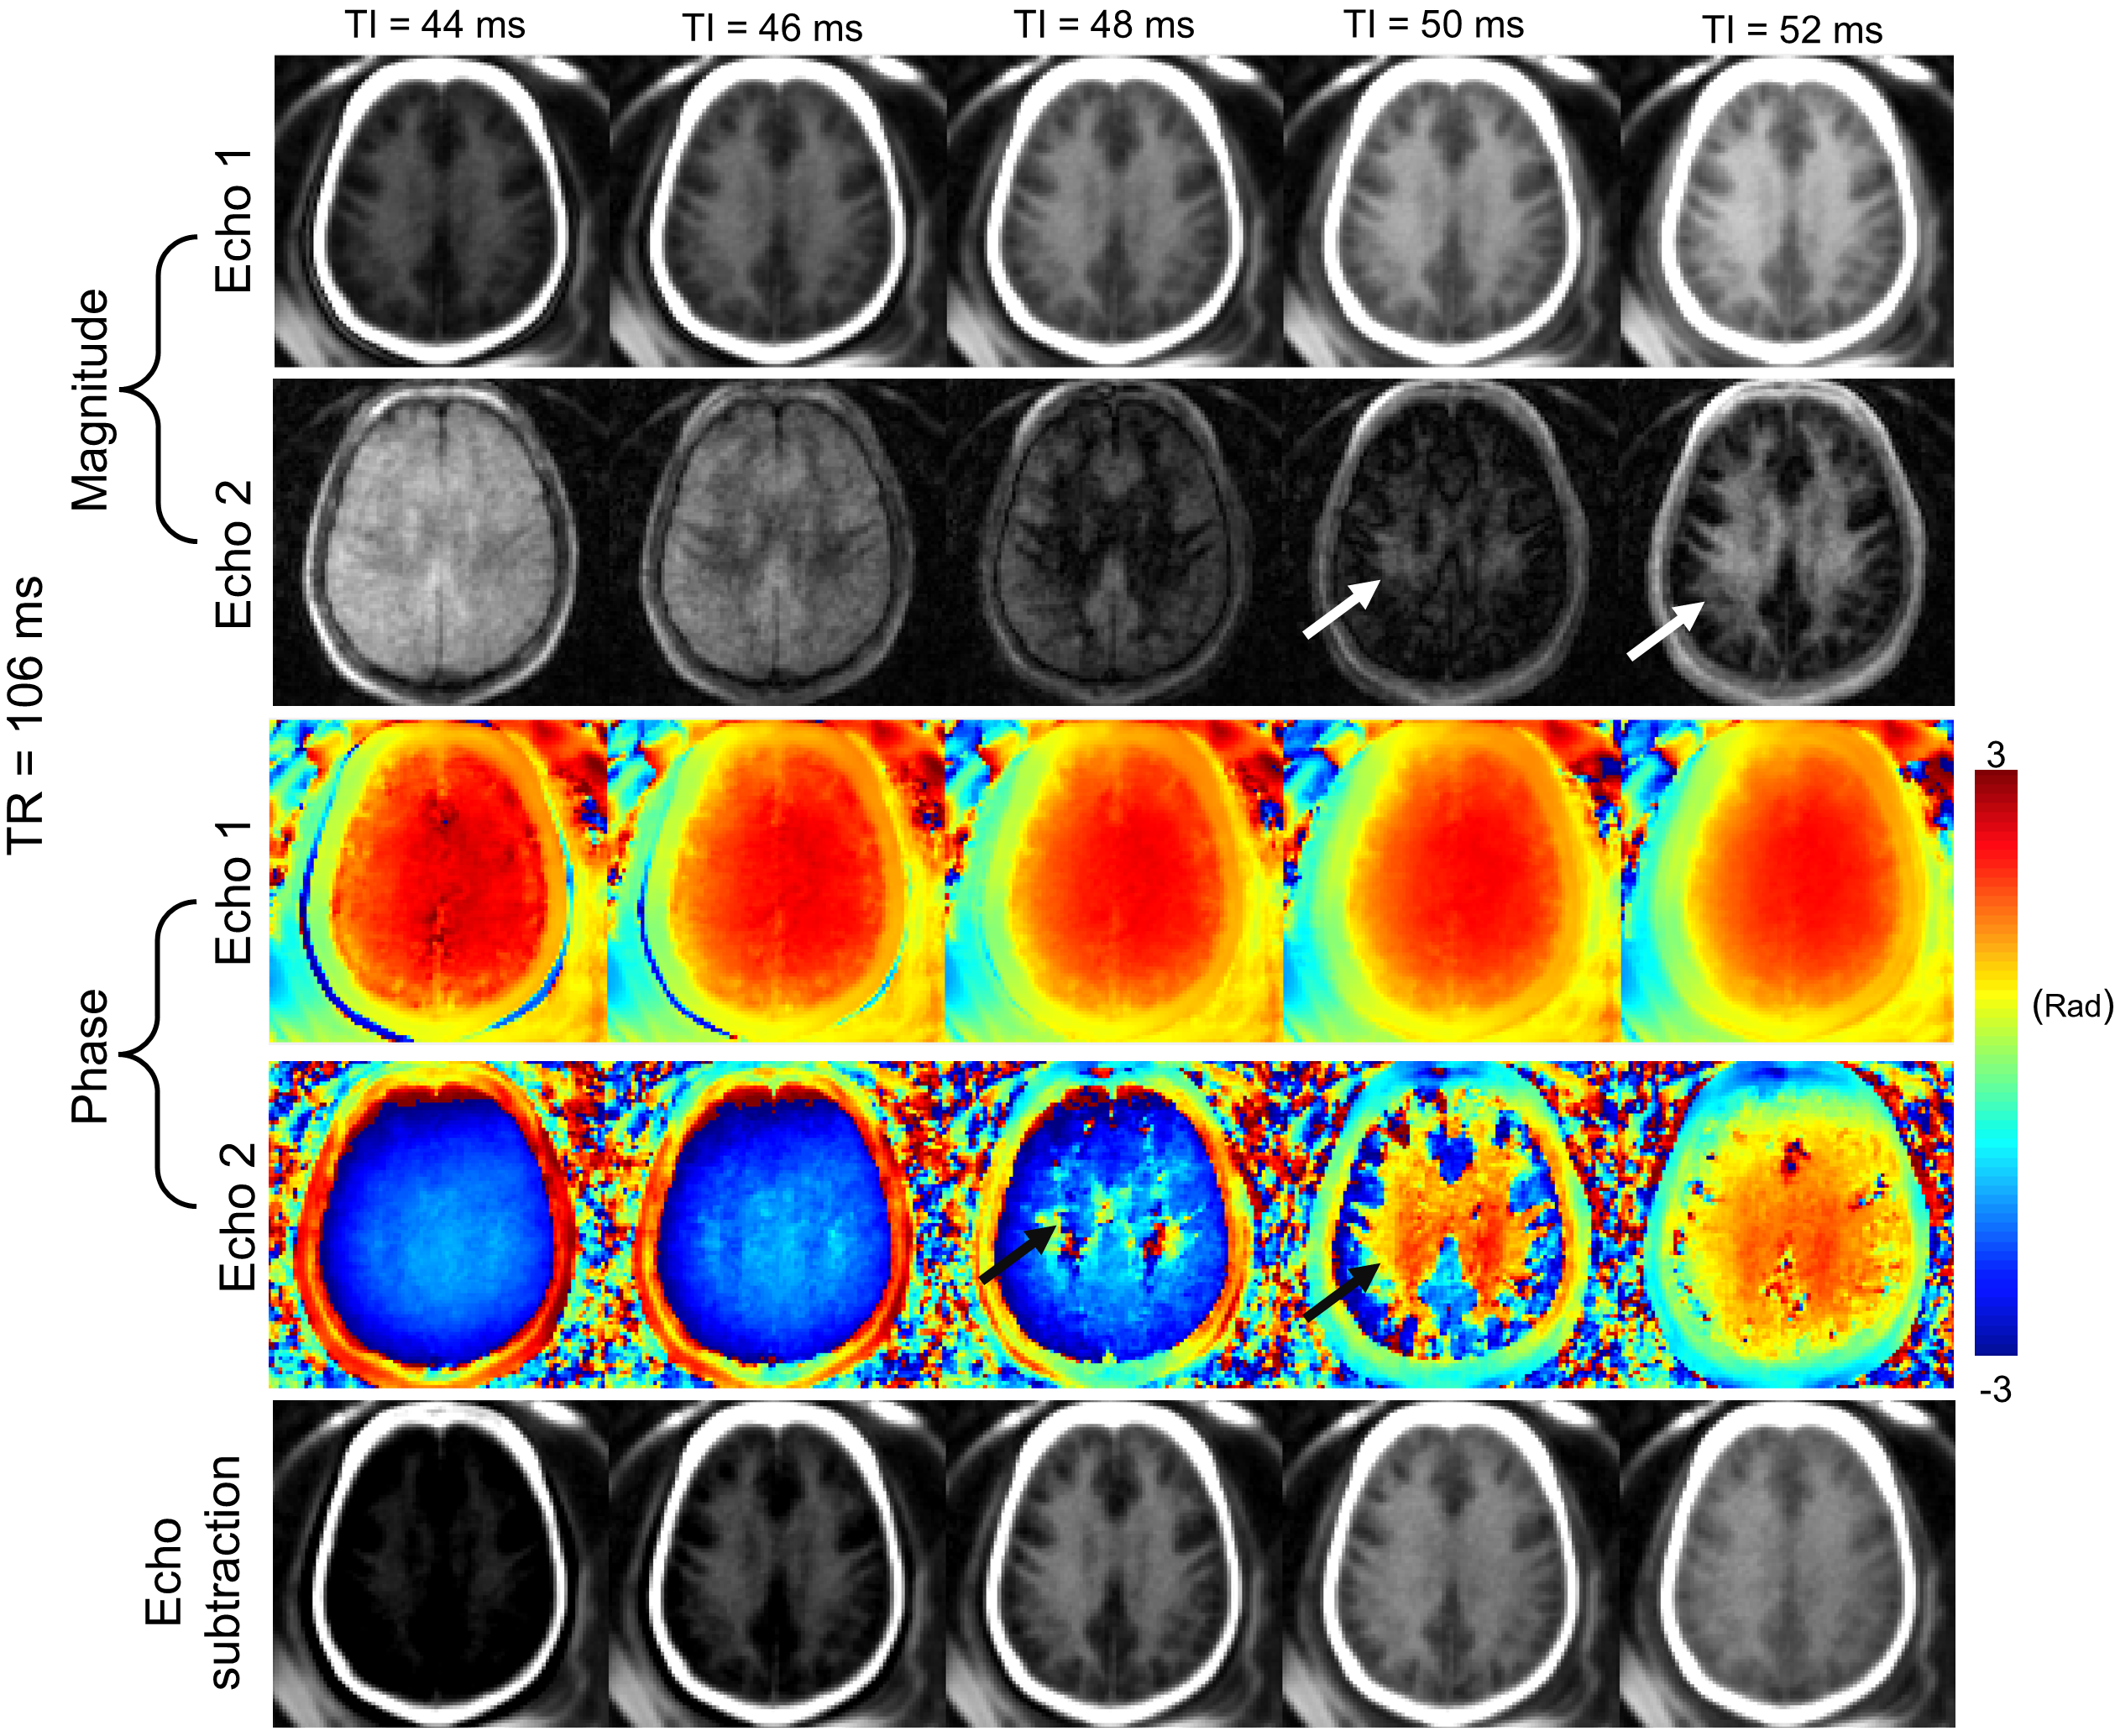
Figure 5. IR-UTE magnitude and phase images of the brain of a 28-year-old male healthy volunteer at TR = 106 ms for different TIs ranging between 44 ms and 52 ms along with echo subtracted images. The white and black arrows point toward the signal rebound in the magnitude and phase images.