2034
Direct myelin imaging using a 3D double adiabatic inversion recovery prepared ultrashort echo time (3D DIR-UTE) cones sequence1UCSD, San Diego, CA, United States, 2Dept of Bioengineering, UCSD, San Diego, CA, United States, 3Radiology Service, Veterans Affairs San Diego Healthcare System, San Diego, CA, United States
Synopsis
Keywords: White Matter, White Matter, UTE imaging, Myelin
Motivation: Many neurological disorders are characterized by myelin damage and loss. Robust long T2 suppression is of critical importance for accurate myelin quantification due to myelin's low proton densities.
Goal(s): To develop a new UTE imaging approach that enables sufficient long T2 suppression for selective myelin imaging.
Approach: A 3D DIR-UTE sequence was developed for selective myelin imaging on a 3T clinical scanner. The technical feasibility was tested by phantom and in vivo studies.
Results: The long T2 signals were sufficiently suppressed with the DIR scheme. The myelin proton fraction in white matter regions quantified by the DIR-UTE was 5.42±0.35%.
Impact: The long T2 signals were sufficiently suppressed with the DIR scheme. The myelin proton fraction in white matter regions quantified by the DIR-UTE was 5.42±0.35%.
Introduction
Myelin is a lipid-rich insulating layer that wraps around axons. It plays a critical role in brain development and maintenance of elaborate cognitive functions (1). The integrity and content of the myelin sheath are directly related to the speed at which neuron signals are transmitted (2,3). Many neurological disorders are characterized by myelin damage and loss (4).MRI has been routinely used in the diagnosis of various neurodegenerative disorders (5-7), but conventional clinical sequences fail to distinguish demyelinated lesions due to a lack of specificity. Therefore, it is important to develop more specific techniques to evaluate myelin changes in clinical practice. However, direct myelin imaging is challenging due to myelin’s ultrashort T2 relaxation times and its much lower proton density compared to long T2 water content in the brain. Sufficient long T2 signal suppression is therefore necessary for selective myelin imaging.
Several ultrashort echo time (UTE) sequences have been developed for selective myelin imaging (8-12); however, robust long T2 suppression remains challenging due to the sequences’ technical limitations or specific absorption rate (SAR) restriction (10-12).
Recently, a study showed that a double inversion recovery prepared UTE (DIR-UTE) sequence can efficiently suppress signals of long T2 tissues with a wide range of T1s and create high contrast for short T2 cortical bone and tendons (13). In this study, we further optimize the DIR-UTE sequence for selective myelin imaging in the brain.
Methods
Figure 1 shows the key features of the 3D DIR-UTE sequence (13). The DIR-UTE sequence utilizes two identical adiabatic full passage (AFP) pulses with carrier frequencies centered on the water peak to invert long T2 magnetization. TI1 is defined by the time between the centers of two AFP pulses while TI2 is defined as the period from the center of the second AFP pulse to the center of the multispoke acquisition. A half-soft pulse is used for signal excitation in each spoke. 3D cones trajectory enables efficient k-space coverage for the DIR-UTE scans (14).This study was approved by the institutional review board at UC San Diego. The DIR-UTE sequence was tested o series of water phantoms designed with different T1s (25, 135, 260, 510, 670, 800, 950, 1150, and 1470ms) and five healthy volunteers (mean age: 31.4 ± 4.0 years, 3 males and 2 females) were recruited for the DIR-UTE scans on a 3T GE MR750 scanner. The T1 values of the phantoms were measured with the 3D UTE-variable flip angle (VFA) sequence with B1 correction (15). To estimate the myelin proton fraction (MPF), a proton density-weighted UTE (PD-UTE) sequence was scanned in conjunction with DIR-UTE.
Phantom imaging was conducted to assess the efficacy of long T2 suppression in DIR-UTE sequence under varying repetition time (TR) settings: TR/TI1/TI2=200/100/45ms, 250/124/54ms, 300/148/64ms, 350/173/72ms, 400/197/81ms, 450/222/89ms, 500/244/96ms, 600/289/110ms, 800/377/133ms, and 1000/458/152ms. The optimal TI1 and TI2 were determined by Eq. [7] in Ref. 13.
For in vivo subject scan, the parameters were : (i) DIR-UTE: TR/TI1/TI2=200/100/47ms, echo time (TE)=0.032ms, flip angle (FA)=20°, number of spokes=5, field-of-view (FOV)=24×24×14.4cm3, matrix=108×108×24, and scan time=20min; (ii) PD-UTE: TR/TE=7/0.032ms, FA=1°, FOV=24×24×14.4cm3, matrix=108×108×24, and scan time=40sec. In addition, a healthy volunteer was scanned with a low-resolution DIR-UTE protocol at different TEs (0.032, 0.2, 0.4, 0.8, and 2.0ms) for T2* measurement.
Results and Discussion
The phantom results are shown in Figure 2. The signals of long T1 water phantoms were efficiently suppressed for a wide range of TRs. As shown in phantom signal intensity curves, the long T1 phantom signals can be better suppressed when a shorter TR is used in DIR-UTE. These results demonstrate the exceptional efficacy of DIR scheme in suppressing long T1 signals.Figure 3A shows the DIR-UTE images with different TEs. The DIR-UTE signals decayed rapidly with longer TEs in brain. A mono-exponential fitting was employed to derive a T2* value of 0.21±0.1 ms in a white matter region, consistent with previously reported values (8-12). These results demonstrate that long T2 signals in the brain can be well-suppressed by DIR-UTE technique.
Figure 4 shows the representative DIR-UTE and PD-UTE images and corresponding macromolecular proton fraction (MPF) maps. Notably, the white matter regions exhibit much higher myelin content than the gray matter regions. In a cohort of five healthy volunteers, the mean MPF values for white matter regions were quantified at 5.42±0.35%.
All these findings provide compelling evidence that the 3D DIR-UTE sequence adeptly suppresses long T2 signals and selectively images short T2 myelin within the human brain.
Conclusion
The 3D DIR-UTE sequence enables selective myelin imaging and quantification in vivo, presenting a promising technique for the evaluation of demyelinating diseases.Acknowledgements
The authors acknowledge grant support from National Institutes of Health (F32AG082458-01, RF1AG075717), VA Research and Development Services (Merit Awards I01CX001388).References
1. Filley CM, Fields RD. White matter and cognition: making the connection. J Neurophysiol 2016; 116:2093-2104.
2. Waxman SG. Conduction in myelinated, unmyelinated, and demyelinated fibers. Archives of Neurology 1977; 34:585-589.
3. Felts PA, Baker TA, Smith KJ. Conduction in segmentally demyelinated mammalian central axons. Journal of Neuroscience 1997; 17:7267-7277
4. Steinman MDL. Multiple sclerosis: a coordinated immunological attack against
myelin in the central nervous system. Cell. (1996) 85(3):299–302. doi: 10.1016/
S0092-8674(00)81107-1
5. Filippi M, Rocca MA. MR imaging of multiple sclerosis. Radiology 2011;259(3):659–681.
6. Killiany RJ, Gomez-Isla T, Moss M, et al. Use of structural magnetic resonance imaging to predict who will get Alzheimer’s disease. Ann Neurol 2000; 47:430-439.
7. Frisoni GB, Fox NC, Jack CR, Scheltens P, Thompson PM. The clinical use of structural MRI in Alzheimer disease. Nat Rev Neurol 2010; 6:67-77.
8. Du J, Ma G, Li S, Carl M, Szeverenyi NM, VandenBerg S, Corey-Bloom J, Bydder GM. Ultrashort echo time (UTE) magnetic resonance imaging of the short T2 components in white matter of the brain using a clinical 3T scanner. Neuroimage. 2014 Feb 15;87:32-41.
9. Jang H, Ma Y, Searleman AC, Carl M, Corey-Bloom J, Chang EY, Du J. Inversion recovery UTE based volumetric myelin imaging in human brain using interleaved hybrid encoding. Magn Reson Med 2020;83:950-61.
10. Ma YJ, Searleman A, Jang H, Wong J, Chang EY, Corey-Bloom J, Bydder GM, Du J. Whole-brain myelin mapping using 3D double echo sliding inversion recovery ultrashort echo time (DESIRE UTE) MRI. Radiology 2020;294:362-74.
11. Ma YJ, Jang H, Wei Z, Cai Z, Xue Y, Lee RR, et al. Myelin Imaging in Human Brain Using a Short Repetition Time Adiabatic Inversion Recovery Prepared Ultrashort Echo Time (STAIR-UTE) MRI Sequence in Multiple Sclerosis. Radiology. 2020;297(2):392-404.
12. Ma YJ, Jang H, Wei Z, Wu M, Chang EY, Corey-Bloom J, et al. Brain ultrashort T2 component imaging using a short TR adiabatic inversion recovery prepared dual-echo ultrashort TE sequence with complex echo subtraction (STAIR-dUTE-ES). J Magn Reson. 2021;323:106898.
13. Ma YJ, Zhu Y, Lu X, Carl M, Chang EY, Du J. Short T2 imaging using a 3D double adiabatic inversion recovery prepared ultrashort echo time cones (3D DIR‐UTE‐Cones) sequence. Magnetic resonance in medicine. 2018 May;79(5):2555-63.
14. Gurney PT, Hargreaves BA, Nishimura DG. Design and analysis of a practical 3D cones trajectory. Magnetic Resonance in Medicine: An Official Journal of the International Society for Magnetic Resonance in Medicine. 2006 Mar;55(3):575-82.
15. Ma YJ, Zhao W, Wan L, Guo T, Searleman A, Jang H, Chang EY, Du J. Whole knee joint T1 values measured in vivo at 3T by combined 3D ultrashort echo time cones actual flip angle and variable flip angle methods. Magnetic resonance in medicine. 2019 Mar;81(3):1634-44.
Figures
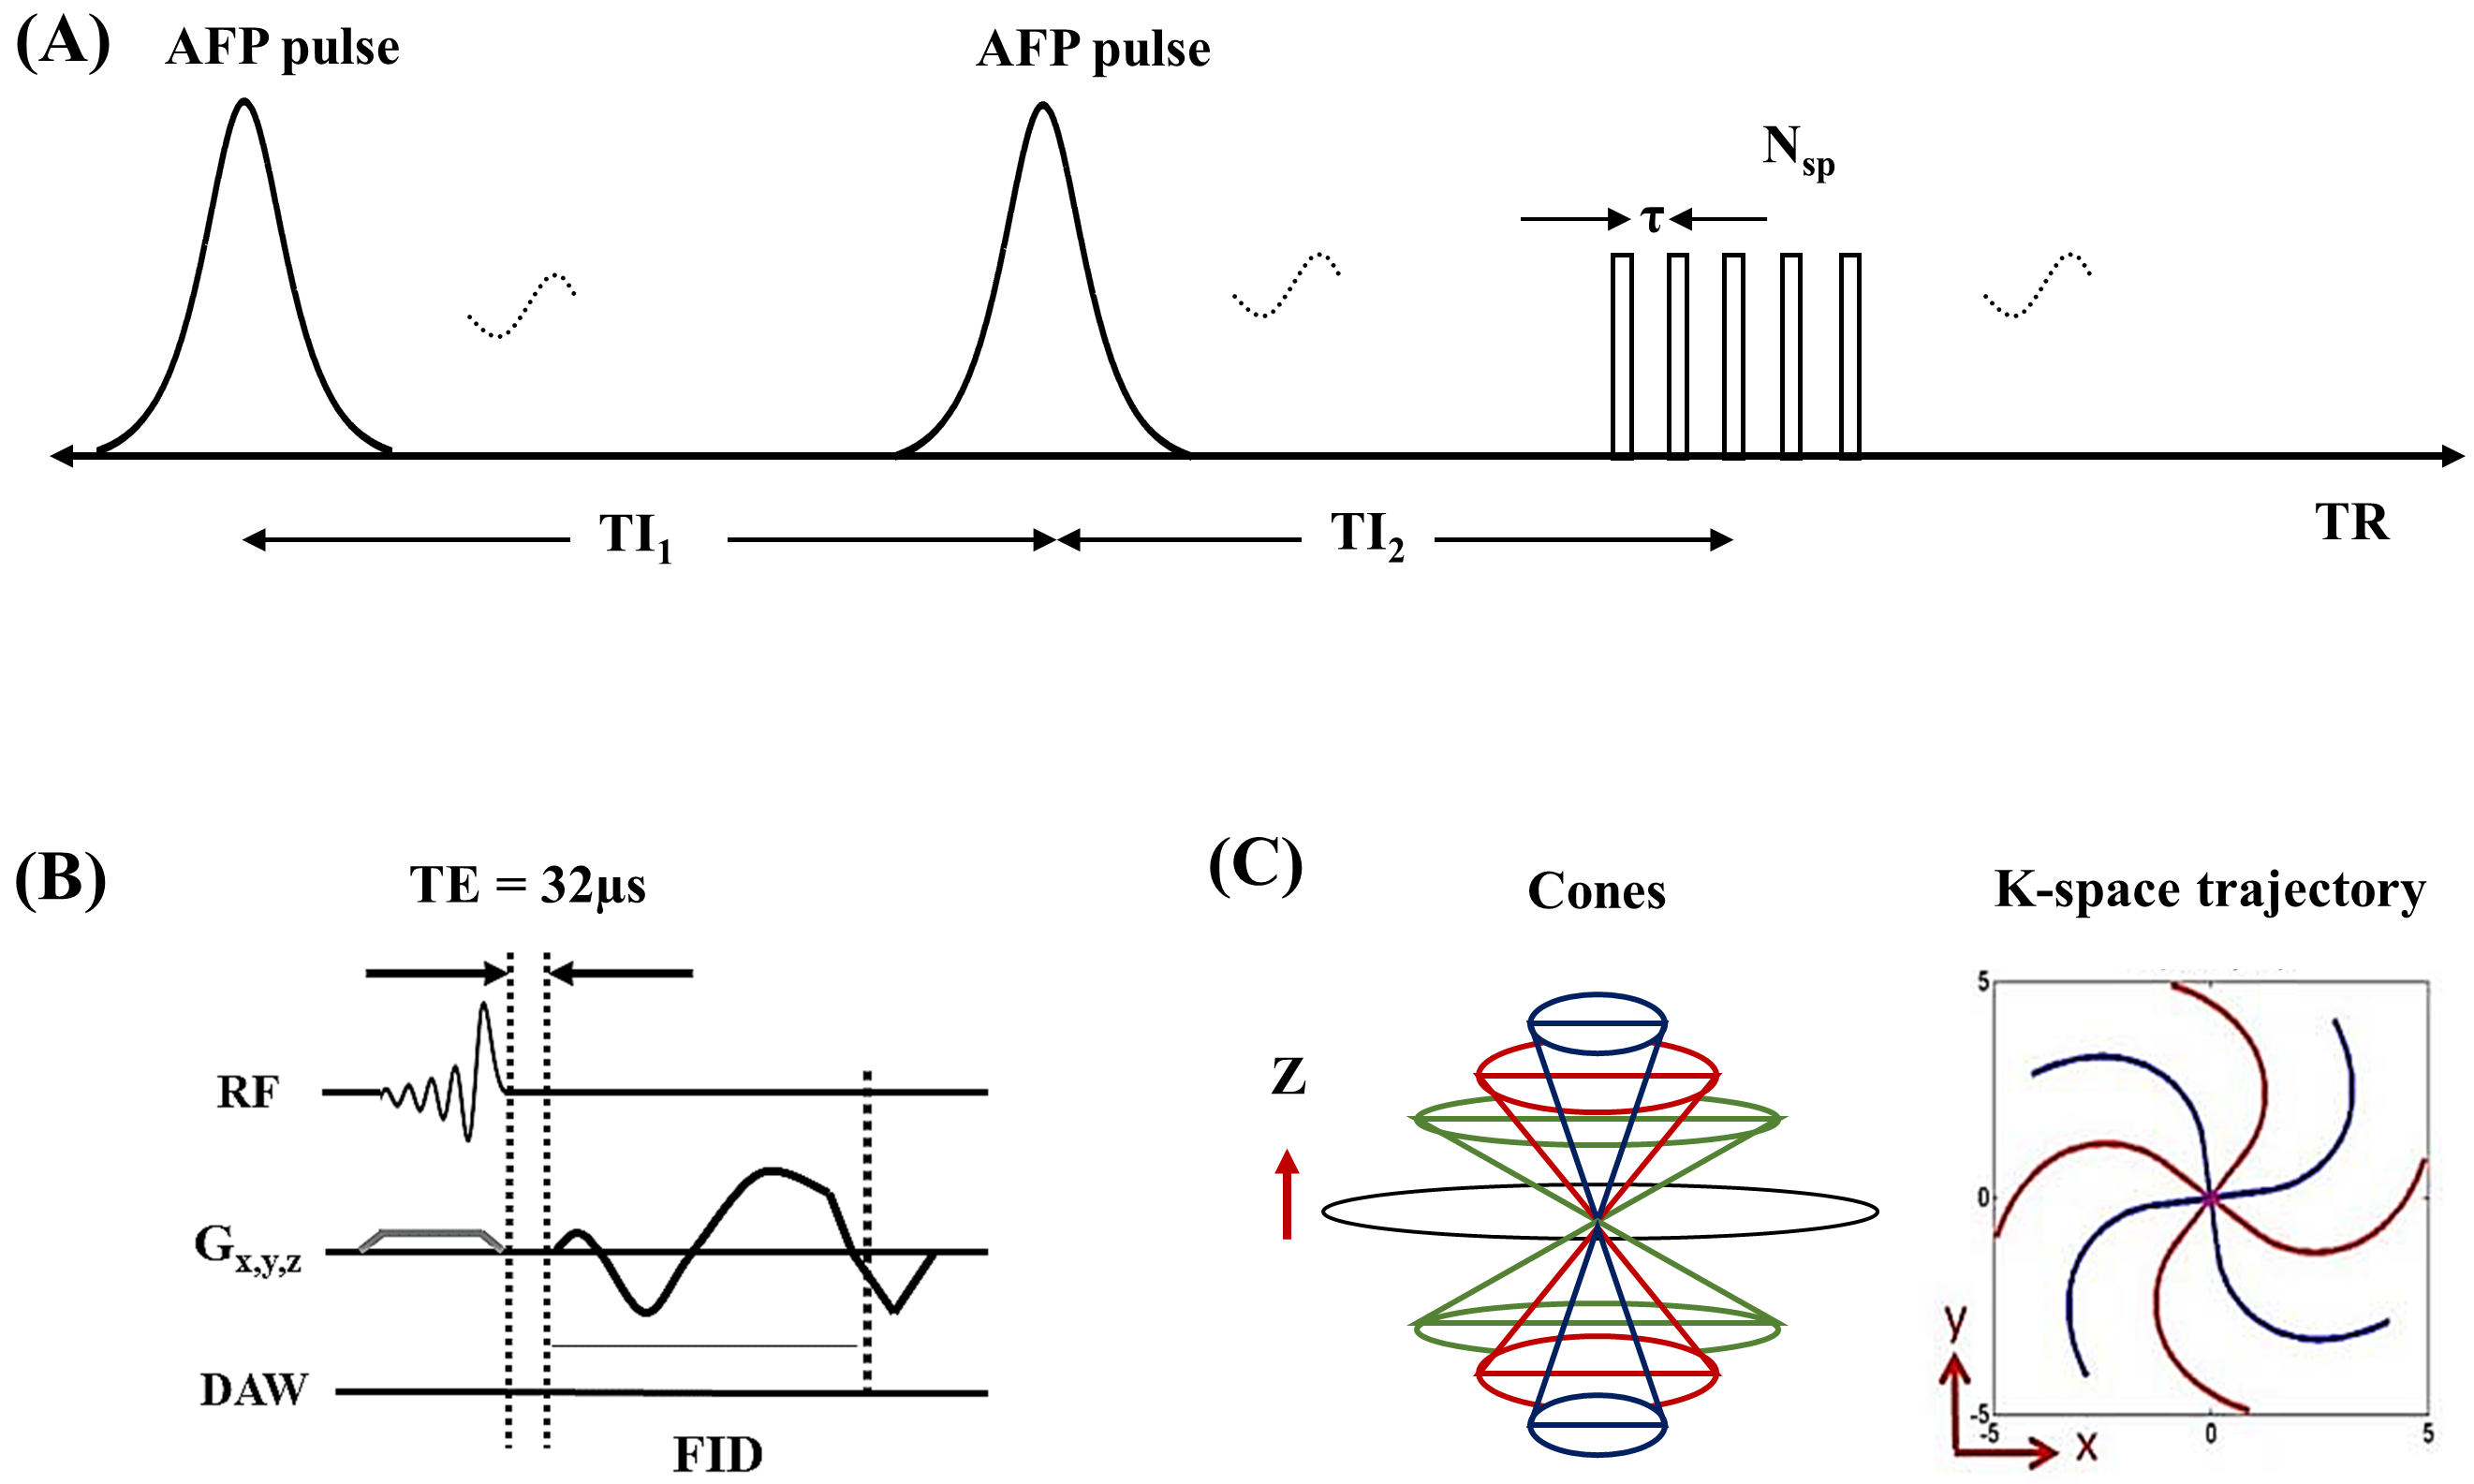
Figure 1. Sequence diagram of the 3D DIR-UTE sequence. The DIR scheme employs two identical AFP pulses to invert long T2 magnetization followed by multispoke UTE acquisition (A). TI1 is defined by the time between the centers of the two AFP pulses while TI2 is defined as the period from the center of the second AFP pulse to the center of the multispoke acquisition. A half-soft pulse is used for signal excitation in each spoke (B). The k-space trajectory is arranged in a conical view ordering (C).
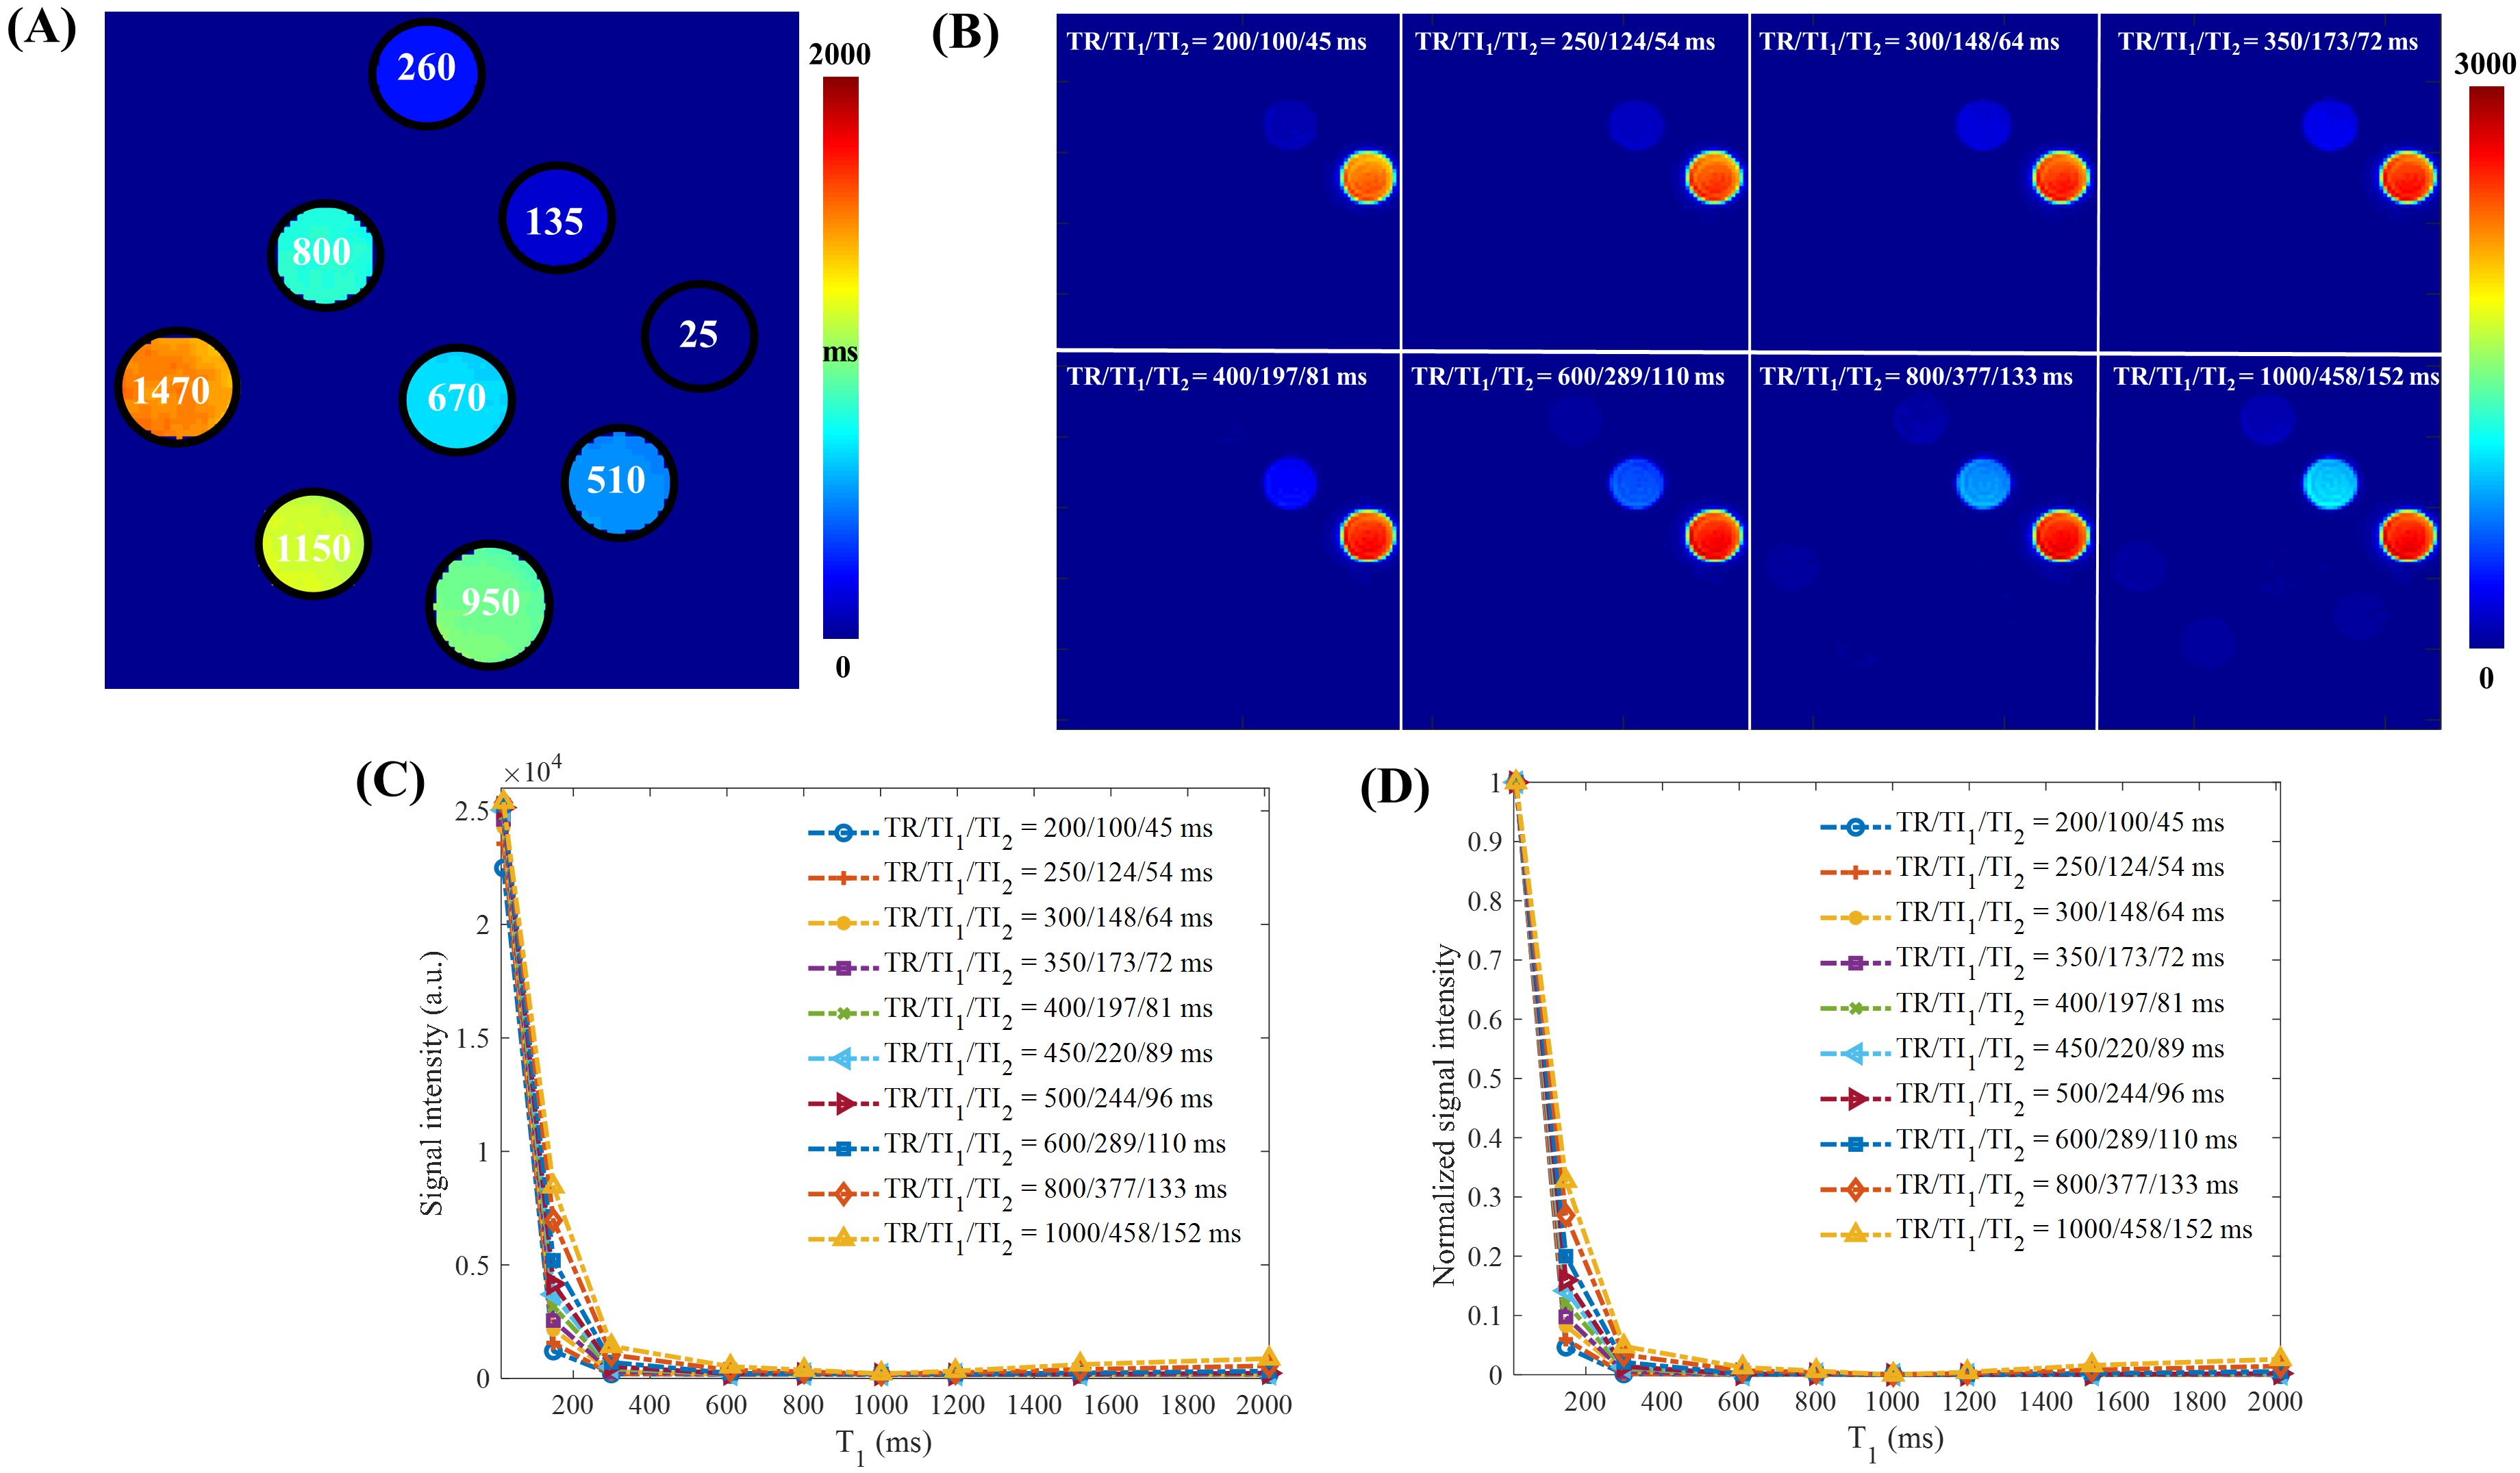
Figure 2. DIR-UTE imaging of water phantoms. Nine phantoms were made with different MnCl2·4H2O concentrations of 0.0055, 0.01, 0.015, 0.0195, 0.0265, 0.0375, 0.085, 0.18, and 1.4828 g/L. The measured phantom T1 values are presented in panel A. Panel B shows the DIR-UTE images with different TR/TI1/TI2 combinations. Panels C and D show the phantom signal intensity curves without and with normalization, respectively. a.u. = arbitrary units.
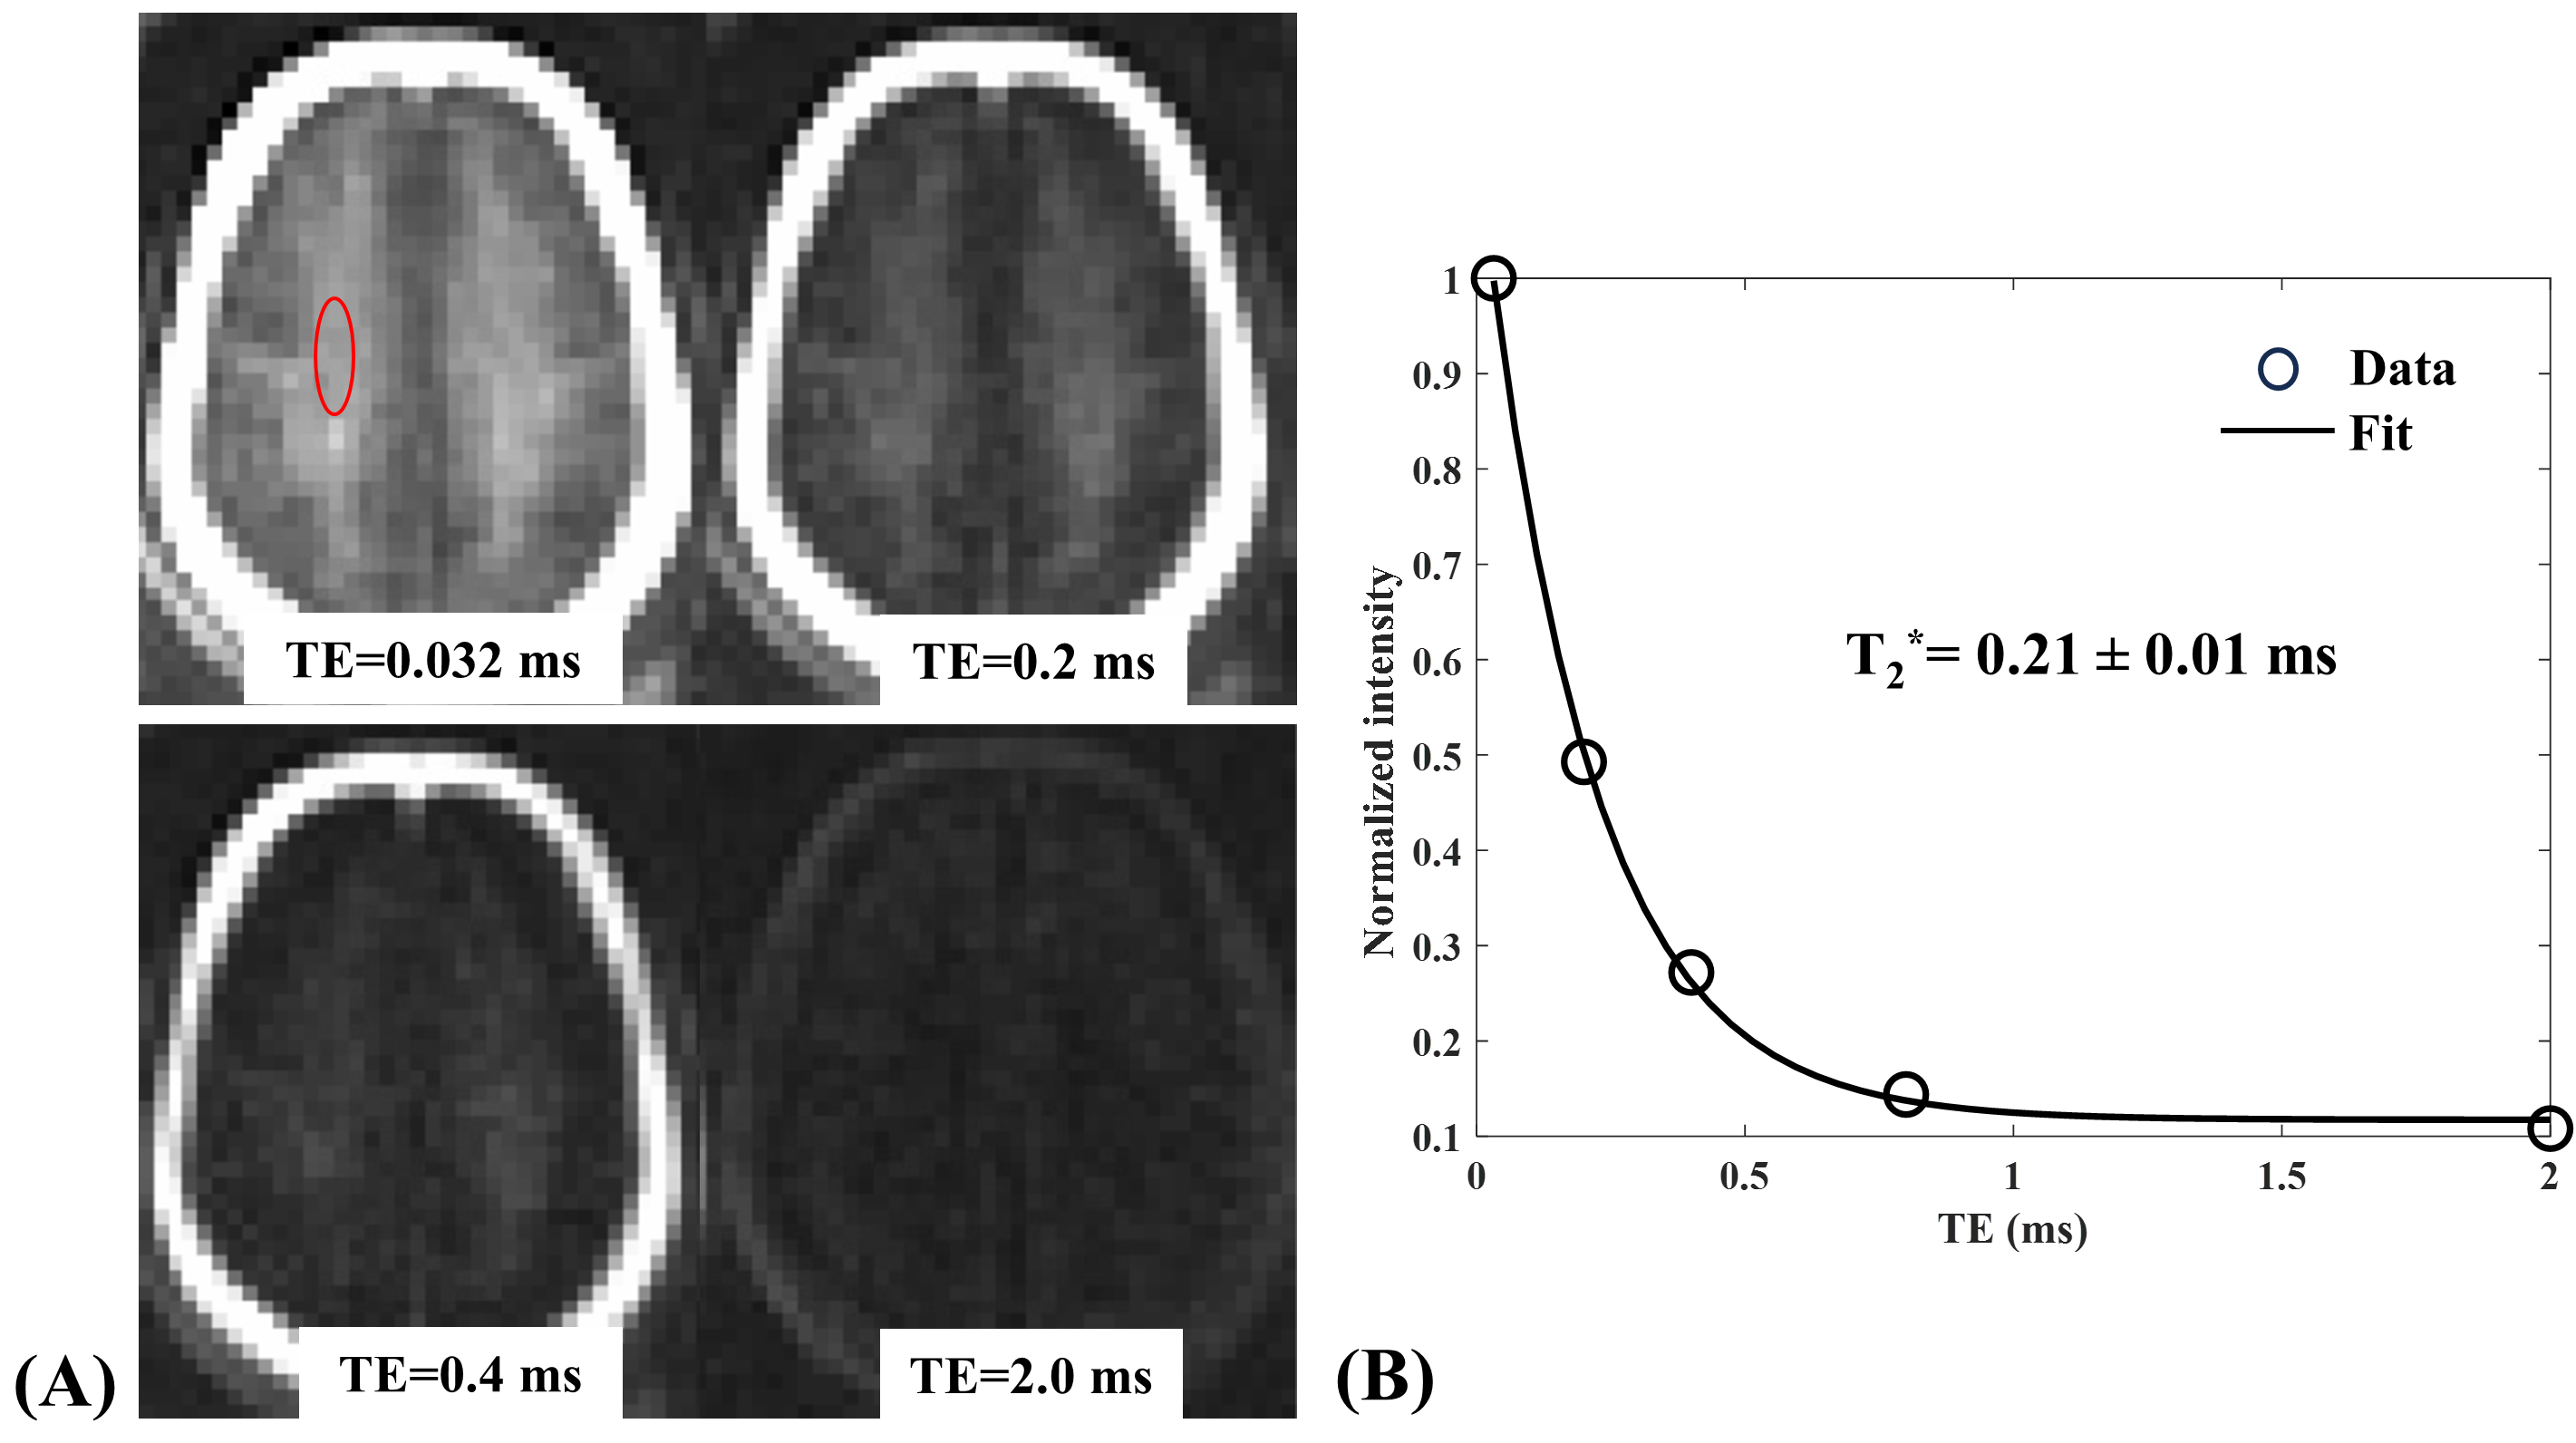
Figure 3. DIR-UTE imaging of in vivo brain with different TEs (i.e., TE=0.032, 0.2, 0.4, and 2.0ms, (A) and a T2* fitting curve for a white matter region (red oval region) (B). Exponential fitting of the white matter signals at different TEs shows a short T2* of 0.21±0.01 ms (B).
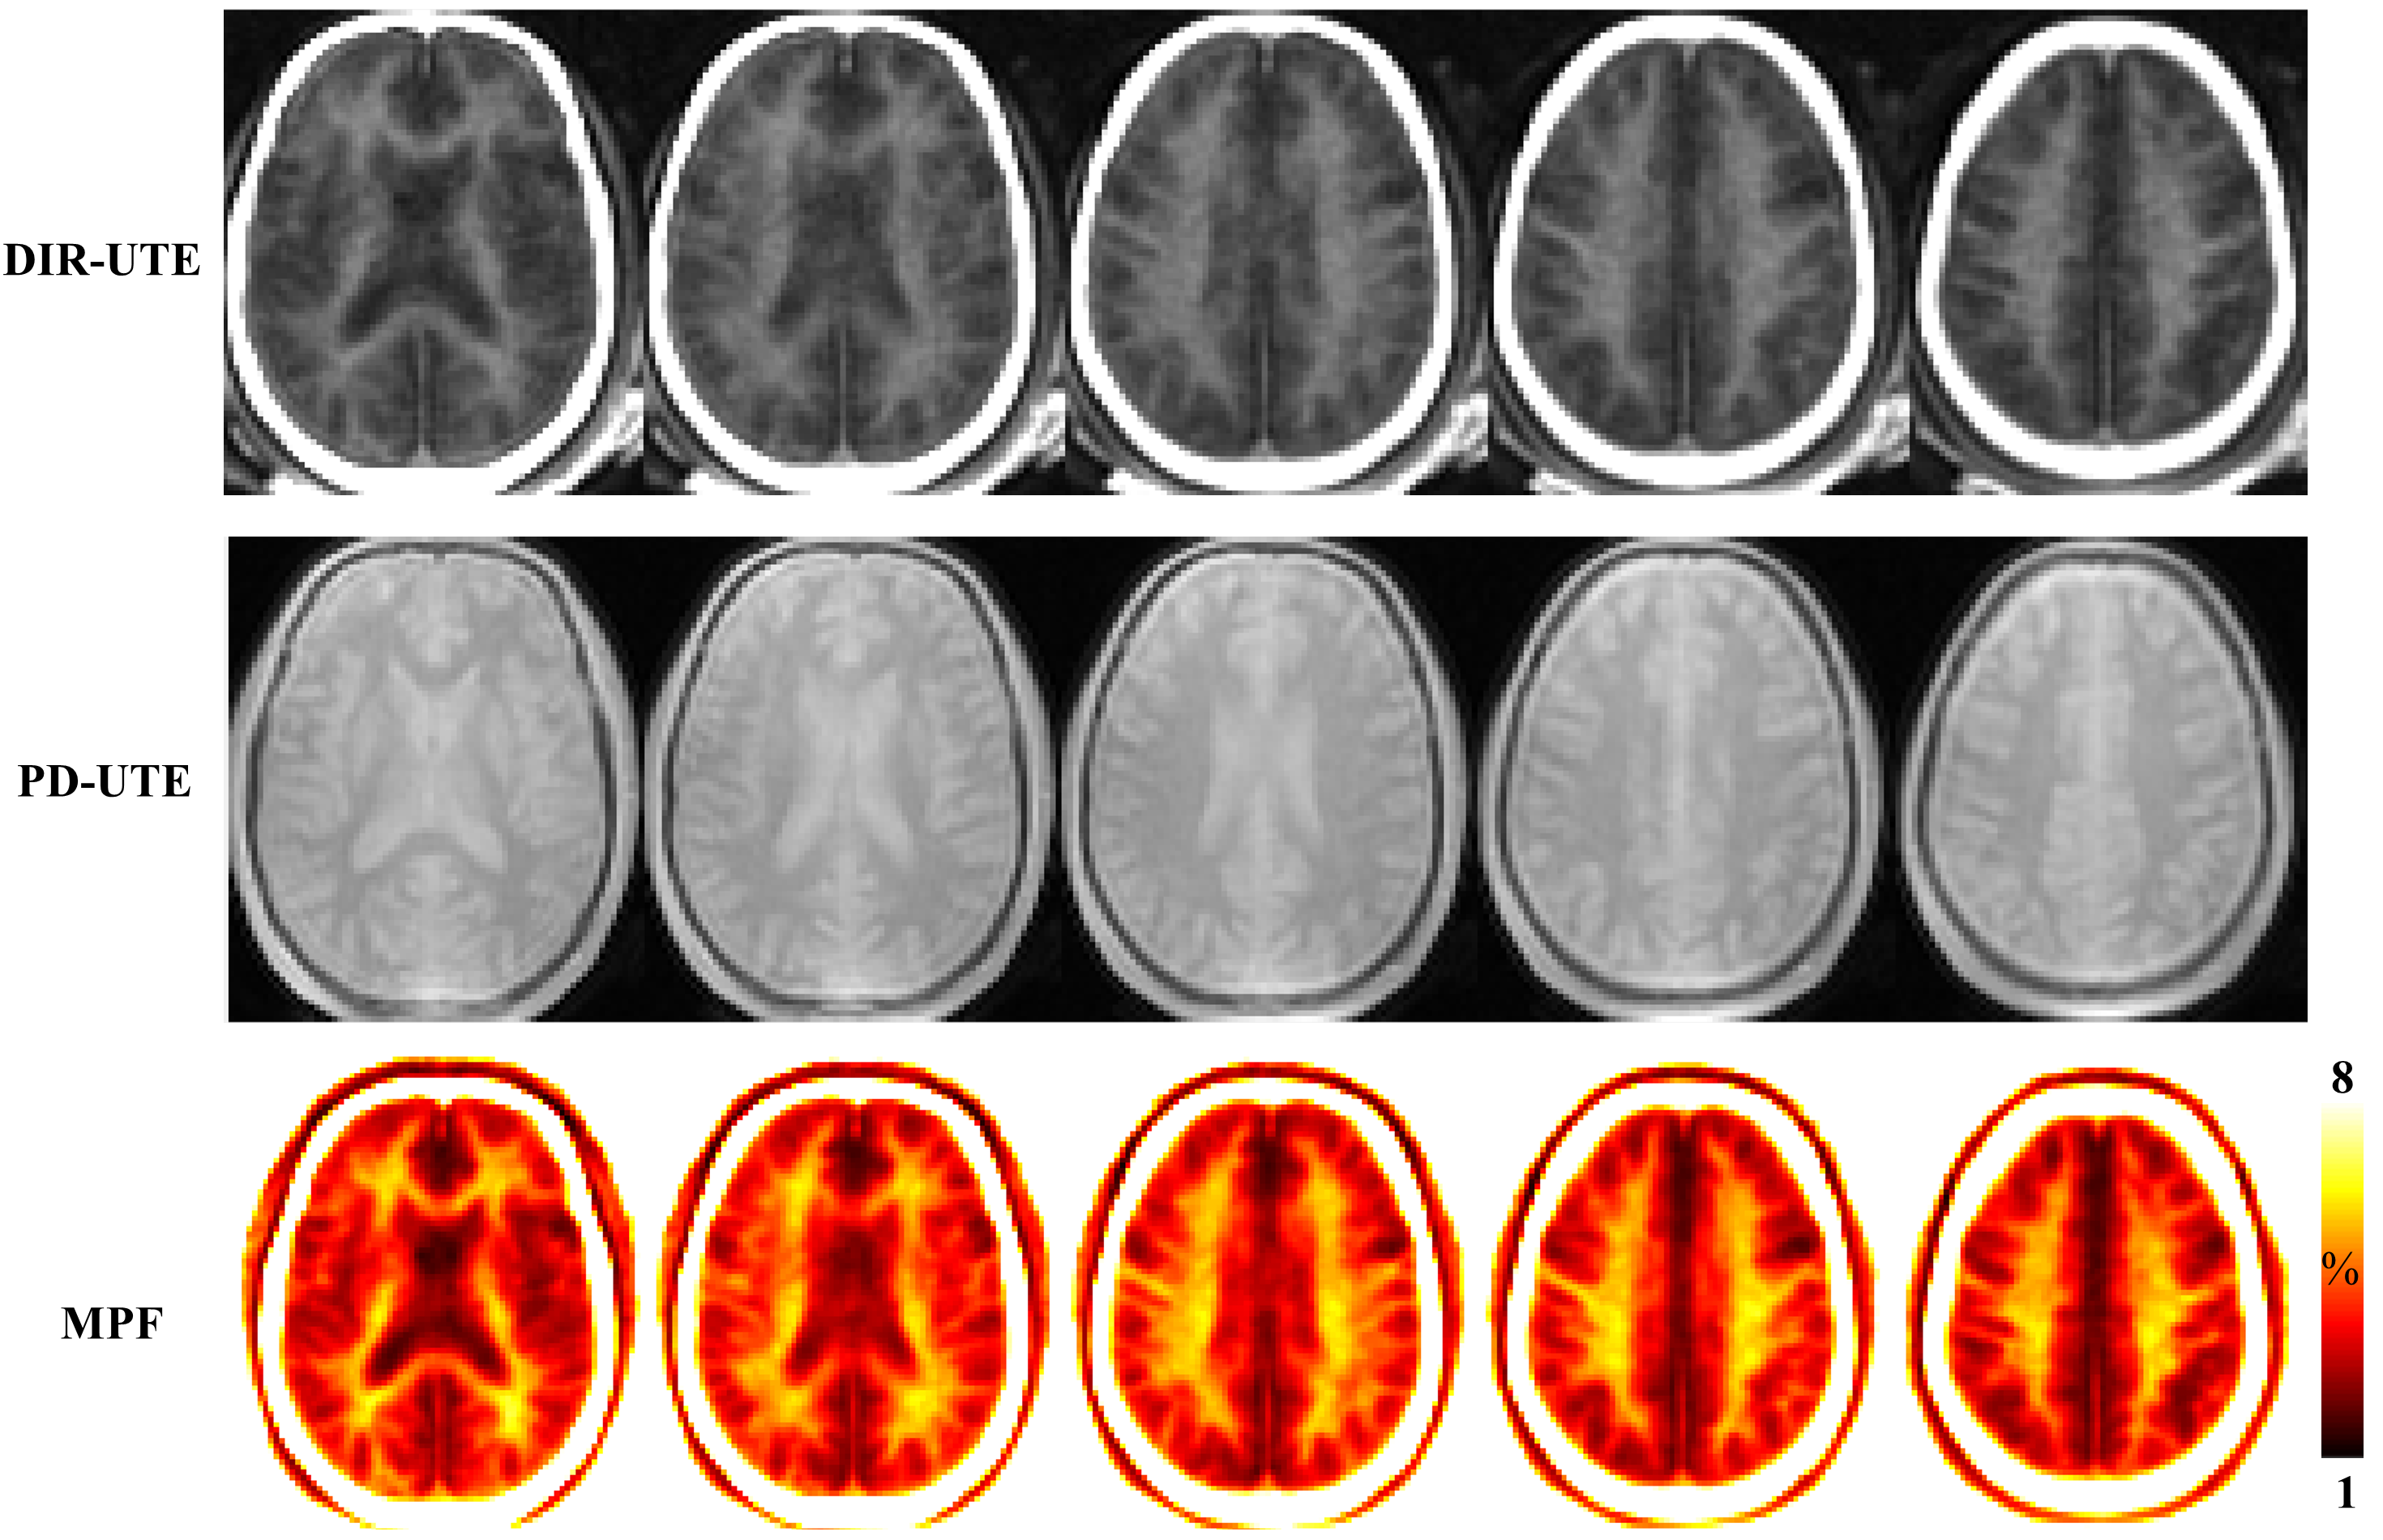
Figure 4. Representative DIR-UTE (first row) and PD-UTE (second row) images as well as corresponding MPF maps (third row) from a 32-year-old healthy male volunteer. MPF in the white matter region is much higher than that of the gray matter region.