2032
1H-MRSI of white matter in cognitively unimpaired elderly for the detection of early Alzheimer’s disease pathological changes1Bernard and Irene Schwartz Center for Biomedical Imaging, Department of Radiology, New York University Grossman School of Medicine, New York, NY, United States, 2Center for Advanced Imaging Innovation and Research (CAI2R), Department of Radiology, New York University Grossman School of Medicine, New York, NY, United States, 3Vilcek Institute of Graduate Biomedical Sciences, New York University Grossman School of Medicine, New York, NY, United States, 4Department of Psychiatry, New York University Grossman School of Medicine, New York, NY, United States, 5Department of Neuroscience and Physiology, New York University Grossman School of Medicine, New York, NY, United States, 6Department of Neurology, New York University Grossman School of Medicine, New York, NY, United States, 7Siemens Medical Solutions USA Inc., Malvern, PA, United States
Synopsis
Keywords: White Matter, White Matter, Aging, Alzheimer's Disease, Spectroscopy
Motivation: APOE4 has been linked to increased amyloid and tau deposition and microstructural WM changes in Alzheimer’s, but despite the major role of APOE in myelination, whether WM metabolism is altered in individuals at risk for Alzheimer’s remains unknown.
Goal(s): To examine if choline, a constituent of myelin and a marker of membrane turnover, is associated with APOE4, CSF p-tau181 (a marker of tau burden), and WM volume (a marker of neurodegeneration).
Approach: Cognitively unimpaired elderly with and without APOE4 underwent 1H-MRSI. Relationships between WM choline, APOE4, tau, and WM volume were assessed.
Results: No associations were found between WM choline and any marker.
Impact: WM metabolism is not associated with genotype, tau, or neurodegeneration in healthy elderly, but given that amyloid deposition is the earliest Alzheimer’s pathological hallmark, additional investigations with amyloid biomarkers are needed to better characterize WM metabolism in the preclinical stage.
Introduction
The apolipoprotein E4 (APOE4) allele, the strongest genetic risk factor for Alzheimer’s disease (AD), is associated with increased deposition of AD pathological hallmarks, amyloid1,2 and tau3,4, even in the brains of cognitively unimpaired (CU) elderly2. Although the role of APOE4 in AD pathogenesis remains unclear, its involvement in amyloid regulation5,6 and myelination7,8 suggest that white matter (WM) impairments may underlie normal-appearing WM in healthy APOE4 carriers. Indeed, DTI studies have shown evidence of widespread WM microstructural alterations in the earliest phases of the disease continuum9, possibly mediated by amyloid burden10. Despite these increasing efforts to understand WM degeneration in AD, which was historically considered a disease of the gray matter (GM)11, whether WM metabolism is altered in CU elderly at risk for AD remains unexplored. Given that choline (Cho), measured from 1H-MRS, is both predominately found in WM and an established marker of membrane synthesis and degradation12, identifying changes to levels of this metabolite may help better understand cellular mechanisms underlying WM pathology along the AD continuum. We therefore performed whole-brain 1H-MRSI in CU elderly to examine whether elevated levels of WM Cho were associated with (i) APOE4 carriership; (ii) elevated CSF p-tau181, a marker of tau burden13; (iii) reduced total WM volume, which may reflect demyelination14,15; and (iv) enlarged WM hyperintensity (WMH) volume, a marker of small-vessel disease16,17 that has been linked to cognitive impairment in AD18,19.Materials and Methods
Thirty-four CU elderly underwent APOE genotyping, CSF p-tau181 collection via a lumbar puncture, and an MRI exam at 3T (Table 1). MPRAGE images were processed using FreeSurfer’s20 automatic segmentation pipeline to yield GM and WM masks (Fig. 1A) and their volumes in mm3, which were then normalized to each subjects’ estimated total intracranial volume to correct for variations in head size21,22. MPRAGE and FLAIR images were also processed using the lesion growth algorithm (LGA) in the Lesion Segmentation Tool (LST)23 to compute WMH probability maps that were then binarized to generate WMH masks (Fig. 1A). After visual inspection, each subject’s GM and WMH masks were inflated by 3 mm along the outer boundary (Fig. 1B) and then subtracted from their WM mask to account for partial volume effects, resulting in an “eroded” mask containing only normal-appearing WM (Fig. 1C). EPSI images were processed through MIDAS24 to generate volumetric metabolite maps of Cho, creatine (Cr), glutamate-plus-glutamine (Glx), myo-inositol (mI), and N-acetylaspartate (NAA) (Fig. 1D). WM masks were then mapped to metabolite maps in spectral integration to yield WM metabolite levels calculated as a ratio to the internal water signal (institutional units, i.u.).Spearman’s correlations with and without age-adjustment were used to examine associations between metabolite levels and CSF p-tau181, total WM, and WMH volumes. An age-adjusted ANCOVA was used to assess group differences between APOE4 carriers (defined as having at least one E4 allele) and non-carriers, across WM metabolite levels. Statistical significance was defined as p<0.05.
Results
Participant characteristics are compiled in Table 2. We observed no significant relationships between APOE4 and levels of any metabolite when controlling for age (Fig. 2), and found only small effects of age for Cr (F(1,29)=4.91, p=0.035, partial h2<0.01) and Glx (F(1,29)=6.72, p=0.015, partial h2=0.02). We observed no significant correlations between levels of any metabolite and CSF p-tau181 (Fig. 3A), total WM volume (Fig. 3B), or WMH volume (Fig. 3C).Discussion
Although there have been increasing radiological and histological evidence of myelin damage and impaired oligodendrocyte function as early events in AD25, we found no associations between levels of WM Cho (or any other metabolite) and measures that reflect possible underlying mechanisms of AD pathophysiology: APOE4 genotype, elevated CSF p-tau181 levels, reduced total WM and enlarged WMH volumes.Given that a previous 1H-MRS study of a similar cohort found an association between increased ratios of WM Cho to Cr and the development of dementia within four years26, our negative findings indicate that alterations in WM metabolism may simply be independent of tau and neuronal injury prior to the development of WM atrophy. Of note, tau accumulation and neurodegeneration are observed later along the AD continuum (as individuals begin to exhibit cognitive decline), whereas amyloid deposition is often regarded as the earliest pathological feature of AD27. Future studies, therefore, should investigate the relationship between WM metabolism and amyloid, using established amyloid biomarkers13, to fully characterize WM metabolism in the preclinical stage.
Acknowledgements
This work was supported by a pilot grant to Dr. Kirov (P30AG008051) from the Alzheimer’s Disease Research Center (P30AG066512) at New York University Langone Health.References
1 Baek, M. S. et al. Effect of APOE epsilon4 genotype on amyloid-beta and tau accumulation in Alzheimer's disease. Alzheimers Res Ther 12, 140 (2020). https://doi.org:10.1186/s13195-020-00710-6
2 Yamazaki, Y., Zhao, N., Caulfield, T. R., Liu, C.-C. & Bu, G. Apolipoprotein E and Alzheimer disease: pathobiology and targeting strategies. Nature Reviews Neurology 15, 501-518 (2019). https://doi.org:10.1038/s41582-019-0228-7
3 Koutsodendris, N. et al. Neuronal APOE4 removal protects against tau-mediated gliosis, neurodegeneration and myelin deficits. Nature Aging 3, 275-296 (2023). https://doi.org:10.1038/s43587-023-00368-3
4 Dincer, A. et al. APOE ε4 genotype, amyloid-β, and sex interact to predict tau in regions of high APOE mRNA expression. Sci Transl Med 14, eabl7646 (2022). https://doi.org:10.1126/scitranslmed.abl7646
5 Williams, T., Borchelt, D. R. & Chakrabarty, P. Therapeutic approaches targeting Apolipoprotein E function in Alzheimer’s disease. Molecular Neurodegeneration 15, 8 (2020). https://doi.org:10.1186/s13024-020-0358-9
6 Liu, C. C. et al. ApoE4 Accelerates Early Seeding of Amyloid Pathology. Neuron 96, 1024-1032.e1023 (2017). https://doi.org:10.1016/j.neuron.2017.11.013
7 Cheng, G. W. et al. Apolipoprotein E ε4 Mediates Myelin Breakdown by Targeting Oligodendrocytes in Sporadic Alzheimer Disease. J Neuropathol Exp Neurol 81, 717-730 (2022). https://doi.org:10.1093/jnen/nlac054
8 Bagepally, B. S. et al. Apolipoprotein E4 and Brain White Matter Integrity in Alzheimer’s Disease: Tract-Based Spatial Statistics Study under 3-Tesla MRI. Neurodegenerative Diseases 10, 145-148 (2012). https://doi.org:10.1159/000334761
9 Wang, X. et al. Neuroimaging advances regarding subjective cognitive decline in preclinical Alzheimer’s disease. Molecular Neurodegeneration 15, 55 (2020). https://doi.org:10.1186/s13024-020-00395-3
10 Collij, L. E. et al. White matter microstructure disruption in early stage amyloid pathology. Alzheimers Dement (Amst) 13, e12124 (2021). https://doi.org:10.1002/dad2.12124
11 Thompson, P. M. et al. Dynamics of gray matter loss in Alzheimer's disease. J Neurosci 23, 994-1005 (2003). https://doi.org:10.1523/JNEUROSCI.23-03-00994.2003
12 van der Graaf, M. In vivo magnetic resonance spectroscopy: basic methodology and clinical applications. European Biophysics Journal 39, 527-540 (2010). https://doi.org:10.1007/s00249-009-0517-y
13 Jack, C. R., Jr. et al. NIA-AA Research Framework: Toward a biological definition of Alzheimer's disease. Alzheimer's & dementia : the journal of the Alzheimer's Association 14, 535-562 (2018). https://doi.org:10.1016/j.jalz.2018.02.018
14 Liu, H. et al. Aging of cerebral white matter. Ageing Res Rev 34, 64-76 (2017). https://doi.org:10.1016/j.arr.2016.11.006
15 Guo, X. et al. Voxel-based assessment of gray and white matter volumes in Alzheimer's disease. Neurosci Lett 468, 146-150 (2010). https://doi.org:10.1016/j.neulet.2009.10.086
16 Provenzano, F. A. et al. White matter hyperintensities and cerebral amyloidosis: necessary and sufficient for clinical expression of Alzheimer disease? JAMA Neurol 70, 455-461 (2013). https://doi.org:10.1001/jamaneurol.2013.1321
17 Lorenzini, L. et al. Regional associations of white matter hyperintensities and early cortical amyloid pathology. Brain Communications 4 (2022). https://doi.org:10.1093/braincomms/fcac150
18 Salvadó, G. et al. Spatial patterns of white matter hyperintensities associated with Alzheimer’s disease risk factors in a cognitively healthy middle-aged cohort. Alzheimer's Research & Therapy 11, 12 (2019). https://doi.org:10.1186/s13195-018-0460-1
19 Rizvi, B. et al. The effect of white matter hyperintensities on cognition is mediated by cortical atrophy. Neurobiol Aging 64, 25-32 (2018). https://doi.org:10.1016/j.neurobiolaging.2017.12.006
20 Fischl, B. FreeSurfer. Neuroimage 62, 774-781 (2012). https://doi.org:10.1016/j.neuroimage.2012.01.021
21 Voevodskaya, O. et al. The effects of intracranial volume adjustment approaches on multiple regional MRI volumes in healthy aging and Alzheimer's disease. Front Aging Neurosci 6, 264 (2014). https://doi.org:10.3389/fnagi.2014.00264
22 Sämann, P. G. et al. FreeSurfer-based segmentation of hippocampal subfields: A review of methods and applications, with a novel quality control procedure for ENIGMA studies and other collaborative efforts. Hum Brain Mapp 43, 207-233 (2022). https://doi.org:10.1002/hbm.25326
23 Schmidt, P. et al. An automated tool for detection of FLAIR-hyperintense white-matter lesions in Multiple Sclerosis. NeuroImage 59, 3774-3783 (2012). https://doi.org:https://doi.org/10.1016/j.neuroimage.2011.11.032
24 Maudsley, A. A. et al. Comprehensive processing, display and analysis for in vivo MR spectroscopic imaging. NMR Biomed 19, 492-503 (2006). https://doi.org:10.1002/nbm.1025
25 Nasrabady, S. E., Rizvi, B., Goldman, J. E. & Brickman, A. M. White matter changes in Alzheimer’s disease: a focus on myelin and oligodendrocytes. Acta Neuropathologica Communications 6, 22 (2018). https://doi.org:10.1186/s40478-018-0515-3
26 den Heijer, T. et al. MR spectroscopy of brain white matter in the prediction of dementia. Neurology 66, 540-544 (2006). https://doi.org:10.1212/01.wnl.0000198256.54809.0e
27 Luo, J. et al. Sequence of Alzheimer disease biomarker changes in cognitively normal adults: A cross-sectional study. Neurology 95, e3104-e3116 (2020). https://doi.org:10.1212/wnl.0000000000010747
Figures
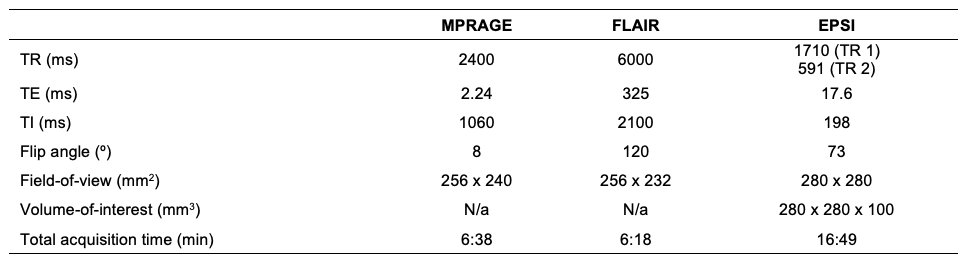
Table 1. Imaging was conducted at 3 Tesla using a 20-channel transmit-receive head coil (MAGNETOM Prisma, Siemens Healthcare, Erlangen, Germany). The protocol included T1-weighted magnetization prepared rapid gradient echo (MPRAGE) and T2-weighted fluid-attenuated inversion recovery (FLAIR) sequences for spatial registration and clinical review, and an echo-planar spectroscopic imaging (EPSI) prototype sequence for metabolite data acquisition.
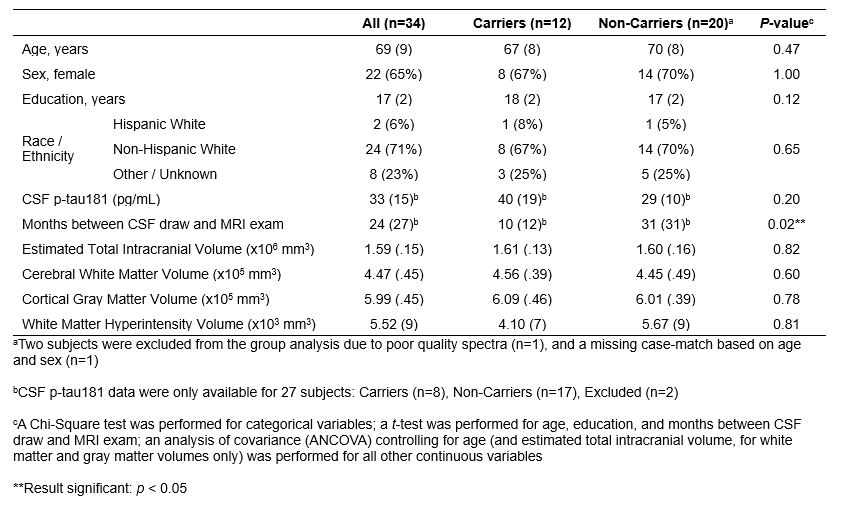
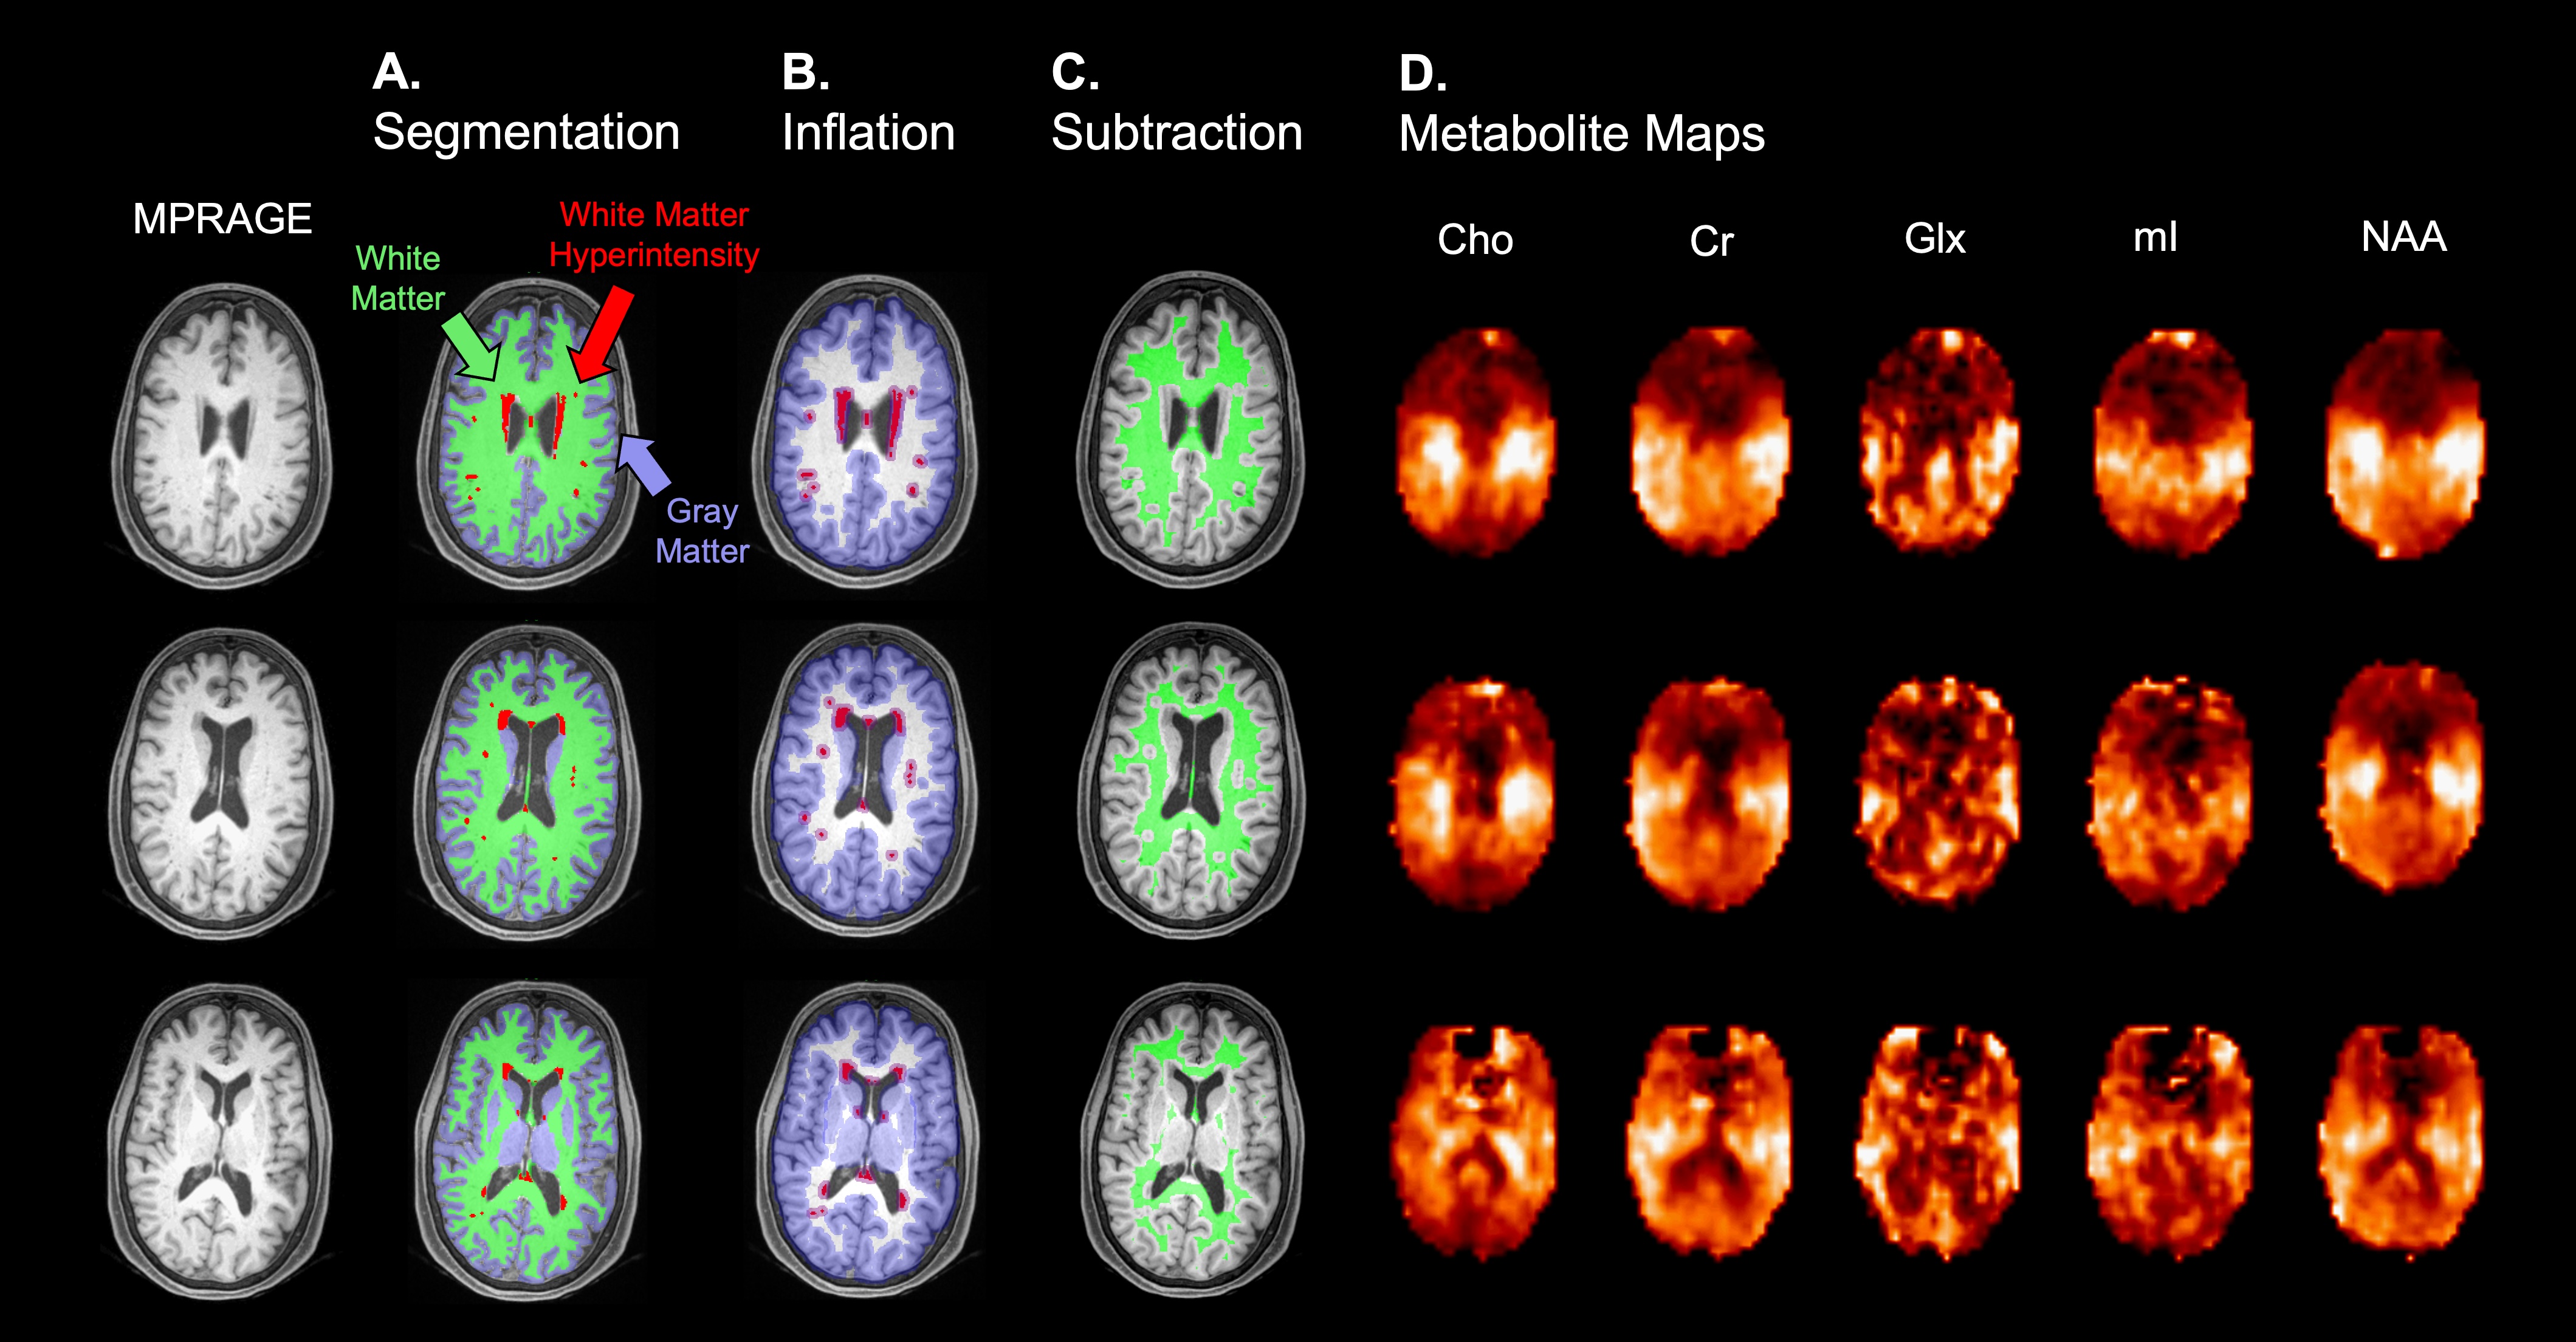
Figure 1. MPRAGE scans were automatically segmented into (A) cortical and subcortical gray matter (GM) and white matter (WM) using FreeSurfer20, and into WM hyperintensities (WMH) using LST23. (B) An outer boundary inflation of 3 mm was performed on GM and WMH masks, which were then (C) subtracted from the FreeSurfer-generated WM mask to yield an “eroded” mask containing only normal-appearing WM. (D) Volumetric metabolite maps of choline (Cho), creatine (Cr), glutamate-plus-glutamine (Glx), myo-inositol (mI), and N-acetylaspartate (NAA) were generated through MIDAS24.
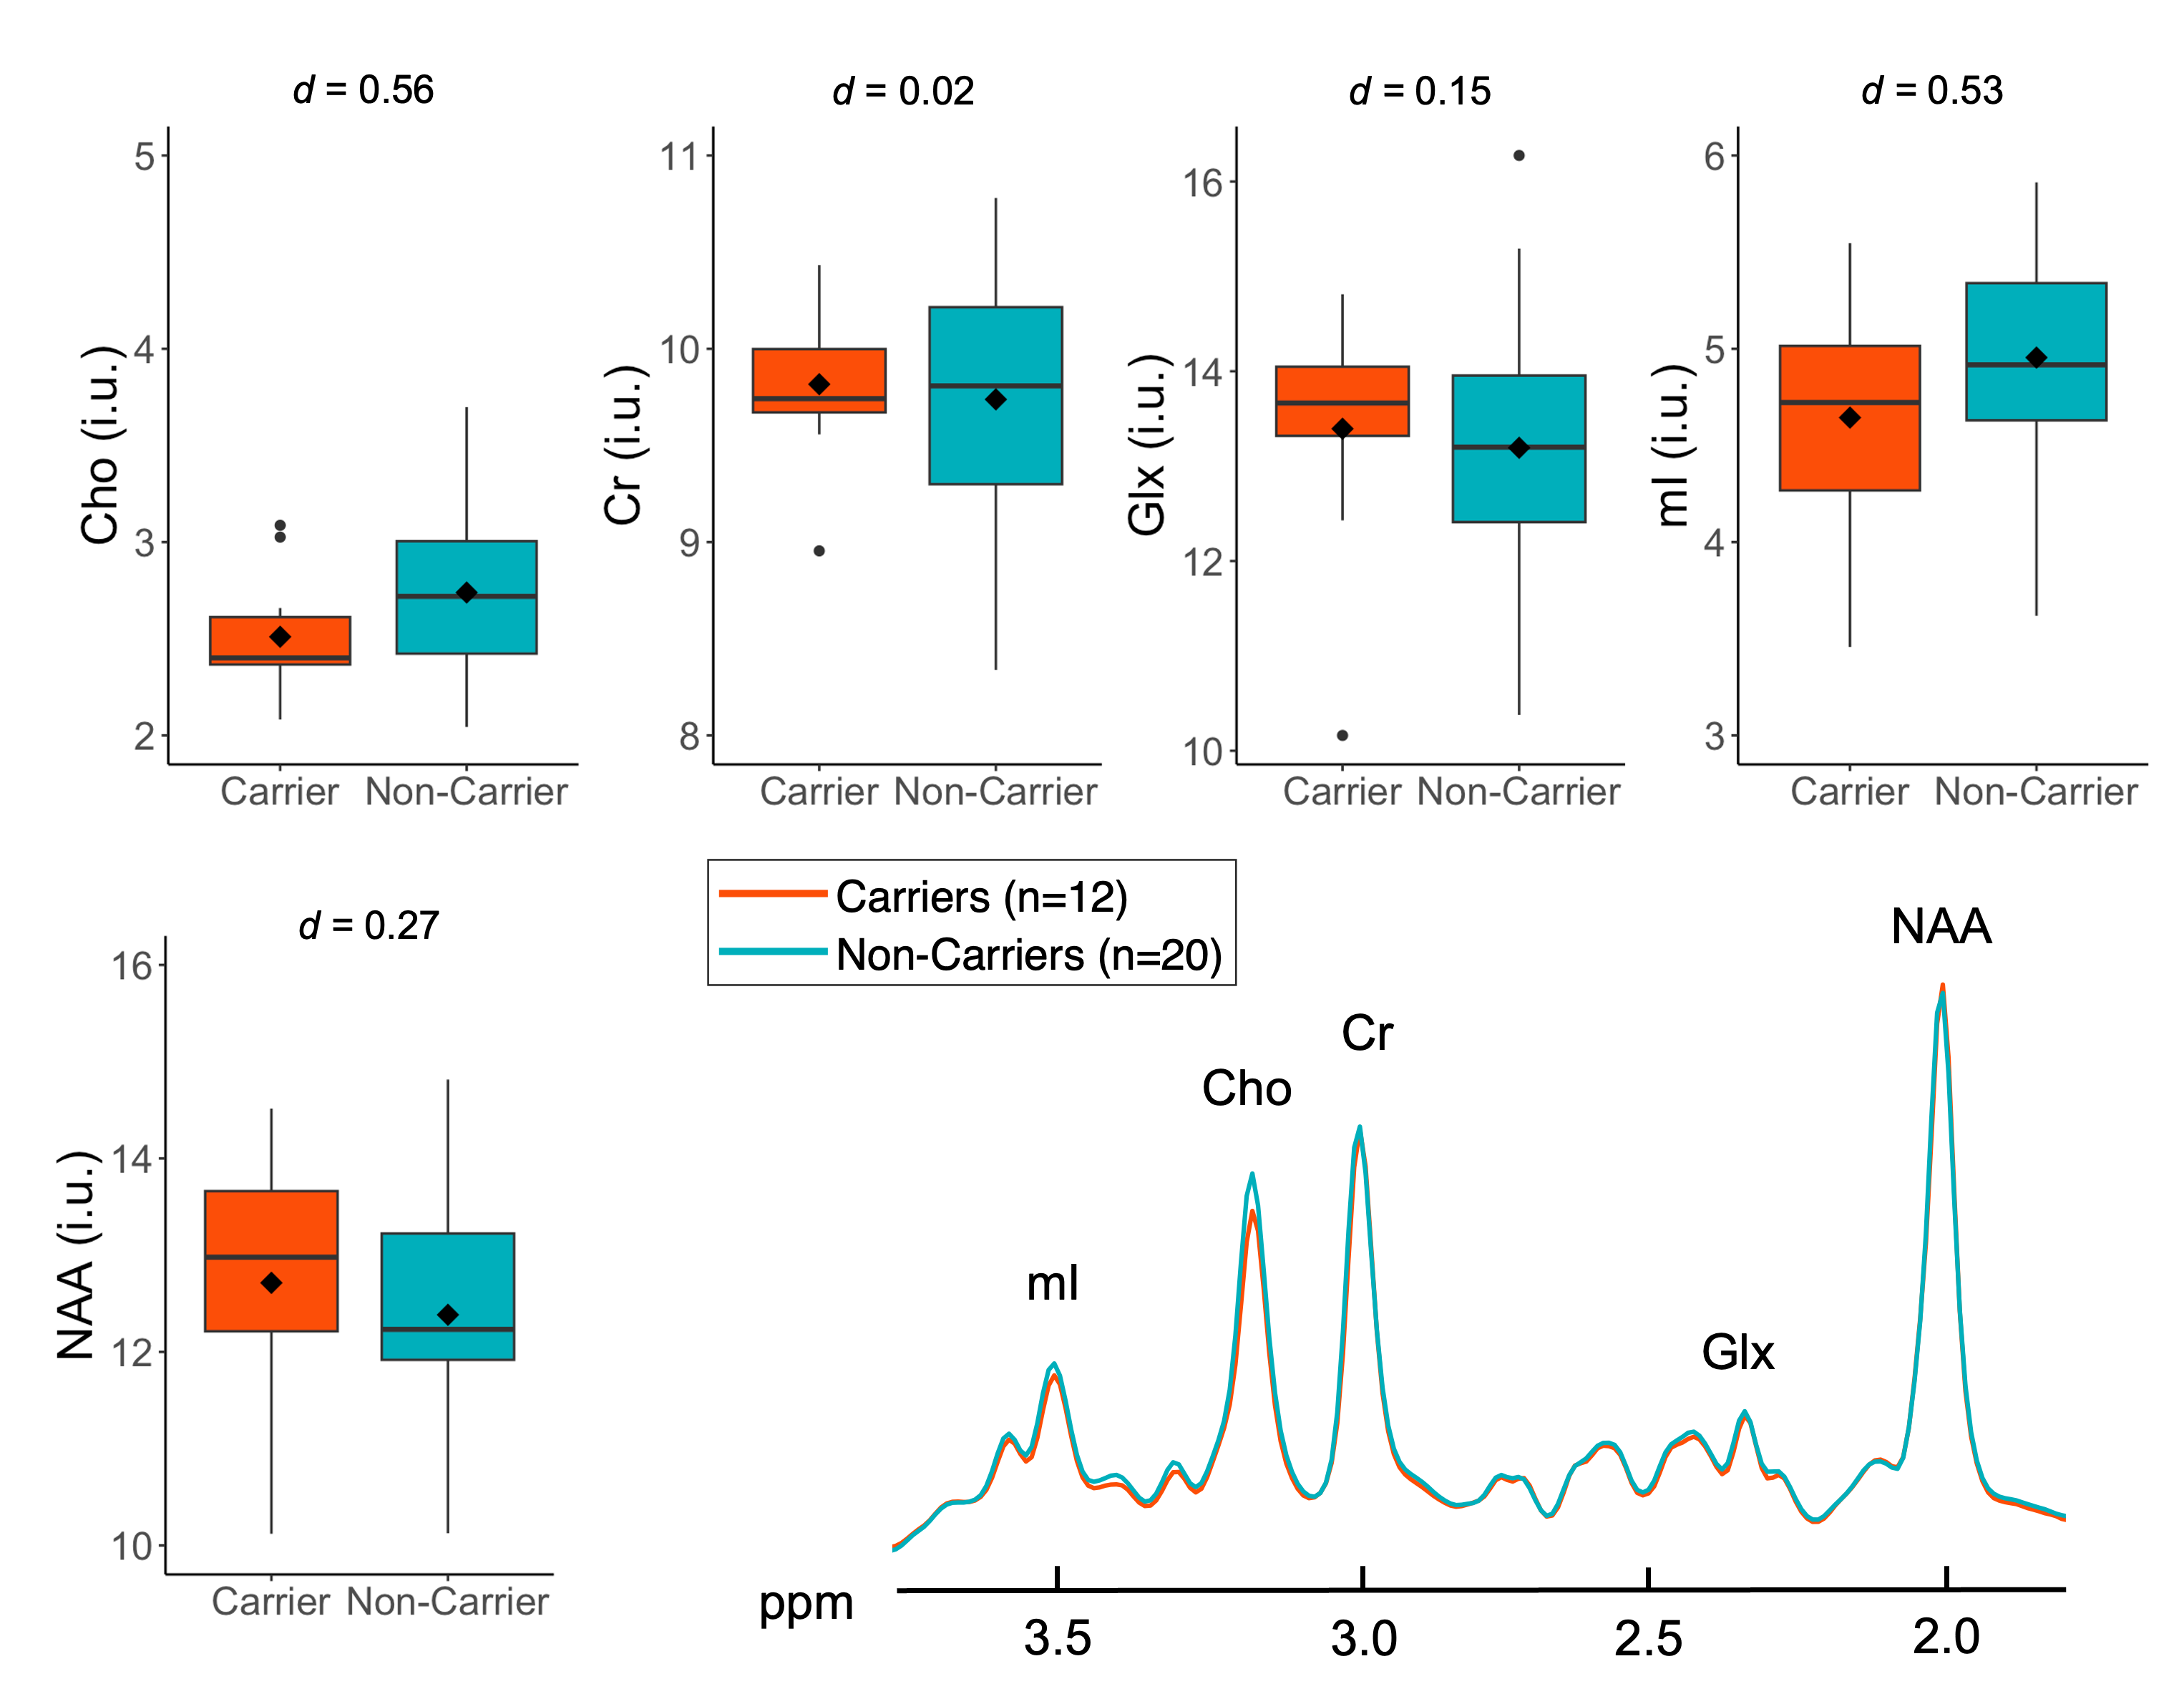
Figure 2. Boxplots of white matter (WM) metabolite distributions in Carriers vs. Non-Carriers. No significant relationships were observed when controlling for age, although we note moderate magnitudes of effect for Cho and mI (Cohen’s d > 0.5). Averaged WM spectra from Carriers and Non-Carriers were overlaid on the same frequency and intensity scales (bottom right). Note, visually, the lower Cho peak amplitude in Carriers compared to Non-Carriers.
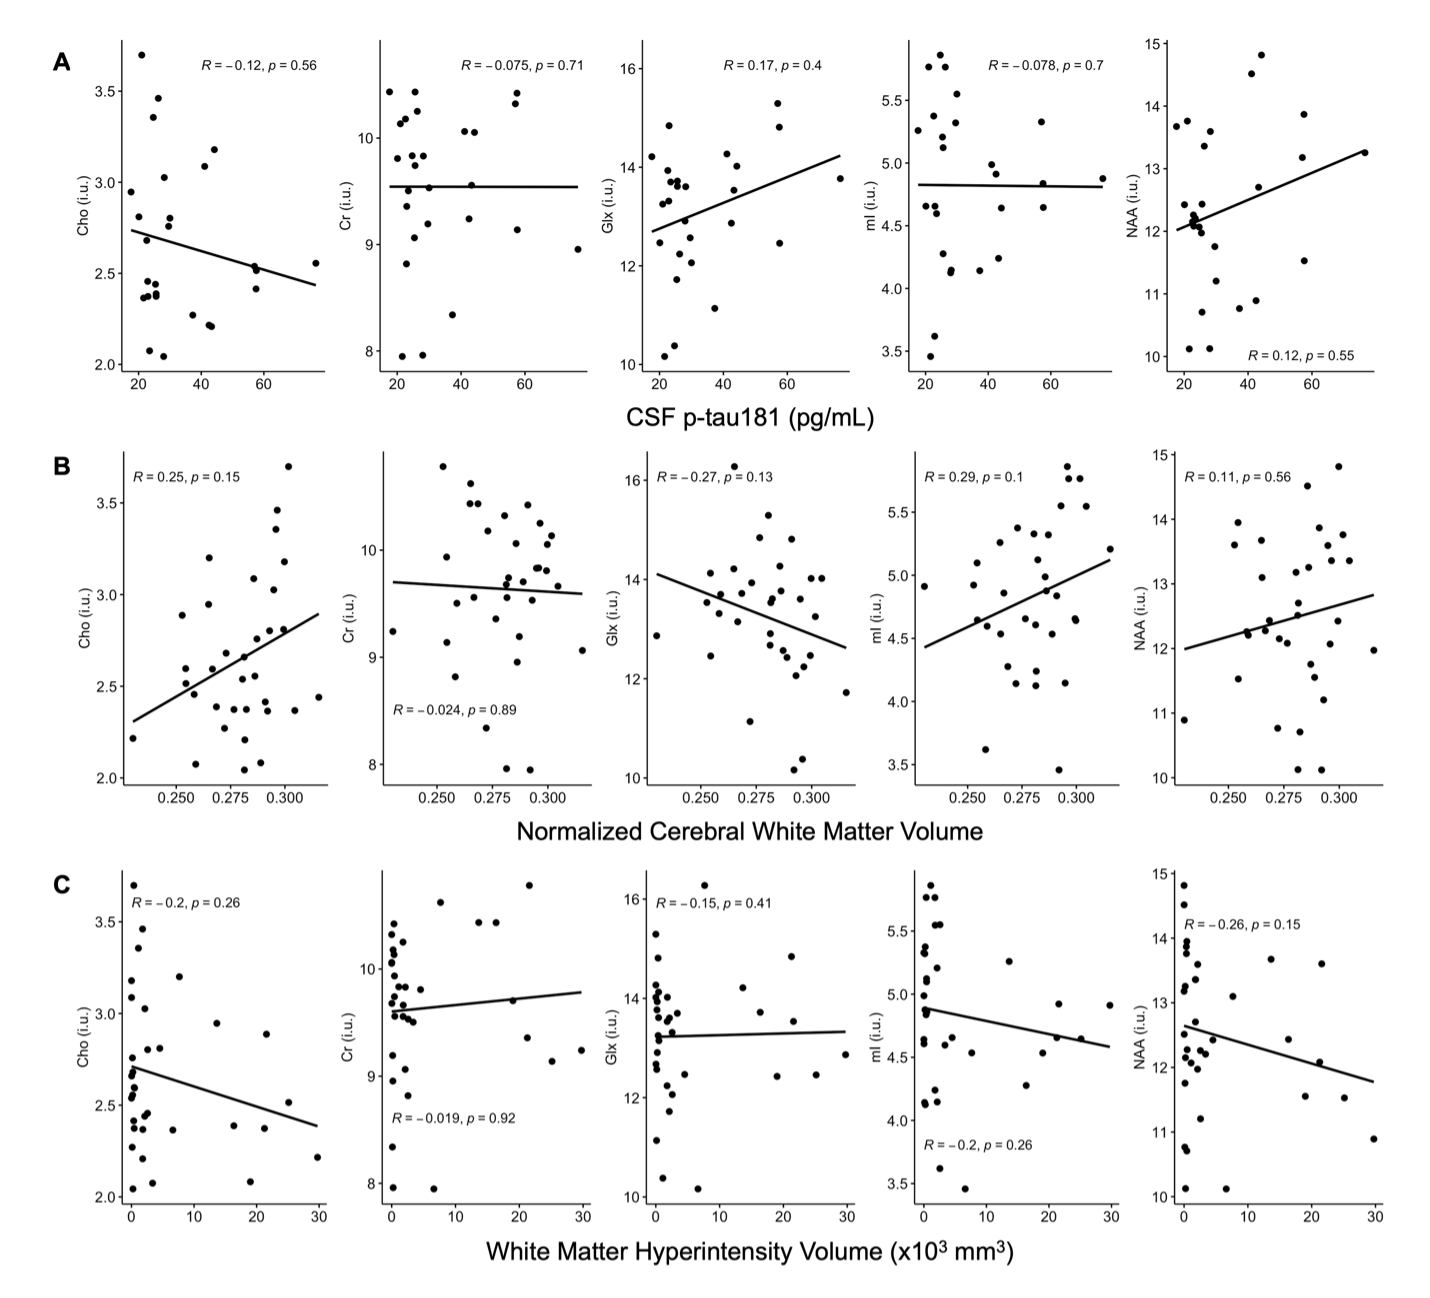
Figure 3. Spearman’s correlations were performed to examine metabolite levels and their associations with (A) CSF p-tau181 levels, (B) normalized total white matter (WM) volume, and (C) WM hyperintensity volume. No significant relationships were observed.