2030
Simultaneous Assessment of Microstructural integrity and Metabolite Profile from Superior Longitudinal Fasciculus in Normal Healthy Brains1Radiology, University of Pennsylvania, Philadelphia, PA, United States, 2Radiology, University of Miami, Miami, FL, United States, 3Centre for Preclinical Imaging, University of Liverpool, Liverpool, United Kingdom
Synopsis
Keywords: White Matter, Brain, Whole brain spectroscopic imaging, neurite orientation distribution and density imaging, Superior longitudinal fasciculus
Motivation: Superior longitudinal fasciculus (SLF) is critical in multiple normal functions. It is imperative to co-localize white-matter tract of SLF with metabolite maps to facilitate simultaneous analysis of microstructural integrity and metabolite alterations.
Goal(s): To evaluate relationships among metabolite ratios and diffusion MRI derived parameters along the path of SLF in normal healthy adults.
Approach: The associations between whole brain spectroscopy derived Cho/Cr, Cho/NAA ratios and diffusion MRI derived FA, MD, fICVF, fIso and ODI parameters were assessed along the length of SLF segments II-III.
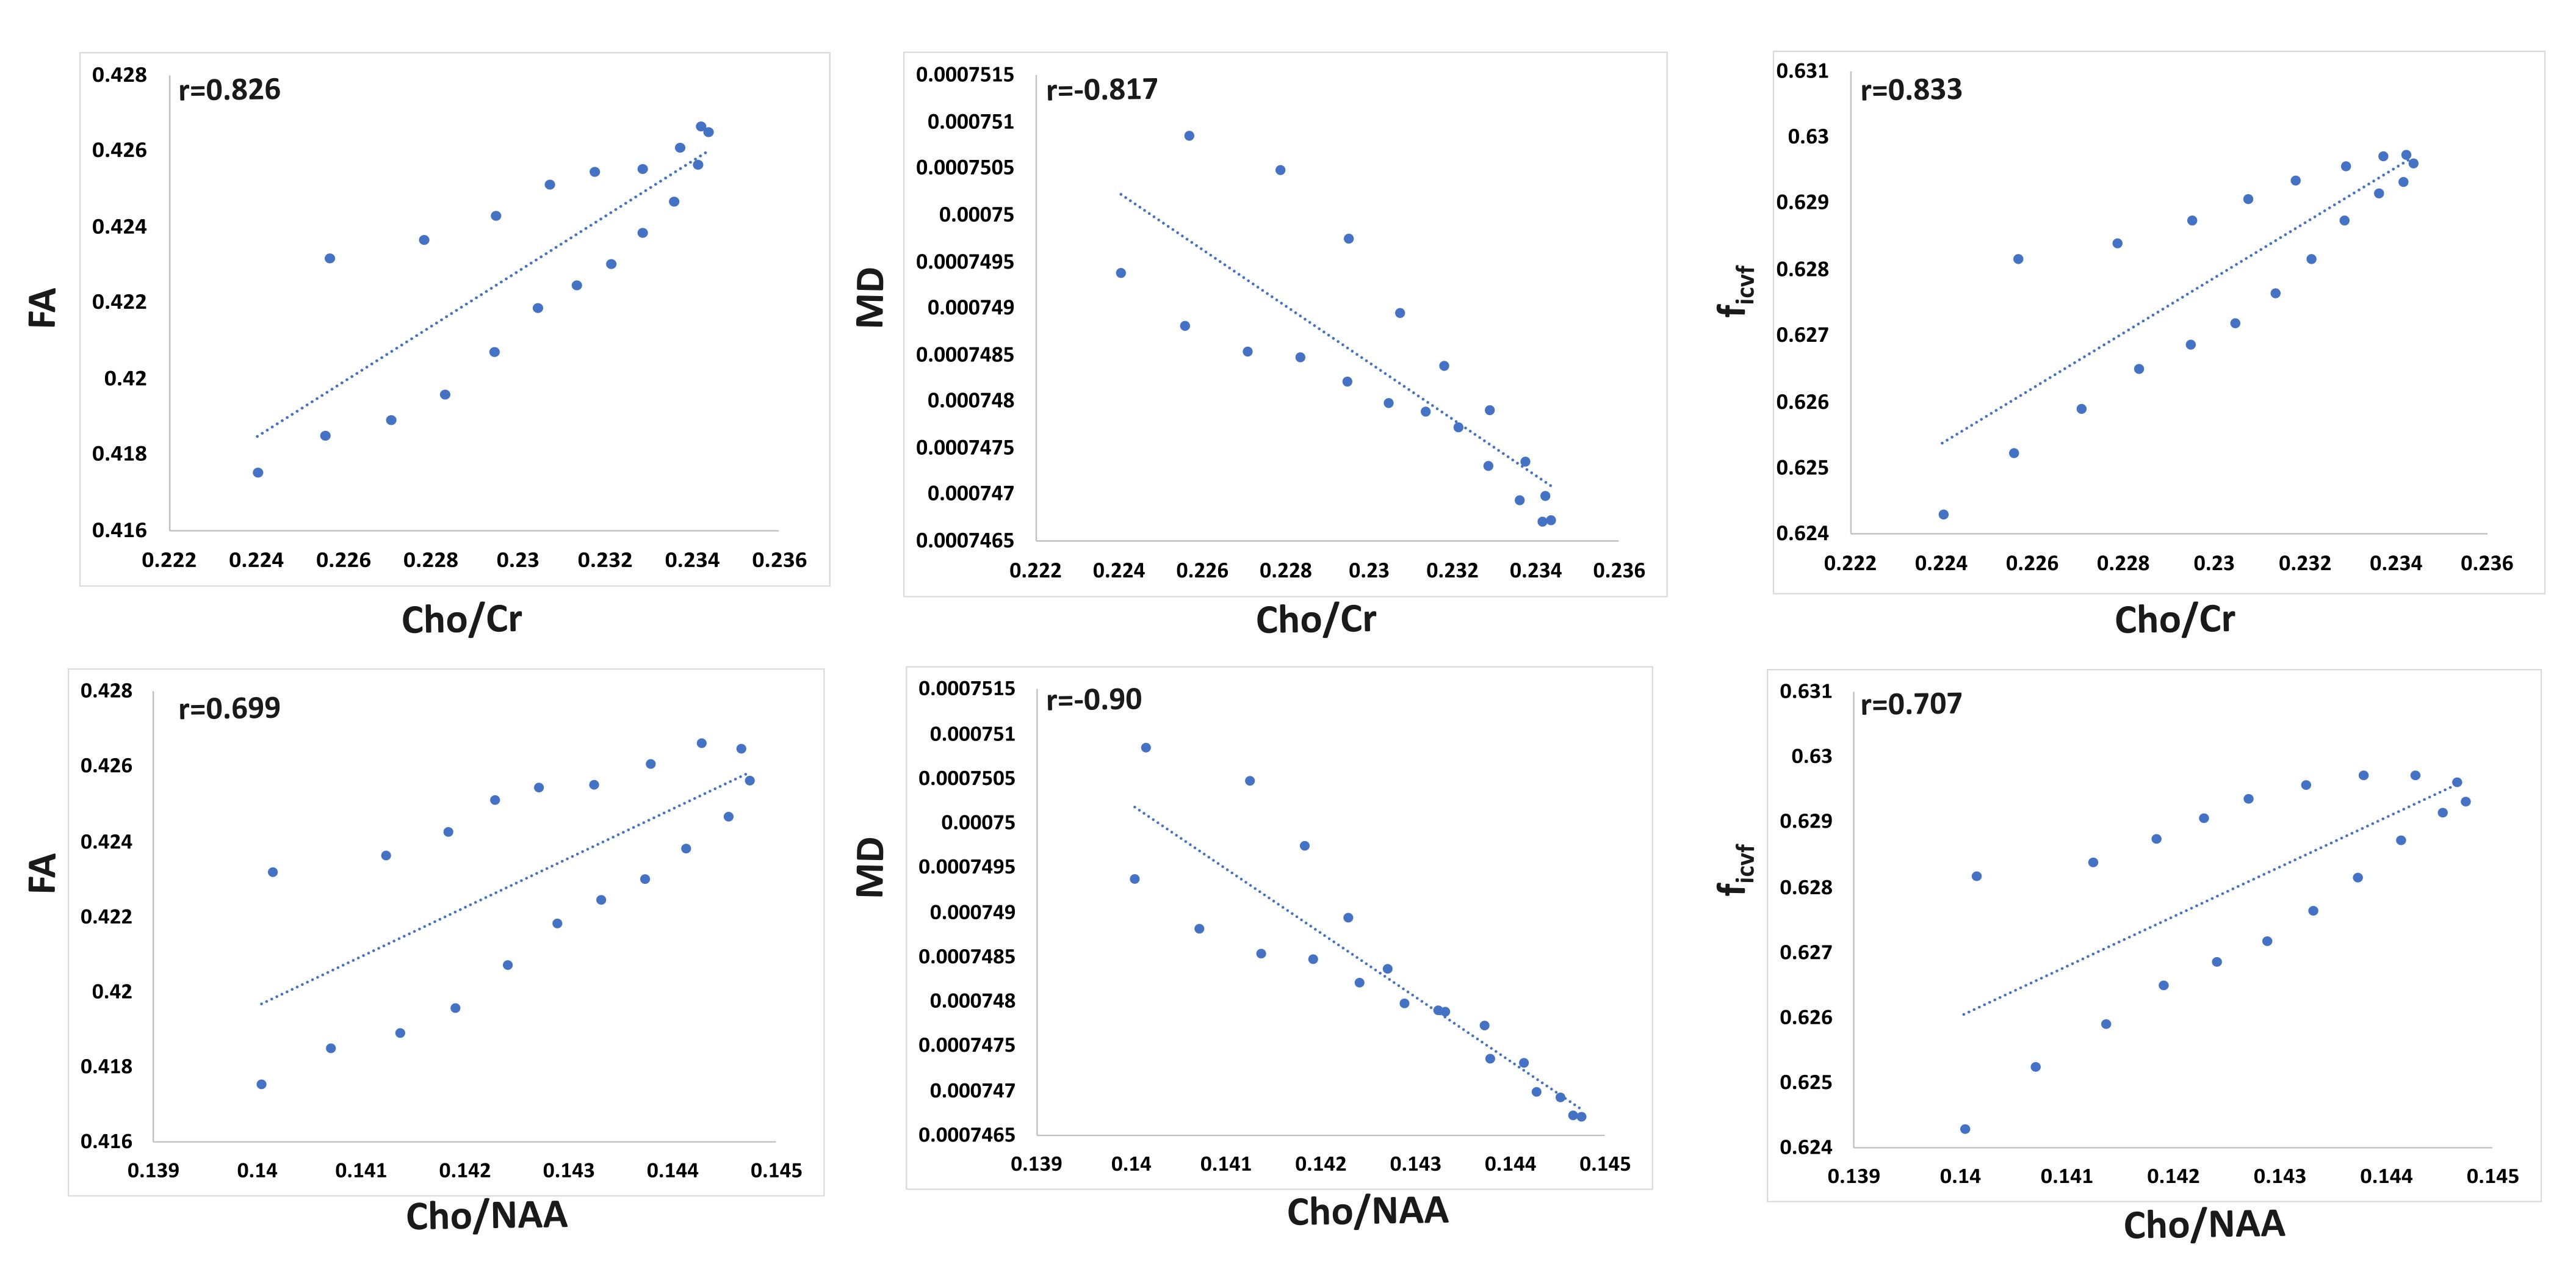
Results: Strong significant correlations between Cho/Cr and Cho/NAA ratios and FA, MD, ficvf were observed.
Impact: Diffusion MRI and whole brain spectroscopy could be used to study the covariation of white matter microstructure and metabolism. Multiparametric normative tract profiles established over larger cohorts could serve as the basis for early detection of white matter anomalies.
Introduction
Superior longitudinal fasciculus (SLF) is the largest associative fiber bundle comprising of four segments (SLF I-III and arcuate fasciculus) in the brain. The SLF is involved in several vital normal functions such as cognition, visuospatial attention and memory, motor control, and comprehension of language [1]. However, microstructural integrity of SLF is known to be compromised in many neuropsychological conditions including psychosis, schizophrenia, bipolar disorders, attention-deficit hyperactivity disorder (ADHD). Several studies have also reported significant metabolite alterations in schizophrenia patients [2][3]. Despite documenting significant differences in diffusion MRI derived parameters between normal controls and schizophrenia patients, no significant differences in metabolite pattern from brain regions encompassing SLF were observed between two groups in a study [4]. This might be due to the fact that conventional proton MR spectroscopy (1H-MRS) and diffusion MRI (dMRI) voxels were not co-registered together. With this limitation in mind, this methodological study was designed (i) to overlay metabolite maps on SLF-II and III segments (ii) to assess the metabolite distribution along the path of SLF-II and III segments across various regions and (iii) to evaluate the relationships among metabolite ratios and (dMRI) derived parameters from SLF-II and III segments in normal healthy adults.Methods
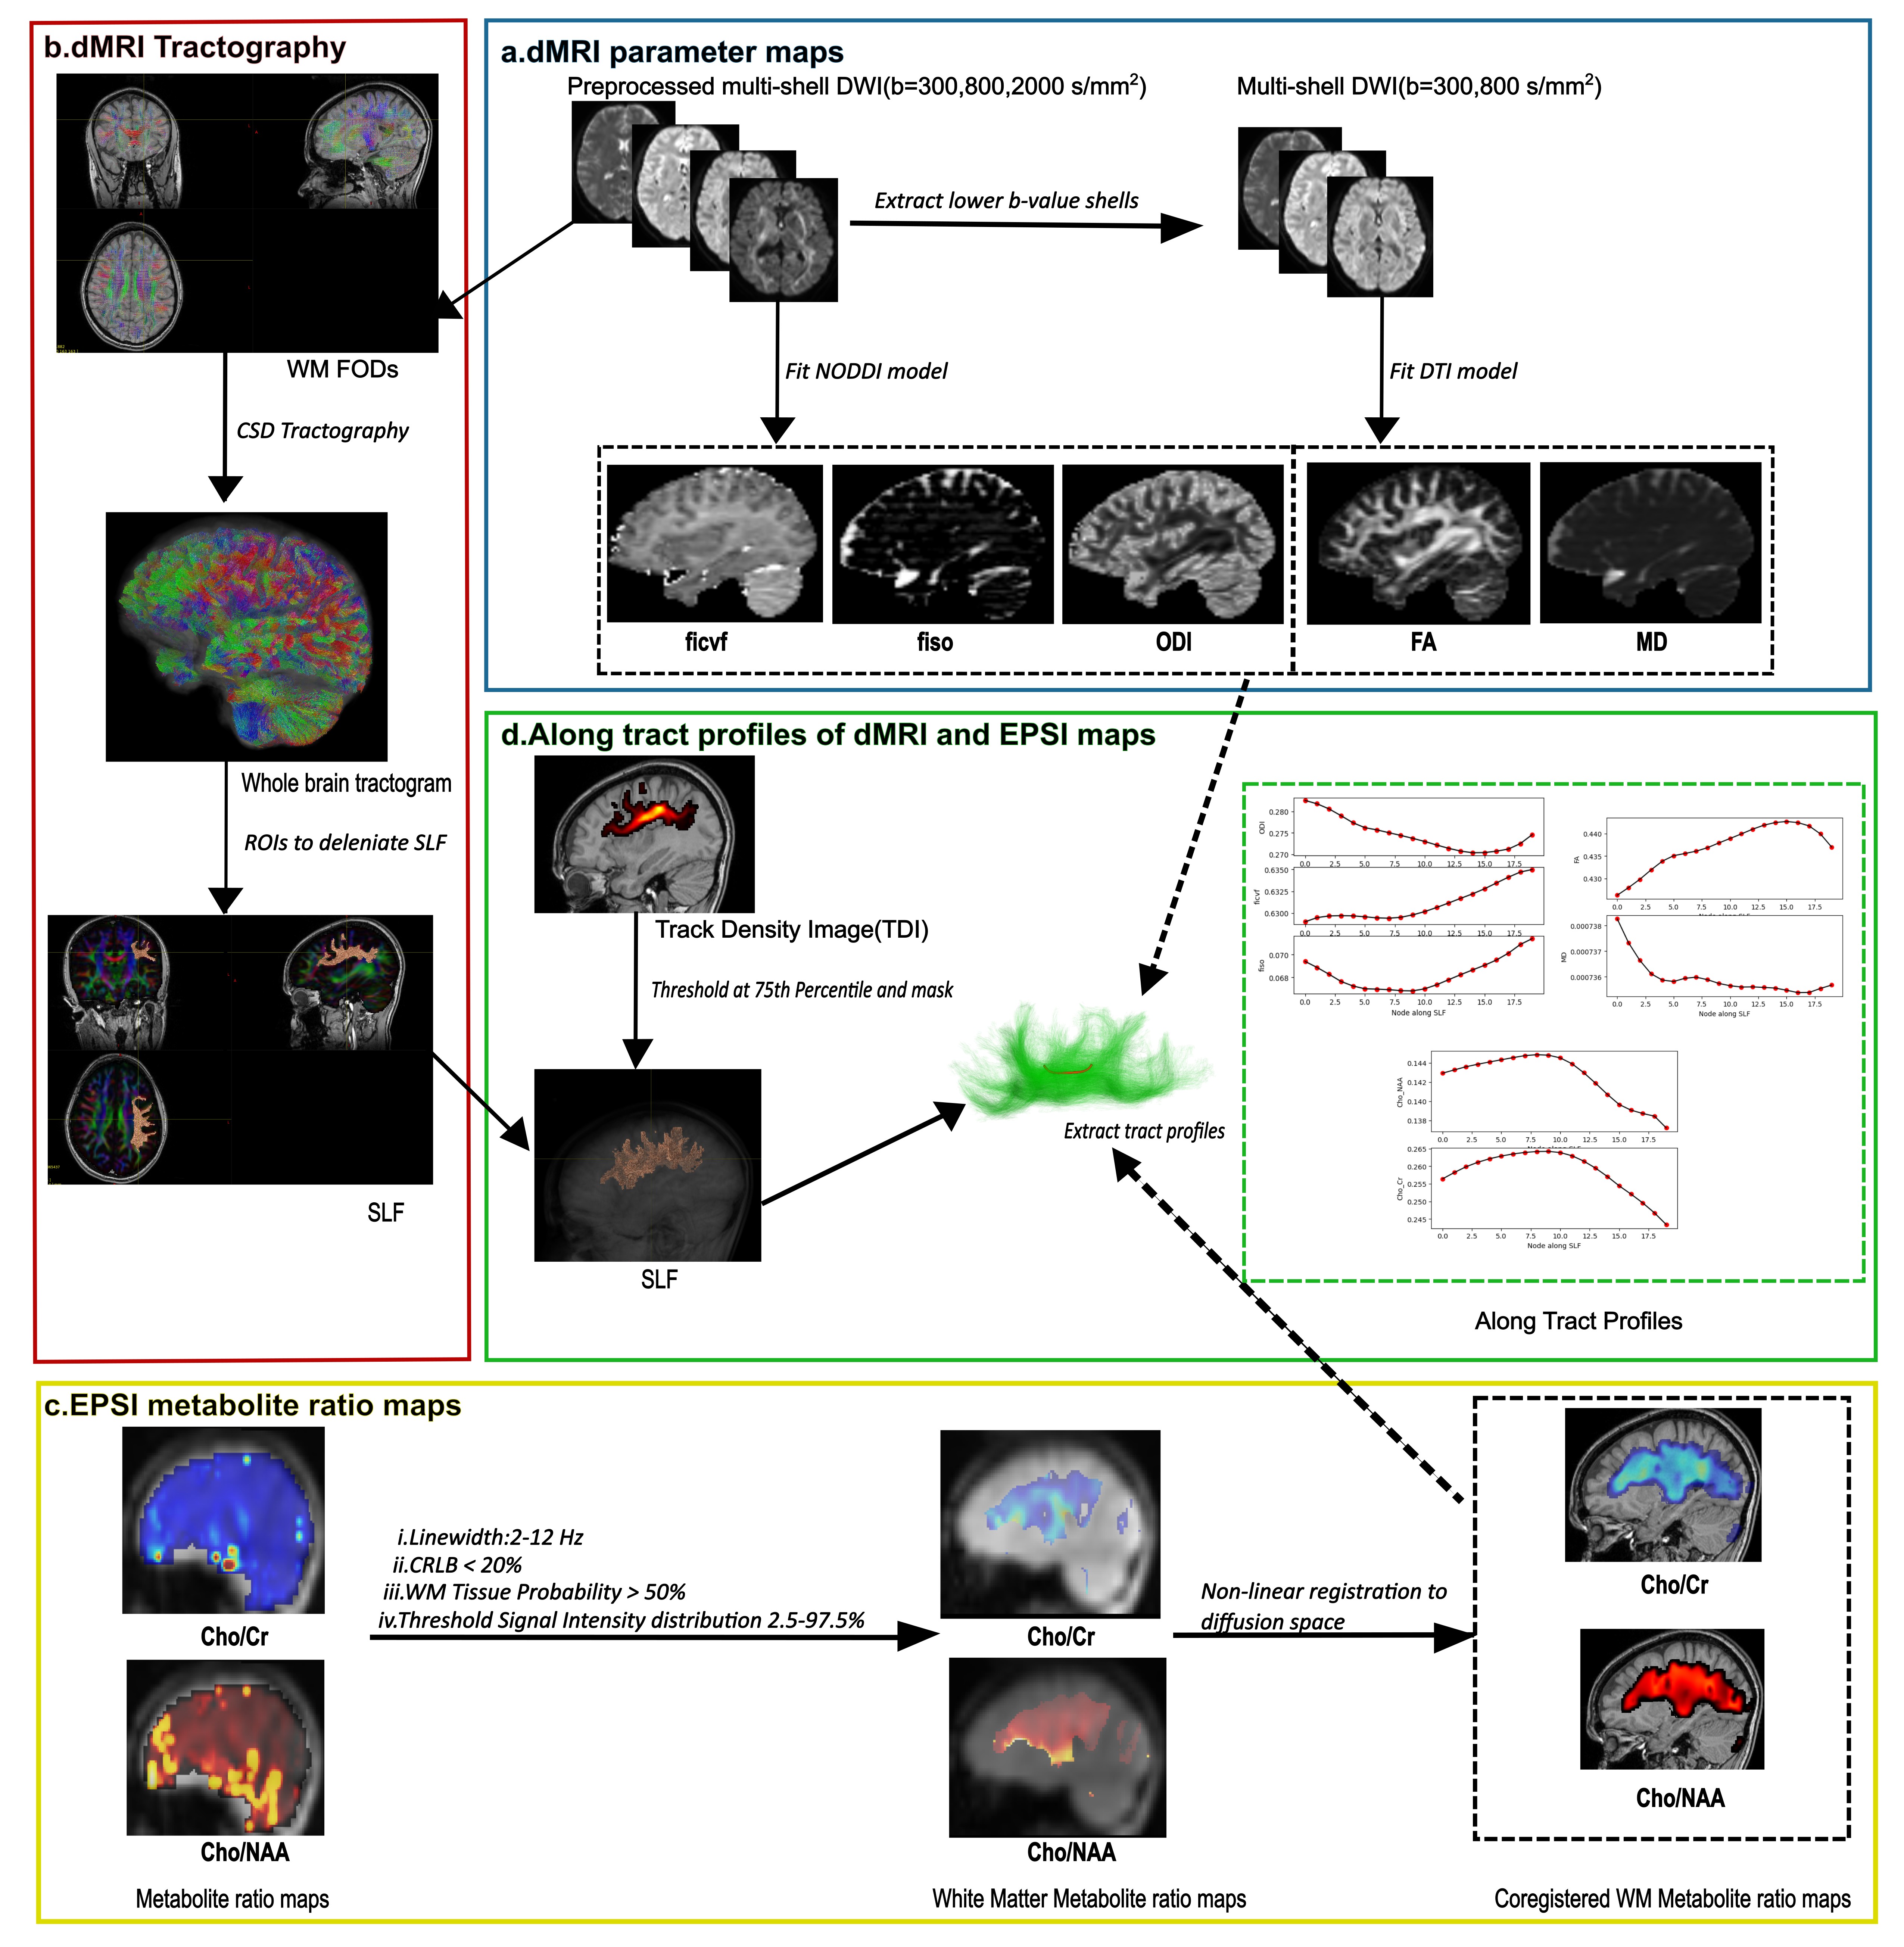
Whole brain spectroscopic imaging (WBSI) and high angular resolution diffusion imaging (HARDI) sequences were acquired from three healthy normal adults (age: 33.67 ± 2.52 years; 2M/1F) on a 3T MRI scanner. The overview of the image processing pipeline is presented in Figure 1. The WBSI was analyzed using MIDAS package and the processing steps involved field inhomogeneity and eddy current correction, k-space regridding, spatial and Fourier transformation [5][6]. In each case, quality assurance was evaluated by considering Cramer-Rao lower bounds (<20%), line shape, line width (2-12Hz), CSF contamination, and degree of residual water and lipid signals. Finally, parametric maps of choline/N-acetylaspartate (NAA) and choline/creatine (Cr) were computed. Subsequently, only those voxels in the maps that had greater than 50% probability of white matter tissue were retained for further analysis [7][8]. A three-shell diffusion imaging protocol with b-values of 300, 800 and 2000s/mm2 was used to generate neurite orientation dispersion density imaging (NODDI) derived intra-cellular volume fraction(ficvf), isotropic volume fraction(fiso) and orientation density index (ODI) [9] and diffusion tensor imaging (DTI) derived mean diffusivity (MD) and fractional anisotropy (FA) maps. Additionally, whole brain tractograms were generated using constrained spherical deconvolution (CSD) tractography method [10]. Then two seed ROIs were drawn manually on frontal and parietal regions as described previously [11] to delineate components II and III of SLF. In the next step, white matter maps of Cho/Cr and Cho/NAA were co-registered to non-diffusion weighted (b0) image. The entire tract involving SLF II and III was divided into 20 anatomically distinct sections [12]. Subsequently, section-wise mean values of parameters (MD, FA, fiso, ficvf , ODI, Cho/NAA and Cho/Cr) for each tract profile were computed from all three subjects. To assess the covariance between microstructural and metabolite metrics, two-tailed Pearson’s correlation analyses were performed. The significance level was set at p<0.01.Results
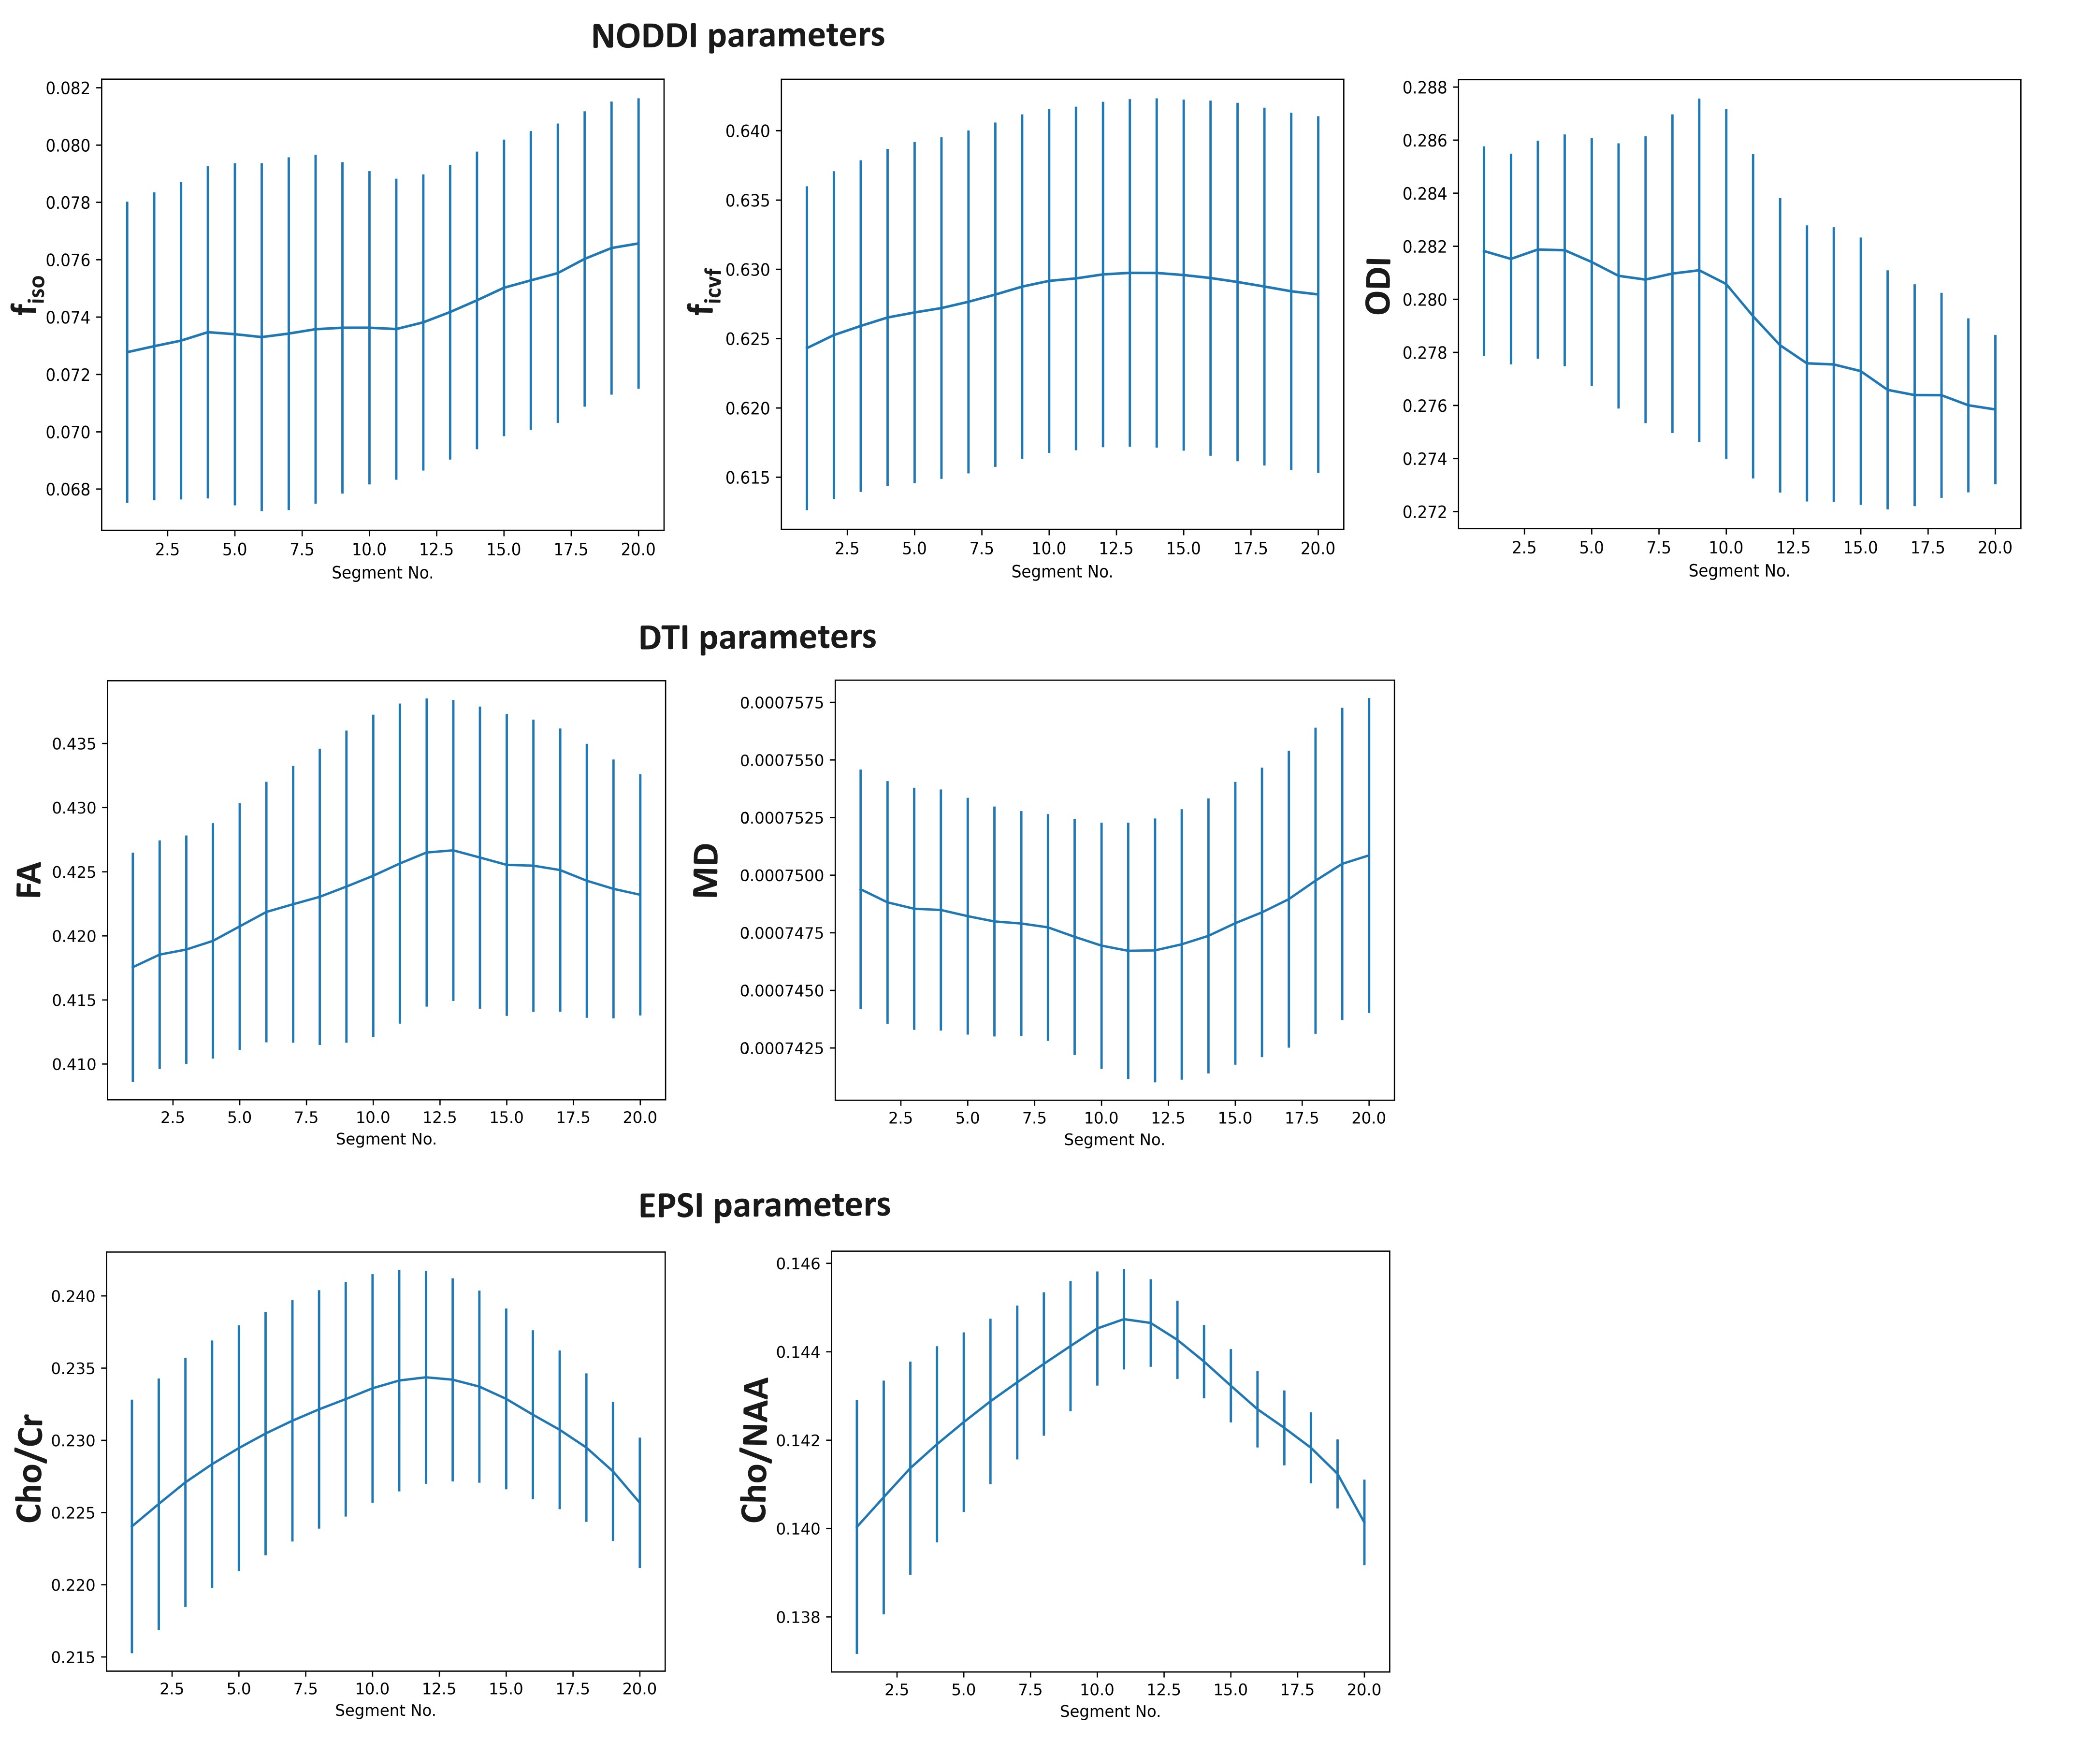
We were able to successfully overlay metabolite maps (Cho/NAA and Cho/Cr) over the SLF-II and III segments in all three cases. The distributions of WBSI and dMRI derived parameters across 20 anatomical sections of SLF-II and III from three subjects are shown in figure 2. As shown in figure 3, strong positive correlations between WBSI derived Cho/Cr and Cho/NAA and dMRI derived FA and ficvf were observed. Additionally, strong negative correlations between WBSI derived Cho/Cr and Cho/NAA and dMRI derived MD were noted.Discussion
To our knowledge, no previous study has exploited the combined use of whole-brain spectroscopy and tract based data analytical approach in co-localizing SLF-II and III segments and metabolite maps. In general, distinct large voxels (typically in order of 2 x 2 x 2 cm3) are manually placed along the length of white matter tracts mainly relying on subjective and potentially inconsistent judgments about the anatomical landmarks. This archaic approach renders data harmonization across subjects highly challenging. On the other hand, our proposed approach may allow more objective and unbiased assessment of regional metabolite patterns along the path of SLF. Our study is small and cross-sectional involving only three normal healthy individuals and requires validation in larger cohorts.Conclusion
The dMRI derived white matter microstructural maps and WBSI derived metabolite maps, provide complementary information about the microstructural integrity of SLF. These findings may be useful for assessing white matter integrity of SLF-II and III segments under multiple pathological conditions.Acknowledgements
No acknowledgement found.References
[1] Wang, X., Pathak, S., Stefaneanu, L., Yeh, F. C., et al.(2016). Subcomponents and connectivity of the superior longitudinal fasciculus in the human brain. Brain Structure and Function, 221, 2075-2092.
[2] Hardy, C. J., Tal, A., Babb, J. S., et al. (2011). Multivoxel proton MR spectroscopy used to distinguish anterior cingulate metabolic abnormalities in patients with schizophrenia. Radiology, 261(2), 542-550.
[3] Aydin, K., Ucok, A., & Cakir, S. (2007). Quantitative proton MR spectroscopy findings in the corpus callosum of patients with schizophrenia suggest callosal disconnection. American journal of neuroradiology, 28(10), 1968-1974.
[4] Rowland, L. M., Spieker, E. A., Francis, A., et al. (2009). White matter alterations in deficit schizophrenia. Neuropsychopharmacology, 34(6), 1514-1522.
[5] Maudsley, A. A., Darkazanli, A., Alger, et al. (2006). Comprehensive processing, display, and analysis for in vivo MR spectroscopic imaging. NMR in Biomedicine, 19(4), 492-503.
[6] Verma, G., Chawla, S., Mohan, S., et al. (2019). Three‐dimensional echo planar spectroscopic imaging for differentiation of true progression from pseudoprogression in patients with glioblastoma. NMR in Biomedicine, 32(2), e4042.
[7] Li, X., Abiko, K., Sheriff, S., Maudsley, A. A.,et al. (2022). The Distribution of Major Brain Metabolites in Normal Adults: Short Echo Time Whole-Brain MR Spectroscopic Imaging Findings. Metabolites, 12(6), 543.
[8] Govind, V., Sharma, K. R., Maudsley, A. A., et al. (2012). Comprehensive evaluation of corticospinal tract metabolites in amyotrophic lateral sclerosis using whole-brain 1H MR spectroscopy. PloS one, 7(4), e35607.
[9] Zhang, H., Schneider, T., Wheeler-Kingshott, C. A., et al. (2012). NODDI: practical in vivo neurite orientation dispersion and density imaging of the human brain. Neuroimage, 61(4), 1000-1016.
[10] Tournier, J. D., Yeh, C. H., Calamante, et al. (2008). Resolving crossing fibres using constrained spherical deconvolution: validation using diffusion-weighted imaging phantom data. Neuroimage, 42(2), 617-625.
[11] Kamali, A., Flanders, A. E., Brody, J., et al. (2014). Tracing superior longitudinal fasciculus connectivity in the human brain using high resolution diffusion tensor tractography. Brain Structure and Function, 219, 269-281.
[12] Chamberland, M., Raven, E. P., Genc, et al. (2019). Dimensionality reduction of diffusion MRI measures for improved tractometry of the human brain. NeuroImage, 200, 89-100.
Figures